2.67 Deviation from Expectation: Trend Projection as a Signal
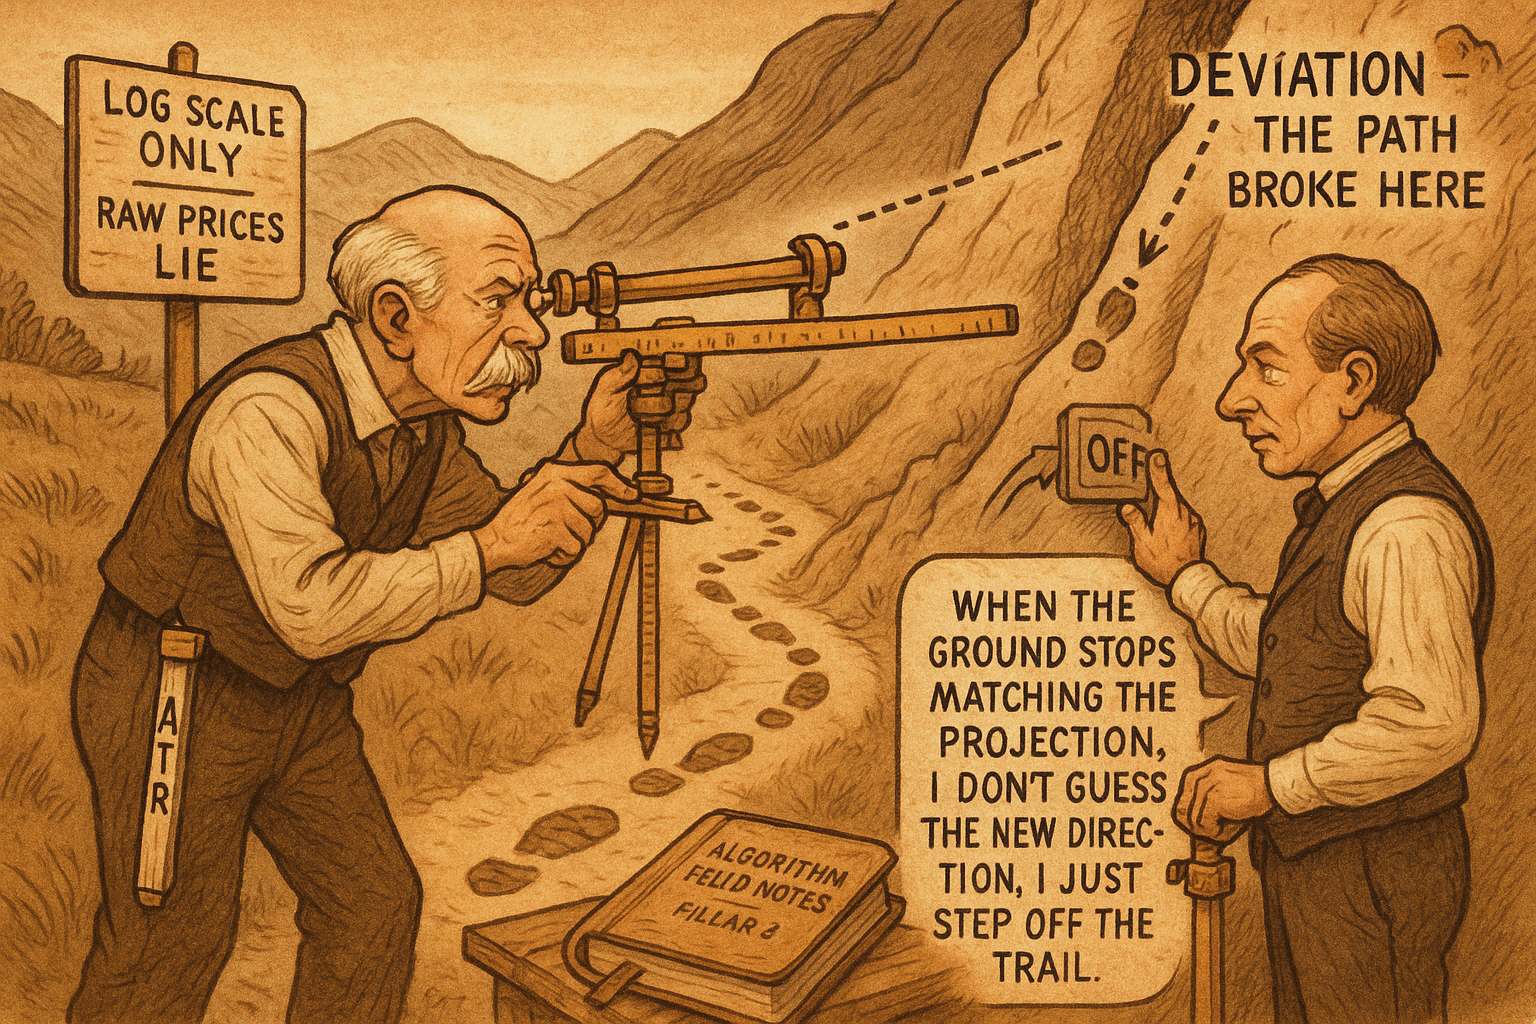
Fit a trend, project it one bar forward, and subtract it from the actual close. A small gap means the trend holds; a big one means it just broke. A regime-break kill switch, built on log prices and ATR, not raw price.
A moving average tells you where price has been. Fit a trend and extend it one bar into the future, and you get something a trailing average cannot give you: a number for where price should be right now if the trend that has been running simply continued. The gap between that projection and the actual close is the indicator, and it does a specific job no trend-following tool does. It flags the moment the trend breaks. The old article "CMMA: A Better Momentum Primitive Than Price-minus-MA Alone" built its edge on a residual, price minus a trailing baseline; this swaps the trailing baseline for a forward-projected one, and the residual now measures surprise rather than stretch.
Project the trend, then subtract it
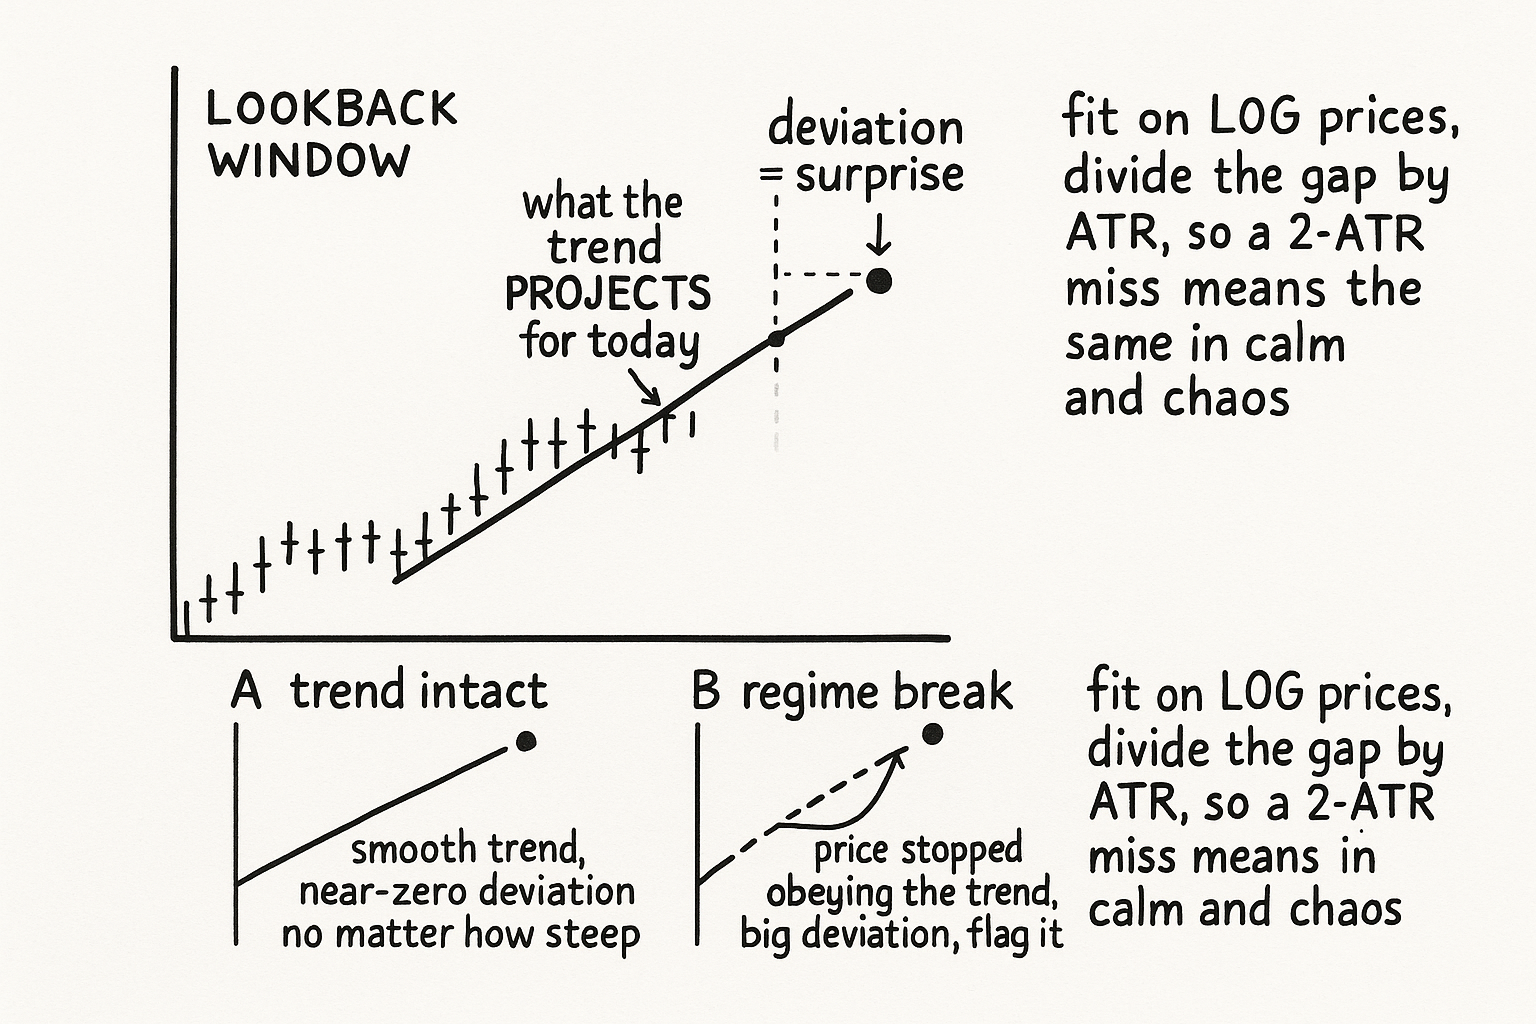
The construction has two steps. First, quantify the trend over a lookback window with a fit that has a slope you can extend, a linear regression line or a low-order polynomial through the recent prices. Then evaluate that fitted curve at the current bar, treating it as the price the trend predicts, and subtract it from what actually printed.
$$ \widehat{P}_t = \text{fit}\big(P_{t-n},\dots,P_{t-1}\big)\ \text{projected to } t \qquad \text{Dev}_t = \frac{\log P_t - \log \widehat{P}_t}{\text{ATR}} $$
The hatted term is the trend's projection for the current bar, fit over the n prior bars and extrapolated forward; the deviation is the actual log price minus that projection, divided by ATR. Read the sign and size together. A deviation near zero means price landed where the trend expected, the trend is intact, nothing surprising happened. A large positive or negative deviation means price jumped out of line with its own established trajectory, which is exactly the event you want flagged: a regime break, a shock, a trend that just stopped behaving like a trend. This is the old CMMA logic with the baseline turned around. CMMA asks how far price has stretched from a trailing average; deviation from expectation asks how far price missed a forward projection, and the miss is a cleaner regime-break detector because a smooth continuing trend produces a small deviation no matter how steep it is.
Why you cannot do this on raw price
The old article "The Case Against Raw Price Indicators" spelled out why raw price is unusable: non-stationary in mean, non-stationary in variance, incomparable across instruments. Every one of those defects would poison this indicator if you were careless, and the construction dodges them deliberately. Fit on log prices, not prices, so the trend is a constant-percentage growth line rather than a dollar line that means different things at 300 and 5500. Take the deviation as a difference of logs, which is stationary in mean because it is centered on the projection rather than on an absolute level. Divide by ATR, including the current bar, so the deviation is in volatility units and a two-ATR miss reads as the same surprise whether the market is calm or wild and whether the instrument is a quiet bond or a frantic crypto.
The deviation itself is the cure for raw price's disease. Raw close drifts with the level; the deviation from a projected trend has no level, only a surprise measured in volatility units, so it stays stationary and comparable across the regimes that destroy a raw-price feature.
A break detector, not an entry signal
The deviation from expectation earns its keep as a regime-change flag, and that is a different role from most indicators. A large deviation does not tell you which way to trade; it tells you that the trend your other tools are riding may have just ended, which makes it a natural kill switch for a trend-following system rather than a standalone signal. When the deviation blows out, the assumption that the trend continues has failed, and a trend system leaning on that assumption should stand down or tighten until price settles back onto a projectable path. The fit type and the lookback are real parameters: a short window projects a twitchy trend that throws large deviations on noise, a long one projects a stale trend that misses genuine breaks late, and the choice of linear versus polynomial decides whether you assume straight-line or curving continuation. Like every rolling fit, the projection must be computed from bars strictly before the current close, or the deviation is contaminated by the very bar it is supposed to be surprised by. And the deviation only flags that something changed, never what comes next, so it belongs alongside a directional view, not in place of one.
KEY POINTS
- Fit a trend over a lookback (linear or low-order polynomial), project it one bar forward, and subtract that projection from the actual close. The residual is the indicator.
- A near-zero deviation means price landed where the trend expected; a large one means price broke from its own trajectory, which makes this a regime-break detector rather than a stretch gauge.
- It is the old CMMA residual logic with a forward-projected baseline instead of a trailing average, so a smooth continuing trend produces a small deviation no matter how steep.
- Avoid the raw-price traps from the old raw-price article: fit on log prices, take the deviation as a log difference, and divide by ATR (including the current bar) so the surprise is stationary and comparable across regimes and instruments.
- Use it as a kill switch for a trend system, not an entry signal; it flags that the trend may have ended without saying which way price goes next. The fit type and lookback are tunable, and the projection must be causal.