2.70 Intraday Intensity and Chaikin Money Flow, Made Stationary
Raw Intraday Intensity whipsaws and drifts upward for years as volume grows, useless. Divide summed money flow by summed volume and you get Chaikin Money Flow: bounded, stationary, model-ready.
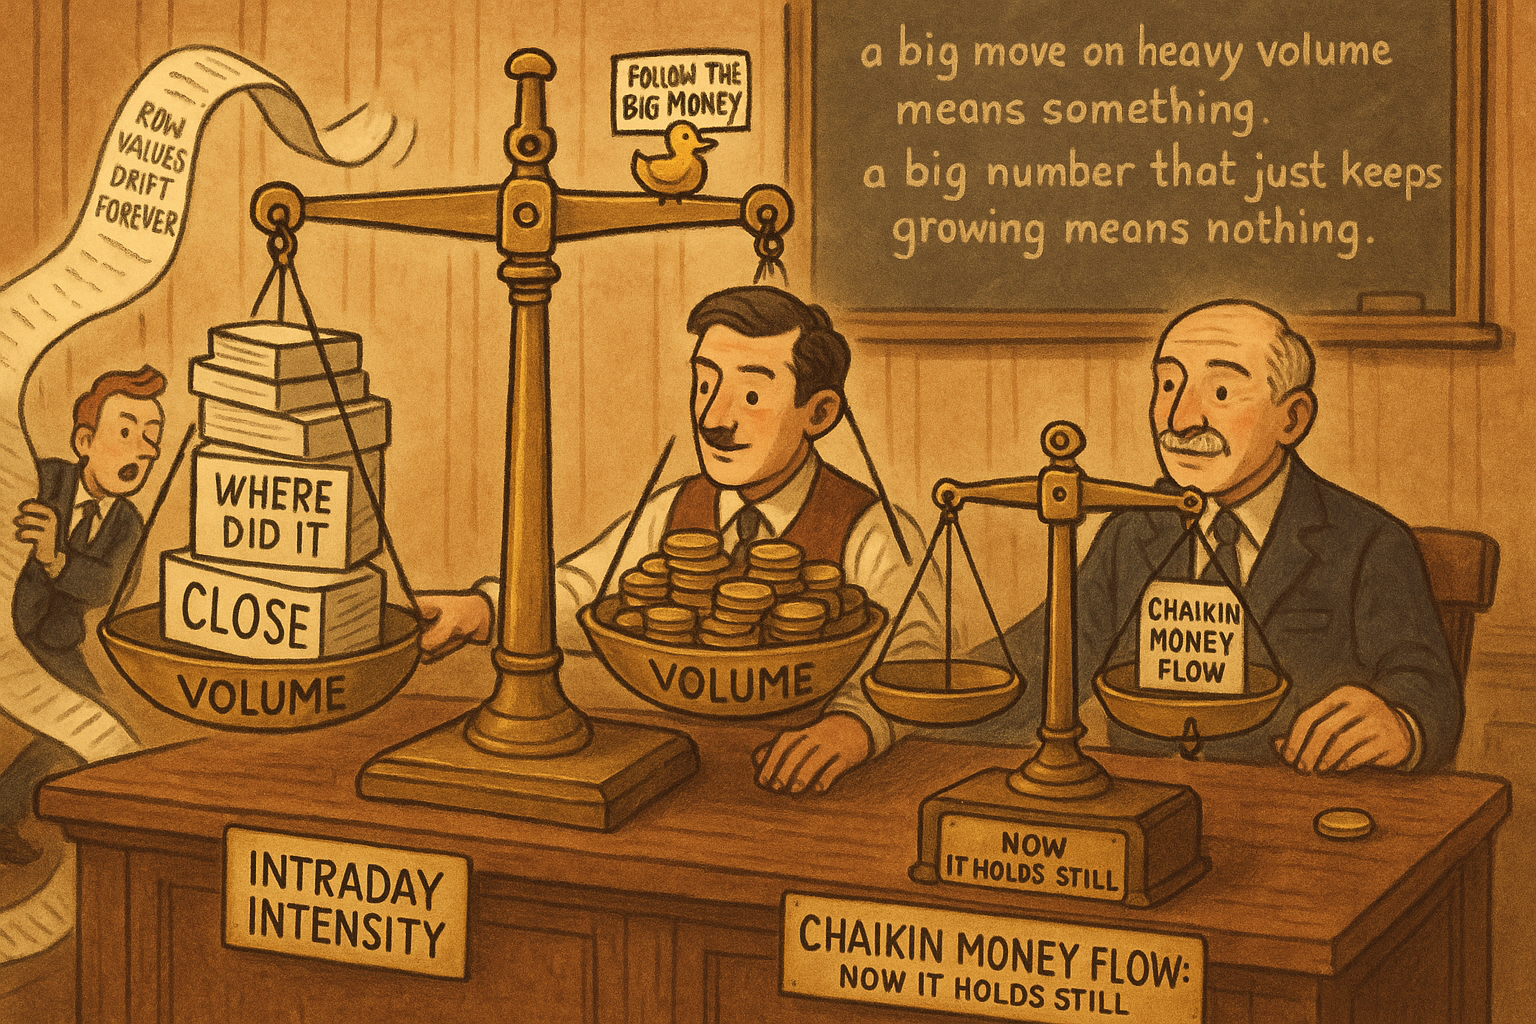
Volume indicators carry a promise that the price-only crowd never gets: the chance to see whether institutions, not retail, drove the bar. The folklore says big money executes in size and big money tends to be right, so a price move on heavy volume means something a price move on thin volume does not. Intraday Intensity tries to capture exactly that, pairing where the bar closed inside its range with how much volume traded. The raw version is unusable. It jumps with every volume spike, drifts upward for years as market volume grows, and feeds your model a number whose meaning changes from decade to decade. This article takes the raw idea apart, shows why the old article "The Case Against Raw Price Indicators" applies word for word to raw volume too, and rebuilds it into Chaikin Money Flow, a quantity you can drop into a model with no further work.
Where did the bar close inside its range
Start with the price half, no volume yet. Each bar has a high, a low, and a close, and the one fact worth extracting is whether the close landed near the top or near the bottom of the range. Compare the distance from close to low against the distance from high to close. Their difference collapses to a clean expression.
$$ (C - L) - (H - C) = 2C - H - L $$
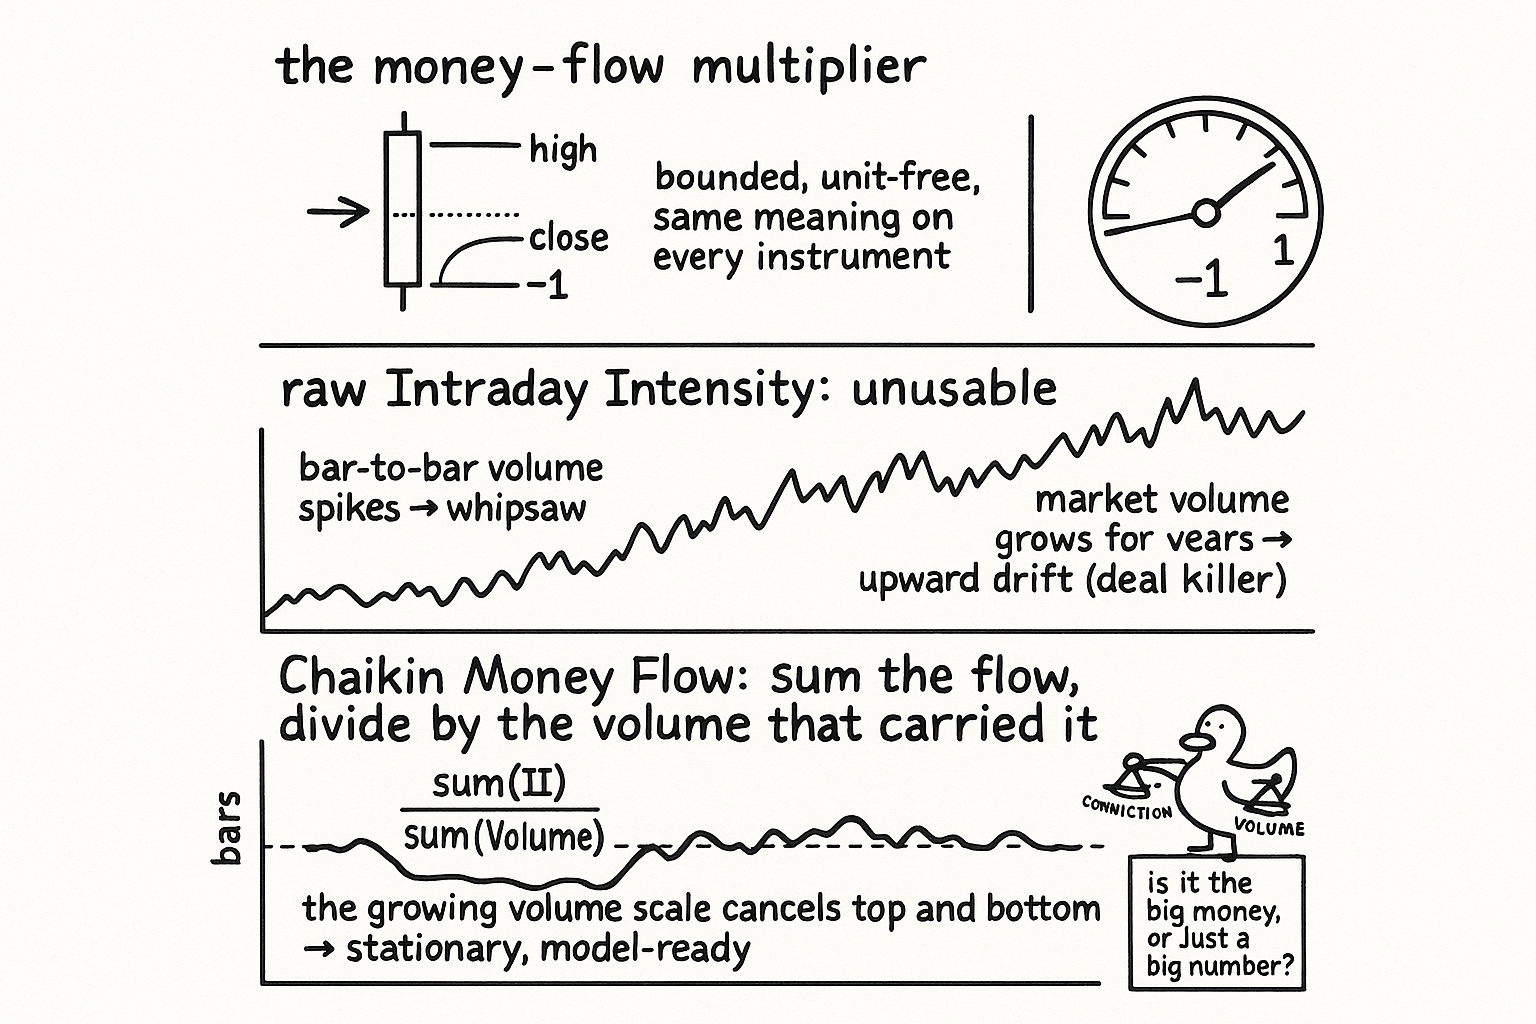
When the close sits at the high the term equals the full range and reads positive; when the close sits at the low it equals the negative range. So 2C minus H minus L is a raw conviction reading: large and positive means buyers closed the bar on their highs, large and negative means sellers slammed it shut on the lows. The problem is scale. That number is in price units, so a 2-dollar close-off-the-low on a 200-dollar stock and a 2-tick close-off-the-low on a currency are not comparable, and the same instrument changes its dollar range as its price level and volatility drift. Divide by the bar range to strip the units and you get a dimensionless multiplier bounded between minus one and plus one.
$$ m = \frac{2C - H - L}{H - L} $$
This multiplier is the heart of every money-flow indicator. It says nothing about magnitude in dollars, only about position inside the range: plus one is a close exactly at the high, minus one a close exactly at the low, zero a close in the dead center. The old article "Why Most Indicators Should Be Transformed Before Modeling" makes the case for exactly this kind of move, trading a scale-bound raw number for a bounded ratio that means the same thing on every instrument.
Adding volume, and breaking the indicator in the process
Now weight that conviction by participation. A close on the high means more when a million shares traded than when a thousand did, so multiply the multiplier by volume. Masters scales by the square root of volume rather than volume itself, because raw volume's tail is so heavy that the indicator would be dominated by a handful of monster bars; the square root pulls those spikes back toward the body without erasing them. Times one hundred for human-readable numbers gives raw Intraday Intensity.
$$ \text{II} = 100 \cdot \frac{2C - H - L}{H - L} \cdot \sqrt{V} $$
Read it straight and it is unusable, for three reasons that stack. First, bar-to-bar volume swings wildly, so the square-root-of-volume weight whipsaws the output even when the close position barely moves. Second, the close lands near the high on one bar and near the low on the next, flipping the multiplier's sign, so the product fluctuates with no stable level to read. Third, and this is the deal killer, market volume grows year over year as the asset matures and more participants pile in, so the absolute size of II ratchets upward over time with nothing to do with price behavior. The old article "The Case Against Raw Price Indicators" laid out why a feature whose mean and variance march upward over the years poisons every model class downstream: trees send out-of-range bars to one leaf, linear models extrapolate a slope they never saw, and your in-sample fit collapses live. Raw II fails that test the same way raw price does. Volume is even worse behaved than price, which is why the old article "Why Median Filters Are Useful for Volume and Outliers" singled volume out as the worst-case input for any linear filter.
Dividing the flow by the volume that carried it
The cure is to stop reading II as an absolute number and start reading it as a fraction of the volume that produced it. Sum the raw money flow over a rolling window, sum the volume over the same window, and divide. The ever-growing volume scale cancels top and bottom, and the result is Chaikin Money Flow.
$$ \text{CMF} = 100 \cdot \frac{\sum_{i=0}^{K-1} \text{II}(i)}{\sum_{i=0}^{K-1} V(i)} $$
Both the wild bar-to-bar jumps and the multi-decade drift die in one operation. The numerator carries the conviction-weighted volume, the denominator carries the total volume, and their ratio is a stationary oscillator that means the same thing in 1995 and 2025. This is what the old article "How to Build Stationary Indicators from Non-Stationary Prices" calls dividing two quantities that share the same non-stationary driver: volume grows on top and bottom together, so the ratio holds still. CMF needs no further transform, no rolling z-score, no sigmoid; it lands ready for predictive modeling, which is rare and worth respecting.
A variant smooths each piece on its own clock instead of summing over a single window. Run a short simple moving average on the money flow and divide by a long exponential moving average of volume.
$$ \text{II}_{\text{smoothed}} = 100 \cdot \frac{\text{SMA}(\text{II})}{\text{EMA}(V)} $$
The only number that matters here is the length of the volume EMA. Volume is so erratic that you need several dozen bars of smoothing in the denominator before the ratio settles into something stationary; a short volume average leaves the spikes in and the indicator goes back to whipsawing. Pick the volume EMA long, longer than instinct suggests, and the money-flow numerator can stay short and responsive.
What it tells you and what it does not
CMF is a conviction gauge, not a direction oracle. A persistently positive reading says closes have been landing in the upper range on the heavier-volume bars, which the folklore reads as accumulation; persistently negative says distribution. Treat the folklore as a hypothesis, not a law. The claim that institutions know more is exactly that, a claim, and the old article on raw price indicators is a reminder that a clean construction does not make the underlying edge real, only testable. What the construction buys you is a feature that is stationary, bounded, and cross-instrument comparable, so when you test whether money flow predicts forward returns you are testing the signal and not an artifact of growing volume. That is the whole point of the rebuild: get the indicator honest first, then let the data say whether it works.
KEY POINTS
- The money-flow multiplier (2C minus H minus L) over the range is a bounded, unit-free reading of where the bar closed inside its range, plus one at the high and minus one at the low, comparable across every instrument.
- Intraday Intensity weights that multiplier by the square root of volume, scaling conviction by participation while the square root pulls the heavy volume tail back toward the body.
- Raw II is unusable on three counts: bar-to-bar volume swings whipsaw it, the close position flips sign every bar, and market volume drifts upward for years so the absolute level is non-stationary, the deal killer flagged in the old article "The Case Against Raw Price Indicators".
- Chaikin Money Flow divides summed II by summed volume over a rolling window, canceling the growing volume scale top and bottom, the exact trick from the old article "How to Build Stationary Indicators from Non-Stationary Prices", and lands stationary with no further transform.
- The smoothed variant SMA of II over EMA of volume works only if the volume EMA runs several dozen bars, because volume is erratic enough to demand heavy denominator smoothing, the worst-case input from the old article "Why Median Filters Are Useful for Volume and Outliers".
- CMF measures conviction, not direction; the construction makes the institutional-accumulation story testable, it does not make it true.