5.32 Volatility-Regime Quoting: Discrete Steps vs Continuous Widths
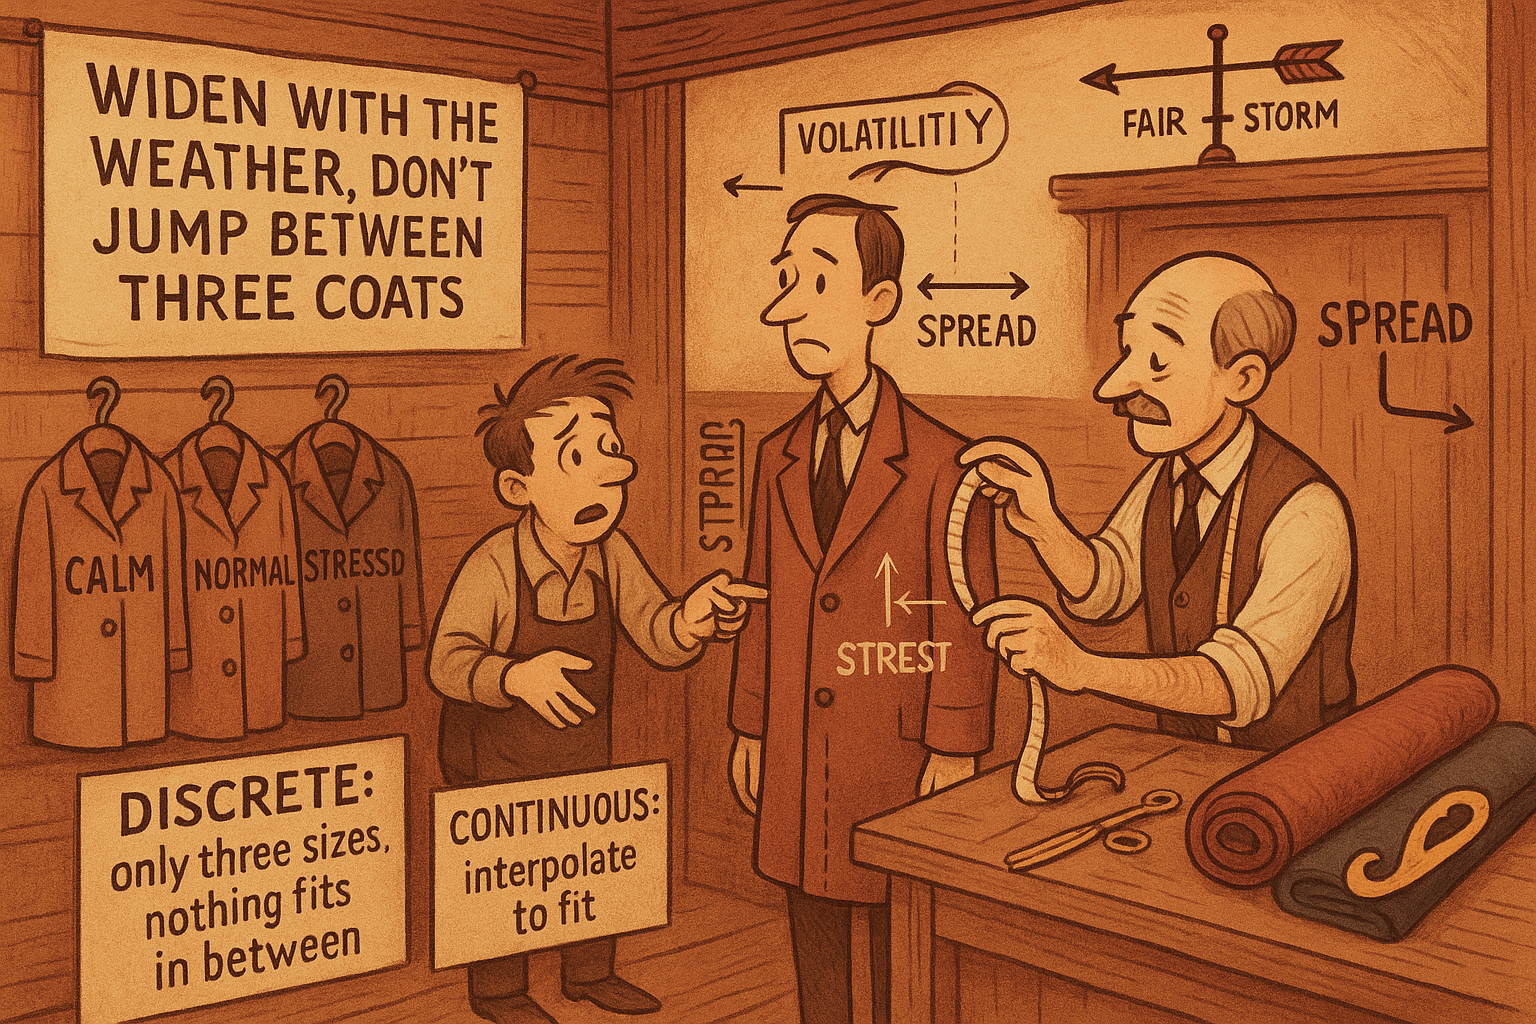
Your spread must track volatility, but how? Bucket volatility into three quantile regimes with fixed widths, or interpolate between them (linear, spline, sigmoid) so the spread glides instead of jumping at the boundary.
The old article "Spread Widening During Volatility Expansion" set the principle: your spread has to track volatility, because a markup that is safe in a calm tape is a gift to informed traders in a moving one. Principle is easy. The implementation question nobody resolves cleanly is the mapping itself. You have a volatility number coming in and a spread width going out, and the function connecting them is a design choice with real consequences. Get it crude and you either over-quote and miss fills or under-quote and bleed to adverse selection at the regime boundary.
There are two ways to build that mapping. The discrete one buckets volatility into a few regimes and assigns each a fixed width. The continuous one interpolates between those buckets so the width moves smoothly. Both start from the same place, and the second is a refinement of the first, not a different idea.
Step one: define the regimes by quantile
Do not pick volatility thresholds by eye. Use quantiles of the volatility distribution itself, which makes the regimes self-calibrating to whatever instrument and period you are in. The simplest cut is three regimes by tertile: the bottom third of volatility readings is the calm regime, the middle third is normal, the top third is stressed. You can also cut at extreme quantiles, the 0.9 say, if you only want to react to genuine tail volatility and quote a constant width the rest of the time.
The quantile approach matters because volatility is non-stationary, the same absolute volatility number is calm in one month and stressed in another, so a fixed numeric threshold rots. Quantiles ride the distribution. Re-estimate the quantile boundaries on a rolling window and your regime labels stay honest as the market's overall volatility drifts.
The discrete model: three regimes, three spreads
The blunt version assigns one spread width to each regime and switches between them.
$$ \text{spread} = \begin{cases} w_1 & \text{if } \sigma \le q_{1/3} \quad (\text{calm})\\[4pt] w_2 & \text{if } q_{1/3} < \sigma \le q_{2/3} \quad (\text{normal})\\[4pt] w_3 & \text{if } \sigma > q_{2/3} \quad (\text{stressed}) \end{cases} $$
Read it as a lookup: measure current volatility sigma, see which quantile band it falls in, quote the width for that band, with the three widths hand-set so w1 is tightest and w3 widest. It is trivial to build and trivial to reason about, which is why it is the right first version.
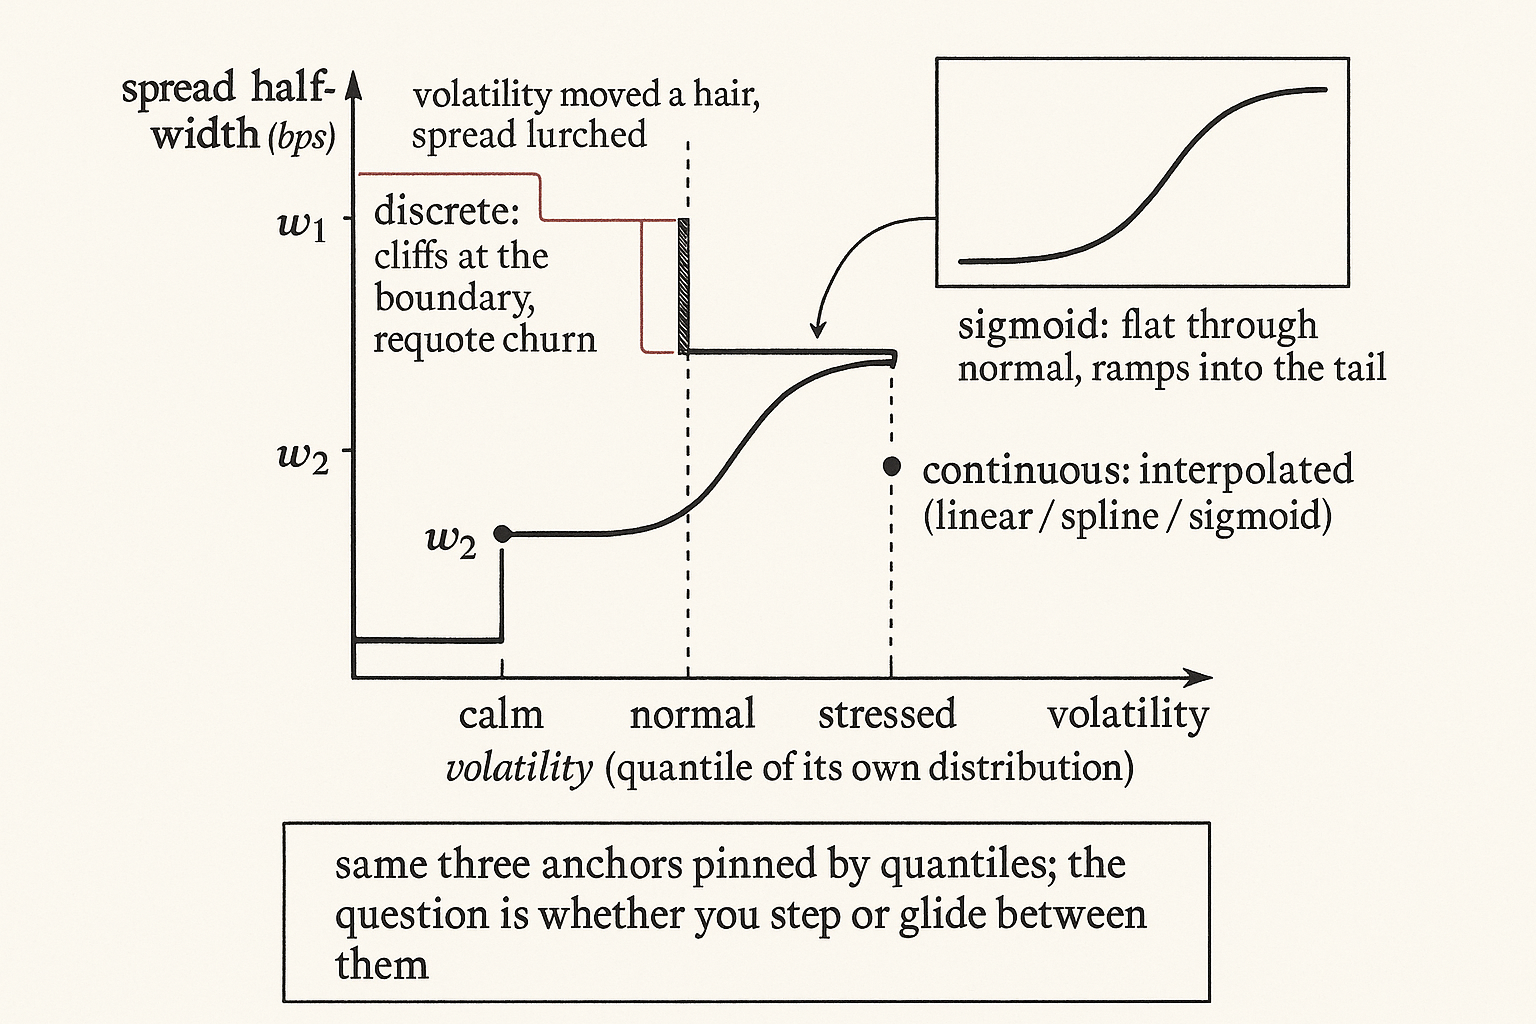
The flaw is the cliff at the boundary. The moment volatility ticks from the 66th to the 67th percentile, your spread jumps discontinuously from w2 to w3. Nothing real happened, volatility moved a hair, but your quote lurched, which churns your orders (every boundary crossing is a requote, eating rate limits) and makes your fill behavior jumpy right where the market is already getting jumpy. With three regimes you have two cliffs; with finer buckets you have more, each a little discontinuity the market can catch you on.
The continuous model: interpolate the widths
The fix is to treat the three regime widths as anchor points and draw a smooth curve through them, so the spread moves continuously with volatility instead of stepping. The simplest curve is linear interpolation between adjacent anchors.
$$ w = \frac{w_0 (x_1 - x) + w_1 (x - x_0)}{x_1 - x_0} $$
Read it as a weighted blend: x is your current volatility sitting between two anchor points x0 and x1 whose widths are w0 and w1, and the formula returns a width that is w0 when x sits on the lower anchor, w1 when it sits on the upper, and a proportional mix in between. Apply it on the calm-to-normal interval for low volatility and on the normal-to-stressed interval for high volatility, and the cliffs vanish. The spread now glides from w1 toward w3 as volatility climbs, with no discontinuity to churn your book.
Linear is the floor, not the ceiling. The resource notes you can run the same interpolation with a polynomial, a spline, or a sigmoid through the anchors. The shape encodes a view about how spread should respond: a sigmoid stays flat through normal volatility and then ramps hard into the tail, which matches the intuition that adverse selection is benign until volatility gets genuinely large and then bites nonlinearly. A spline gives you a smooth curve obeying all three anchors at once instead of two straight segments meeting at a kink. Pick the shape, then let the three quantile anchors pin it to the data.
A worked number
Run three tertile regimes on an alt perp with hand-set half-widths of 4, 8, and 16 basis points for calm, normal, and stressed, with the regime anchors at volatility readings of 10, 20, and 35 bps of fair-price standard deviation. Current volatility prints 27 bps, sitting between the normal anchor (20) and the stressed anchor (35). The discrete model still calls this "normal" until volatility crosses 35, so it quotes 8 bps, half the width the move deserves, and you eat adverse selection on the way up. The linear continuous model interpolates: w = (8·(35−27) + 16·(27−20)) / (35−20) = (64 + 112) / 15 ≈ 11.7 bps. The continuous version already widened you most of the way toward stressed because volatility is most of the way there, instead of waiting for a threshold to trip.
Which to use
Build the discrete model first, because it is the honest baseline and lets you sanity-check that wider volatility maps to wider spreads at all. Move to continuous interpolation once the boundary churn shows up in your requote counts or your markouts spike right at regime crossings. Choose the interpolation shape by what you believe about the tail: linear if you have no strong view, sigmoid if you think the danger is concentrated in extreme volatility, spline if you want a single smooth fit through all anchors.
Calibrate the widths the only way that means anything: markouts conditional on regime, the truth serum from the old article "Markouts: The Truth Serum of Market Making." Set each width so the markout in that regime is flat, not negative; if your stressed-regime markouts still trough, w3 is too tight regardless of how clever the interpolation is. The whole apparatus sits on top of the fair value from the old article "Why Fair Value Is the Core of Market Making," because spread is the second decision after the center, and a beautifully interpolated spread around a wrong center is still a losing quote.
Visualizing discrete vs continuous
KEY POINTS
- Spread must track volatility; the open question is the mapping from a volatility number to a width, and a crude mapping costs you fills or markouts at the regime boundary.
- Define regimes by quantiles of the volatility distribution, not fixed numeric thresholds, because volatility is non-stationary and a fixed threshold rots. Re-estimate the quantile cuts on a rolling window.
- Discrete model: three quantile regimes, three hand-set widths, a lookup. Trivial to build and the right first version, but it has a cliff at each boundary that churns your book and jumps your quote when volatility barely moved.
- Continuous model: treat the three widths as anchors and interpolate between them so the spread glides. Linear is the floor; polynomial, spline, or sigmoid encode a view about how spread should respond into the tail.
- Worked size: with widths 4/8/16 bps at volatility anchors 10/20/35, a 27 bps reading still gets the discrete "normal" 8 bps while linear interpolation already quotes about 11.7 bps, widening with the move instead of waiting for a threshold.
- Calibrate widths with markouts conditional on regime, set each so its markout is flat, and remember the spread sits on top of fair value, a clever spread around a wrong center still loses.
References
- High-Frequency Trading in a Limit Order Book (Avellaneda, Stoikov)
- Dealing with the Inventory Risk: A Solution to the Market Making Problem (Gueant, Lehalle, Fernandez-Tapia)
- Volatility Regimes and Optimal Spread Setting in Electronic Markets
- Quantile-Based Regime Classification for Trading Systems
- The Art of Currency Trading - Brent Donnelly (Amazon)
- Market Making under a Regime Switching Model
- High frequency market making: The role of speed
- Adverse Selection in Cryptocurrency Markets
- A continuous and efficient fundamental price on the discrete order book grid
- Limit Order Book Shape and Return Distribution
- What good is a volatility model?
- Regime-switching stochastic volatility: Evidence from the crude oil market
- A tale of two regimes: Theory and empirical evidence for a Markov-modulated jump diffusion model of equity returns and derivative pricing implications