2.72 The Volume-Weighted MA Ratio
The volume-weighted MA ratio asks where the crowd transacted, not which way it pushed: VWMA over SMA, above one when expensive bars carried the volume. Log it, scale by root-lookback, compress, and it's model-ready.
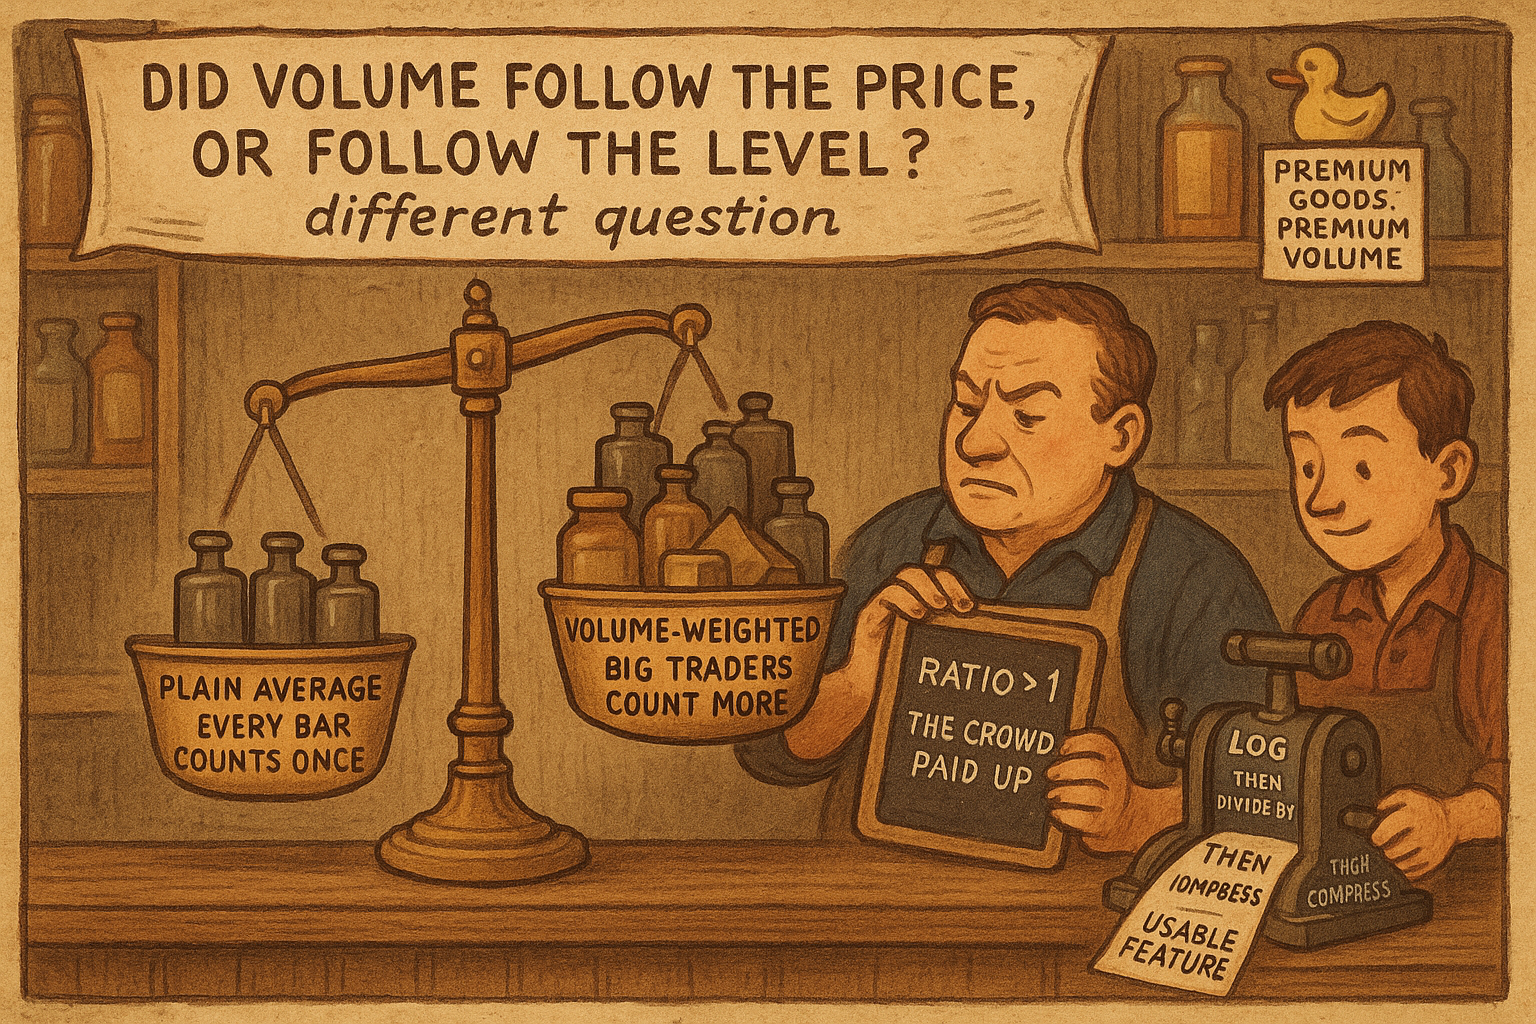
Intraday Intensity and On-Balance Volume both ask the same question, whether volume lined up with price changes. This indicator asks a different one: did volume line up with price levels. The distinction matters. Knowing that volume clustered on the up bars tells you about momentum; knowing that volume clustered on the high-priced bars tells you where the crowd was willing to transact, which is a statement about value, not direction. The tool is a ratio of two averages, a volume-weighted one against a plain one, and the ratio reads above one when the expensive bars carried the volume and below one when the cheap bars did. The raw ratio is badly behaved. This article builds it and then applies the three transforms that turn it into a feature you can model.
Two averages, one weighted by volume
A plain simple moving average treats every bar in the window as equally important. Sum the closes, divide by the count.
$$ \text{SMA} = \frac{1}{LB}\sum_{k=0}^{LB-1} C_k $$
A weighted average lets some bars count more than others. Multiply each close by a positive weight, sum those products, and divide by the sum of the weights; when the weights are all equal you get the plain average back. Use volume as the weight and you get the volume-weighted moving average, an average price where heavily traded bars pull the result toward their level.
$$ \text{VWMA} = \frac{\sum_{k=0}^{LB-1} V_k \cdot C_k}{\sum_{k=0}^{LB-1} V_k} $$
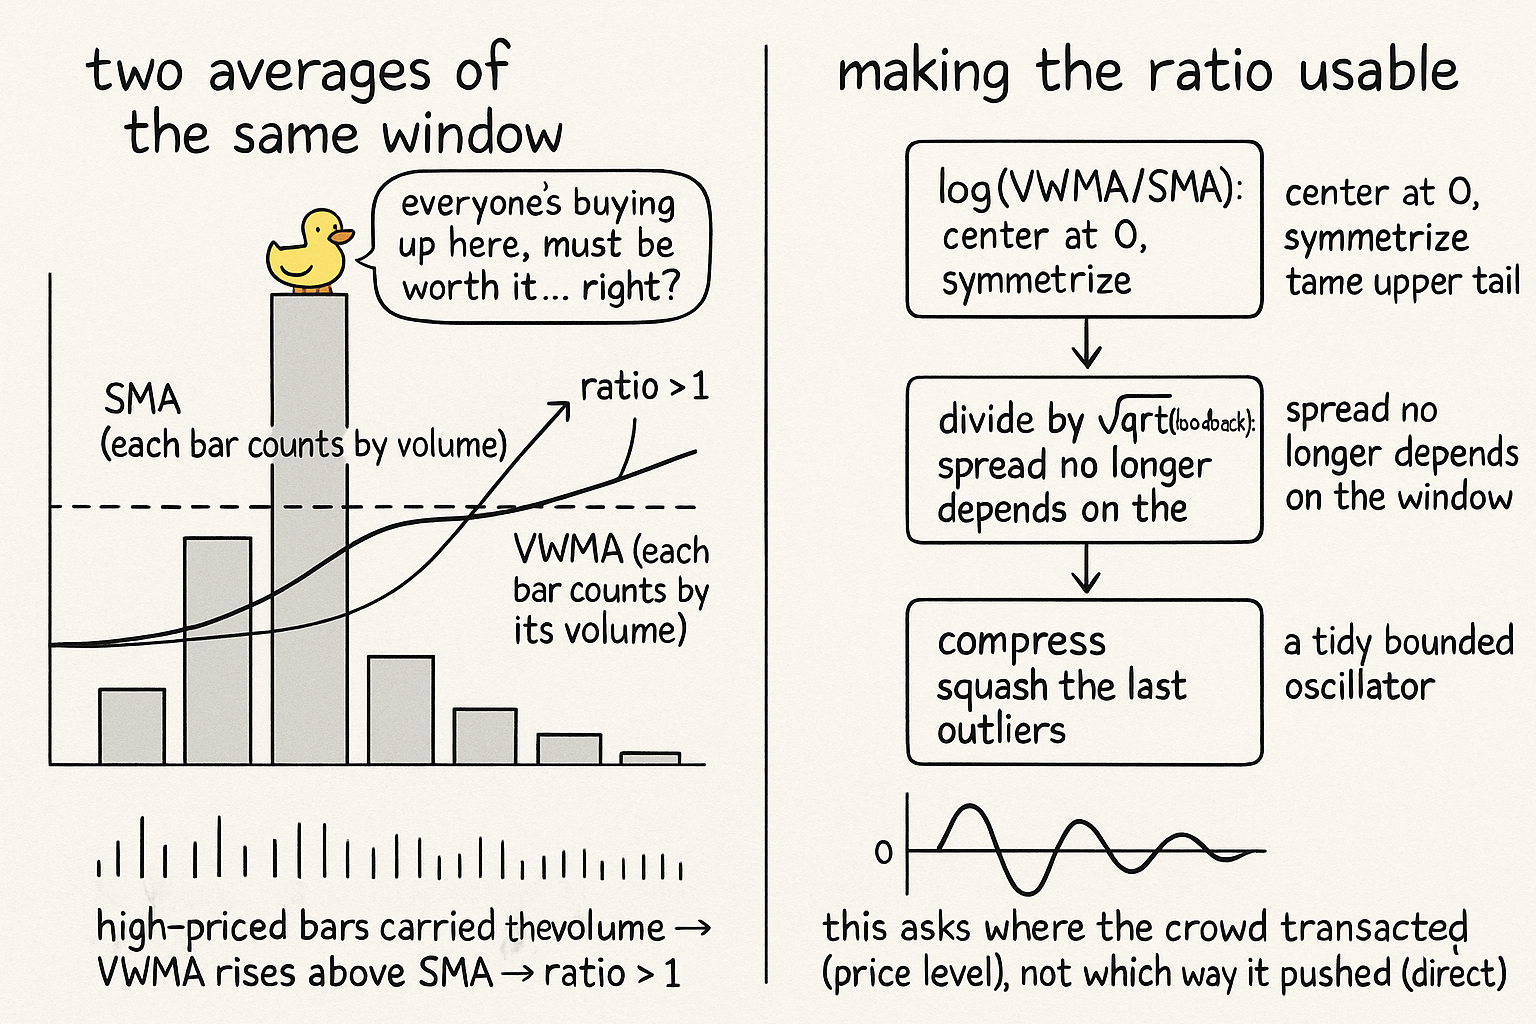
The VWMA answers "what was the average price, counting each bar by how much traded there." The SMA answers "what was the average price, counting each bar once." Their ratio is the whole indicator. Divide the volume-weighted average by the plain average and you measure how price and volume associated over the window.
$$ R = \frac{\text{VWMA}}{\text{SMA}} $$
When the higher-priced bars in the window also carried the higher volume, the VWMA gets dragged above the SMA and the ratio reads above one. When the heavy volume landed on the cheaper bars, the VWMA sinks below the SMA and the ratio reads below one. A ratio near one says volume and price level had no particular relationship. This is genuinely different information from a momentum-style volume indicator, and it pairs well with Intraday Intensity rather than duplicating it.
Three transforms to make the ratio usable
The raw ratio R is no good as a model input, for the usual reasons a ratio bunched around one is no good: it is centered on an awkward value, it is asymmetric because a ratio can run to large multiples on the upside but is floored near zero on the downside, and its spread depends on the lookback. The old article "Why Most Indicators Should Be Transformed Before Modeling" listed exactly these defects and the transforms that fix them. Apply three in sequence.
First, take the log of the ratio. A log recenters the awkward multiplicative center of one onto an additive center of zero, since the log of one is zero, and it symmetrizes the asymmetry, mapping a doubling and a halving to equal and opposite distances from zero. The log also pulls in the heavy upper tail that a raw ratio carries. Second, divide the log ratio by the square root of the lookback. The spread of the log ratio shrinks as the window grows, the same inverse relationship seen across these volume indicators, so the square-root-of-lookback divisor makes the standard deviation roughly independent of the window and lets a single downstream compression setting work across lookbacks. The old article "How to Build Stationary Indicators from Non-Stationary Prices" is the principle behind both moves: log to fix the mean and center, scale to fix the variance. Third, apply a nonlinear compression to tame whatever outliers survive. Putting the pieces together gives the volume-weighted ratio indicator.
$$ \text{VWR} = 100 \cdot \frac{1000 \cdot \log\!\left(\text{VWMA}/\text{SMA}\right)}{\sqrt{2 \cdot LB}} $$
The constants are cosmetic, not structural. The log of VWMA over SMA does the real work, centering and symmetrizing; the square root of twice the lookback in the denominator does the variance normalization; the thousand and the hundred are scale factors that lift a tiny log ratio into human-readable numbers. After this you would still pass the output through a bounded compression for the final outliers, the normal-CDF or sigmoid squash from the old article "Taming Indicator Tails with Sigmoid Transforms", but the heavy lifting is done by the log and the lookback scaling.
What it adds to a volume toolkit
The reason to carry this alongside money-flow indicators is that it answers a question they cannot. Intraday Intensity and Normalized OBV both tie volume to the direction of the move. The volume-weighted MA ratio ties volume to the price level, so it can flag situations the others miss: a market grinding sideways where the crowd is quietly transacting at the upper end of the range reads above one here while a money-flow indicator sees no clean directional bias to report. Read above one as the volume concentrating at higher prices, a sign the crowd accepted the elevated levels, and below one as volume concentrating at lower prices, a sign the heavy transacting happened on the discount bars. As with every indicator in this group, the clean construction makes the relationship testable and comparable across instruments; whether the relationship predicts anything is a question for the data, not the formula.
KEY POINTS
- The volume-weighted MA ratio measures whether volume lined up with price level, a different question from money-flow indicators that measure whether volume lined up with price direction.
- The VWMA is an average close weighted by each bar's volume, so heavily traded bars pull it toward their price; the SMA weights every bar once, and the ratio VWMA over SMA reads above one when the higher-priced bars carried the volume.
- The raw ratio is unusable: centered on the awkward value of one, asymmetric because ratios run large up and floored down, and lookback-dependent in spread, the defects catalogued in the old article "Why Most Indicators Should Be Transformed Before Modeling".
- Take the log to recenter on zero and symmetrize, divide by the square root of the lookback to make the spread window-independent, then compress, the two-step mean-then-variance fix from the old article "How to Build Stationary Indicators from Non-Stationary Prices".
- The constants in the final formula are cosmetic scaling; the log and the square-root-of-lookback divisor do the real normalization, and a final bounded squash from the old article "Taming Indicator Tails with Sigmoid Transforms" handles residual outliers.
- It complements rather than duplicates Intraday Intensity and Normalized OBV, flagging crowds transacting at the high or low end of a range even when there is no clean directional flow to report.