4.36 The Three Engines of Seasonality: Fixed-Date, Floating-Date, and Behavioral
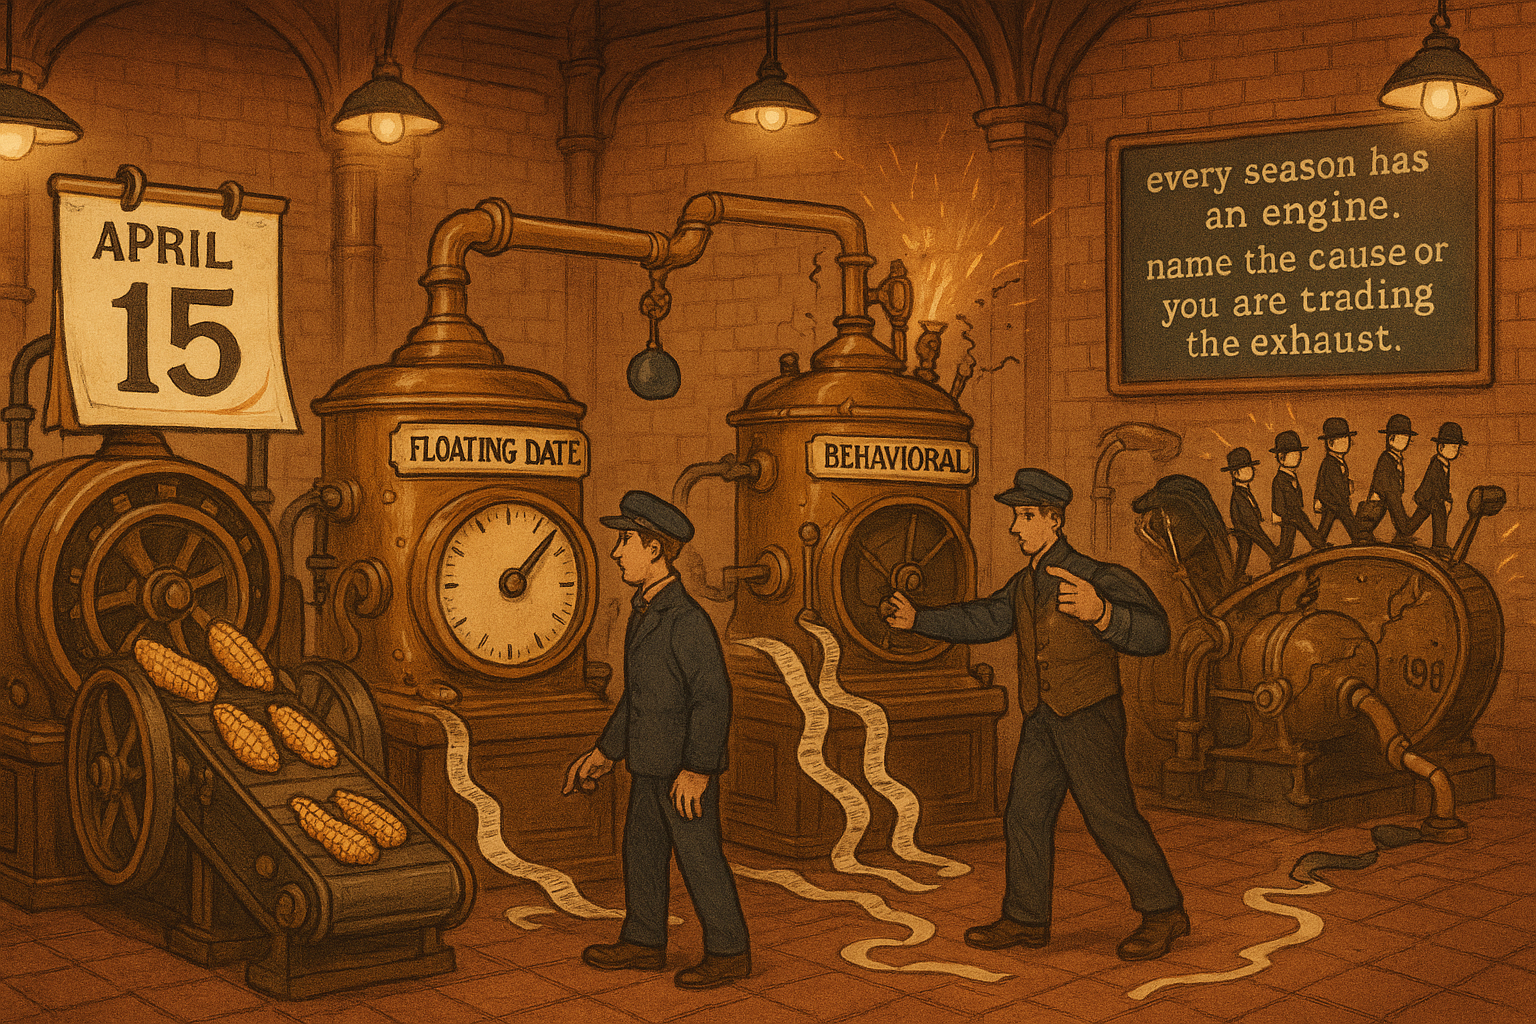
Seasonals come from three different machines: fixed dates, floating events, and human habit. Name which engine you are trading and you know how it will break.
A corn farmer in Iowa does not care about your moving average. He cares about whether it rains in the second week of July, because that is when the crop pollinates, and a dry spell then decides the size of the harvest. Every year the futures market prices that anxiety into the same six-week window, and every year, once the weather risk passes, the premium bleeds out. That bleed is a seasonal. It shows up at roughly the same calendar spot, it runs in the same direction, and it traces back to a physical cause you can name. Strip the cause away and you have a curve-fit. Keep the cause and you have something worth testing.
Seasonality is the study of a market's behavior as a function of the calendar instead of as a function of price. You are no longer asking "what has price done lately." You are asking "what does this market tend to do during this stretch of the year, across many years, and is there a reason." That second clause is the whole game. The article "Why the Market Does Not Repeat, But Still Rhymes" set up the general principle that history rhymes through recurring structure rather than identical paths; seasonality is the cleanest rhyme there is, because the calendar itself is the recurring structure.
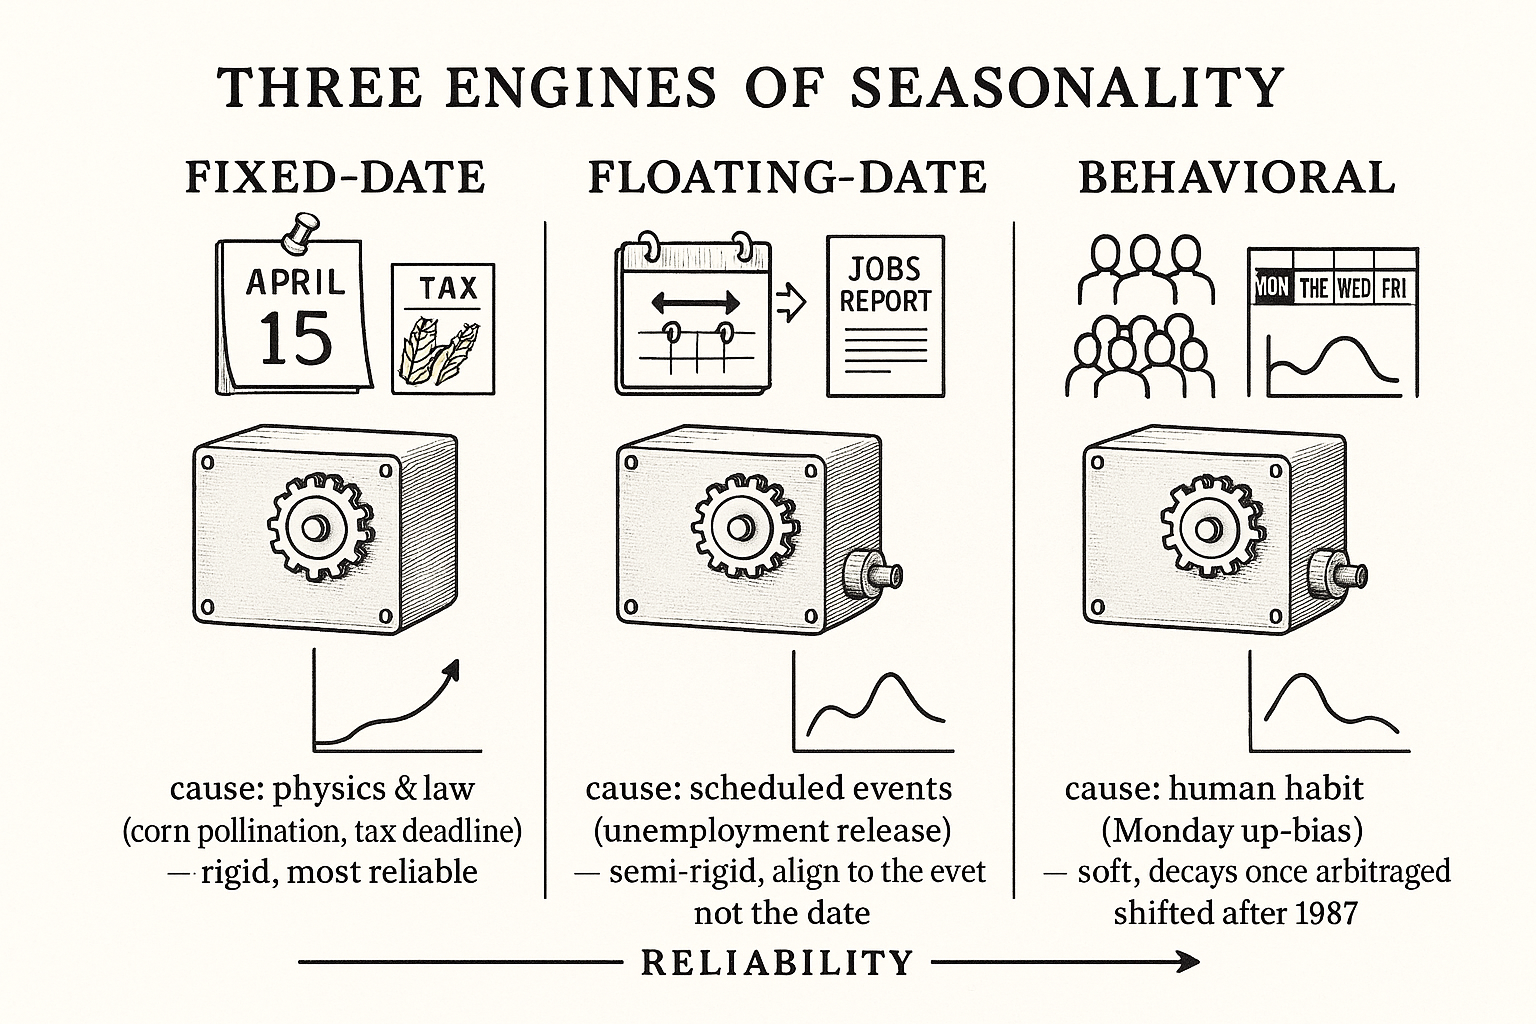
There are three distinct machines that produce a seasonal pattern, and they are not interchangeable. Confusing them is how traders end up trading noise. A fixed-date seasonal, a floating-date seasonal, and a behavioral seasonal each have a different cause, a different reliability profile, and a different way of breaking. Treat them separately or you will average them into mush.
Engine one: the fixed-date seasonal
The first engine fires on events nailed to a specific calendar date, year after year. The pollination of corn in late June and early July. The filing deadline for US federal taxes on April 15th. Heating-oil demand that builds ahead of winter. These are the easiest seasonals to trust, because the event does not wander. The earth tilts the same way every year, and the tax code does not move April 15th to suit your backtest.
The corn case is the textbook one. The plant is most vulnerable to heat and drought during pollination, a tight window in the back half of June into early July. Traders bid in a weather premium ahead of that window because a bad pollination can wreck yield. Once the danger passes without disaster, which is most years, the premium unwinds and corn tends to fall into harvest. The pattern is not "corn goes up in summer." The pattern is "corn carries a fear premium into pollination and sheds it after, because the physical risk that justified the premium is gone." Name the cause and the trade has a spine.
Tax season is the same shape with a different driver. The April 15th deadline forces a known, dated cash-flow event across the entire economy, and the flows around it leave fingerprints in equity and short-rate markets. The date is legislated, so the seasonal does not drift unless Congress moves the deadline, which it occasionally does, and when it does, the seasonal moves with it. That is the tell of a real fixed-date pattern: change the date of the cause and the pattern follows.
Engine two: the floating-date seasonal
The second engine fires on events that recur but whose date moves. The clearest example is a scheduled economic release. The monthly US unemployment report does not land on the same calendar date each month, but it lands on a knowable schedule, and the market's behavior around it is patterned. The Thursday before the unemployment number is released has historically carried a downward bias, as positioning gets defensive ahead of a high-variance event.
Floating-date seasonals are anchored to an event, not a date, so you cannot find them by averaging the 15th of every month. You have to align your data to the event first, then measure the behavior in the days around it. Line up every unemployment release, look at the bar before, the bar of, and the bar after, and the pattern emerges. Average by raw calendar date and you smear it into nothing, because the event sat on the 3rd one month and the 7th the next.
This is the engine most traders get wrong, because the analysis is harder. You are not slicing by date. You are slicing by "days relative to the event," which means you need the event calendar, you need to handle months where the schedule shifted, and you need enough releases in your sample to say anything. The reward for the extra work is a cleaner signal, because event-driven flows are more concentrated than diffuse calendar drift.
Engine three: the behavioral seasonal
The third engine has no physical or scheduled cause. It runs on human habit. The most cited case is the Monday bias in stocks: equities have shown an upward tendency on Mondays, attributed to traders who flatten positions before the weekend and re-enter at the start of the week. There is no harvest, no release, no deadline. The pattern exists because a large number of people behave the same way at the same point in the week, and that collective habit moves price.
Behavioral seasonals are the most fragile of the three, because habits change and because they get arbitraged once they are well known. The Monday effect is the cautionary tale. It was real enough to publish on, then it shifted after the October 1987 crash, when "Black Monday" rewired how people thought about Monday risk. A pattern that was a mild upward bias became something traders watched and second-guessed, and watched patterns decay. The cause here is psychology, and psychology is the least stable input you can build on.
That instability is the point, not a footnote. A behavioral seasonal can be tradable for a stretch and then quietly invert, and you will not get a weather report telling you it changed. This is the difference the article "The Difference Between Explanation and Prediction in Markets" drew: you can explain the Monday effect with a tidy story about weekend positioning, and that explanation can be true, and the pattern can still stop predicting. Explanation is not a guarantee of forward edge.
Why the engine matters more than the pattern
Sort any seasonal you find by its engine before you trade it, because the engine tells you how it will fail.
$$ \text{Reliability ranking (typical):}\quad \text{fixed-date} \;>\; \text{floating-date} \;>\; \text{behavioral} $$ $$ \text{because cause stability:}\quad \underbrace{\text{physics, law}}_{\text{rigid}} \;>\; \underbrace{\text{schedule}}_{\text{semi-rigid}} \;>\; \underbrace{\text{habit}}_{\text{soft, arbitraged}} $$
Read that as a rough ordering, not a hard rule. A fixed-date seasonal rests on something rigid, like the tilt of the earth or a line in the tax code, so it tends to persist and to break only when the physical or legal cause changes. A floating-date seasonal rests on a schedule, which is stable until the schedule or the market's reaction to the event changes. A behavioral seasonal rests on a habit, which is the softest input and the first to get competed away once a crowd notices it. None of this tells you the pattern is real; the next article in this arc, "Is Your Seasonal Real or Curve-Fit? A Reliability Checklist", handles the testing. The engine tells you what kind of failure to watch for and how much trust the pattern has earned before you even run the test.
Two practical consequences. First, when a seasonal stops working, ask whether its engine changed. Corn pollination seasonality weakening would point you at drought-resistant seed or shifted planting, a change in the physical cause. A behavioral seasonal weakening usually means the crowd found it. Second, the engine decides your analysis method. Fixed-date patterns you find by calendar slicing. Floating-date patterns you find by aligning to the event. Behavioral patterns you find by day-of-week or day-of-month slicing, and you treat every result with suspicion, because that bin is where pure data-mining noise hides best.
This article defines the object and its three sources. The rest of the seasonal arc builds on it: how to compute a seasonal so the number means something, how to test whether it is real, which day-of-week effects survive scrutiny, and how to use a seasonal as a filter rather than a standalone system. The engine you are dealing with sets the priors for all of it.
Visualizing the three engines
KEY POINTS
- Seasonality studies a market as a function of the calendar instead of price: what this market tends to do during this stretch of the year, across many years, and whether there is a nameable cause.
- A real seasonal needs a cause. Strip the cause away and you are trading a curve-fit; keep it and the pattern has a spine that tells you when it should hold and when it should break.
- Engine one, fixed-date: events nailed to a date (corn pollination late June to early July, the April 15 tax deadline). Most reliable, because the cause is physics or law and does not wander. The tell: move the date of the cause and the pattern moves with it.
- Engine two, floating-date: recurring events whose date moves (the unemployment release; a downward bias the Thursday before). Found by aligning data to the event, not by slicing raw calendar dates.
- Engine three, behavioral: pure habit with no physical or scheduled cause (the Monday up-bias from weekend positioning). The most fragile, because habits change and get arbitraged once known; the Monday effect shifted after the 1987 crash.
- Sort every seasonal by engine before trading it. The engine sets your prior on reliability and tells you the failure mode to watch: physical/legal change, schedule change, or crowd arbitrage.
- The engine also dictates the analysis method: calendar slicing for fixed-date, event alignment for floating-date, day-of-week or day-of-month slicing for behavioral, with the most suspicion reserved for behavioral.
References
- Trading Systems and Methods - Perry Kaufman (Amazon)
- Cybernetic Trading Strategies - Murray Ruggiero (Amazon)
- The Art of Currency Trading - Brent Donnelly (Amazon)
- Seasonality in Agricultural Commodity Futures
- Return seasonality in commodity futures
- Risky times: Seasonality and event risk of commodities
- Seasonality and the valuation of commodity options
- Closed-form analytical solutions for options on agricultural futures with seasonality and stochastic convenience yield
- The weather premium in the U.S. corn market
- Calendar anomalies in commodity markets for natural resources
- Quantifying Inter-Annual Seasonal Drift in Tomato Prices Using