1.6 Why the Market Does Not Repeat, But Still Rhymes
Markets do not repeat in exact shapes, regimes, or participants. What survives are deeper statistical properties: momentum, mean reversion, volatility clustering, fat tails, and lead-lag behavior. The edge is in measuring the rhyme, not memorizing the pattern.
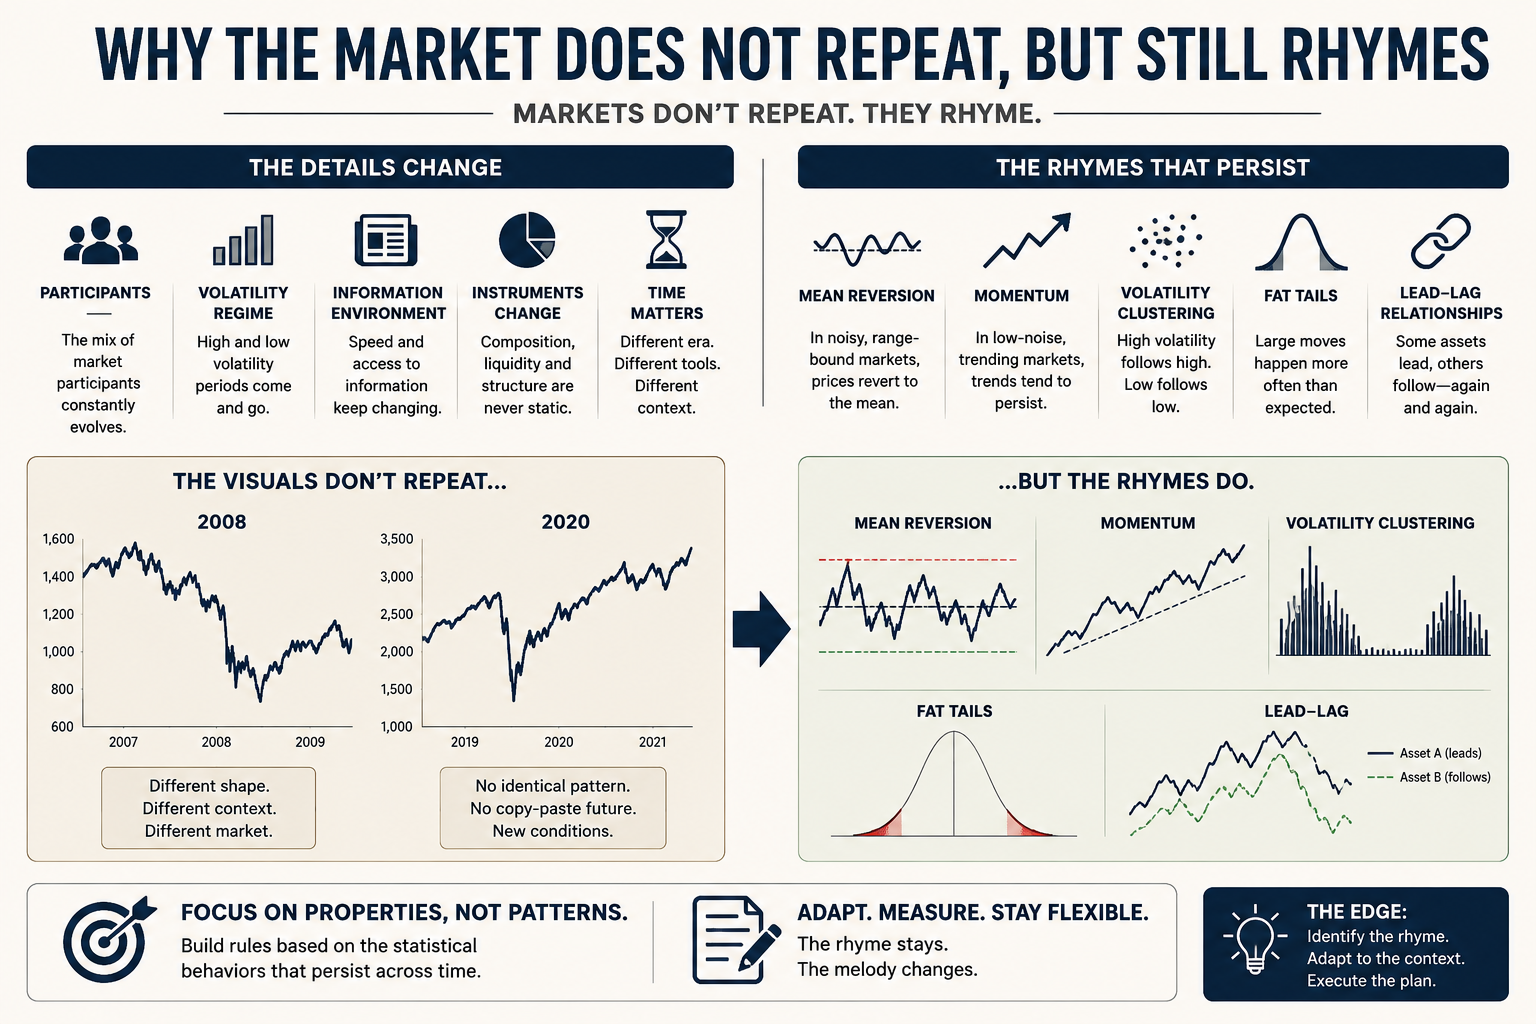
Pattern matching is the wrong mental model for trading. Markets do not repeat. They do not produce identical chart patterns with identical outcomes. Anyone who looks at a chart and says "this looks like 2008" is doing visual pattern recognition on a price series with 30 years of structural change baked into it, and the recognition is paying attention to the noise.
Markets rhyme. The rhyme is statistical: some measurable properties of markets recur across regimes, decades, and instruments. The visible shapes do not. The job is to find the properties that rhyme and write rules against those, not against the shapes the market drew last time.
The variables that change
The specifics never repeat. The reasons are concrete.
The participant mix changes. The S&P 500 in 1990 was traded by humans on telephones with two-day settlement. The S&P 500 in 2025 is traded by latency-arbitrage market makers running co-located algorithms with sub-millisecond reaction times. The price series share a ticker. They do not share a market.
The volatility regime changes. Annualized realized volatility on US equities has ranged from 8% in 2017 to 65% in March 2020. A breakout system calibrated for an 8% vol environment misfires in a 65% vol environment, and a system calibrated for 65% vol does not see the signals in 8% vol. The same chart pattern means different things at different volatility levels.
The information environment changes. News diffusion that took hours in 1995 takes milliseconds in 2025. Reactions to earnings, macro releases, and central bank statements happen on different timescales, with different participants on the other side. The visible pattern is the residual after the information was priced in. The information speed sets the pattern speed.
The instrument itself changes. Index composition rotates. The S&P 500 of 2010 was 16% financials and 19% tech. By 2025 it is 28% tech and 12% financials. The same index name covers a different basket. The same price chart describes a different beast.
These four variables together produce most of what visual pattern matchers mistake for signal.
The properties that recur
A smaller set of properties keeps showing up.
Mean reversion in high-noise environments. When prices move erratically around a level with no clear trend, the next move tends to reverse the last move. The strength of the effect varies by instrument and regime; the existence of the effect persists.
Momentum persistence in low-noise environments. When prices move directionally with little erratic motion around the trend, the next move tends to continue. The persistence horizon varies; the persistence itself persists.
Volatility clustering. High-volatility days are followed by high-volatility days. Low-volatility days are followed by low-volatility days. The half-life of the cluster varies; the clustering itself shows up in every liquid market that has been studied.
Fat tails. Returns are not normally distributed. The frequency of 4+ sigma events is around 10x what a Gaussian distribution predicts. This was true in 1980, true in 2000, and true in 2025. The size of the tail varies; the tail itself persists.
Lead-lag relationships across correlated assets. When one of two cointegrated instruments moves first, the other tends to follow within a measurable window. The instruments rotate; the lead-lag itself shows up across decades.
Note what these have in common. They are statistical properties, not visual ones. Each one can be measured with a number, computed across any window of data, and compared across regimes. Rules written against these properties survive longer than rules written against shapes that look familiar on a chart.
The efficiency ratio as a worked rhyme
A practical example. The efficiency ratio measures how directional a price move is, on a scale from 0 to 1.
What this is doing in plain words: the numerator is the net distance the price covered from the start of the window to the end. The denominator is the total path length, the sum of every up-and-down move the price made along the way.
If the price walked in a straight line from start to end, the net distance equals the path length and ER equals 1. If the price zig-zagged around without going anywhere, the net distance is near zero and the path length is large, so ER approaches 0.
Why this is the right thing to measure. Two markets can have the same volatility, the same range, the same visible "moves," and different efficiency ratios. The trend-following system that thrives in the first market dies in the second. The mean-reversion system does the reverse. The ER tells you which strategy family the current regime belongs to, regardless of what the chart looks like to your eye.
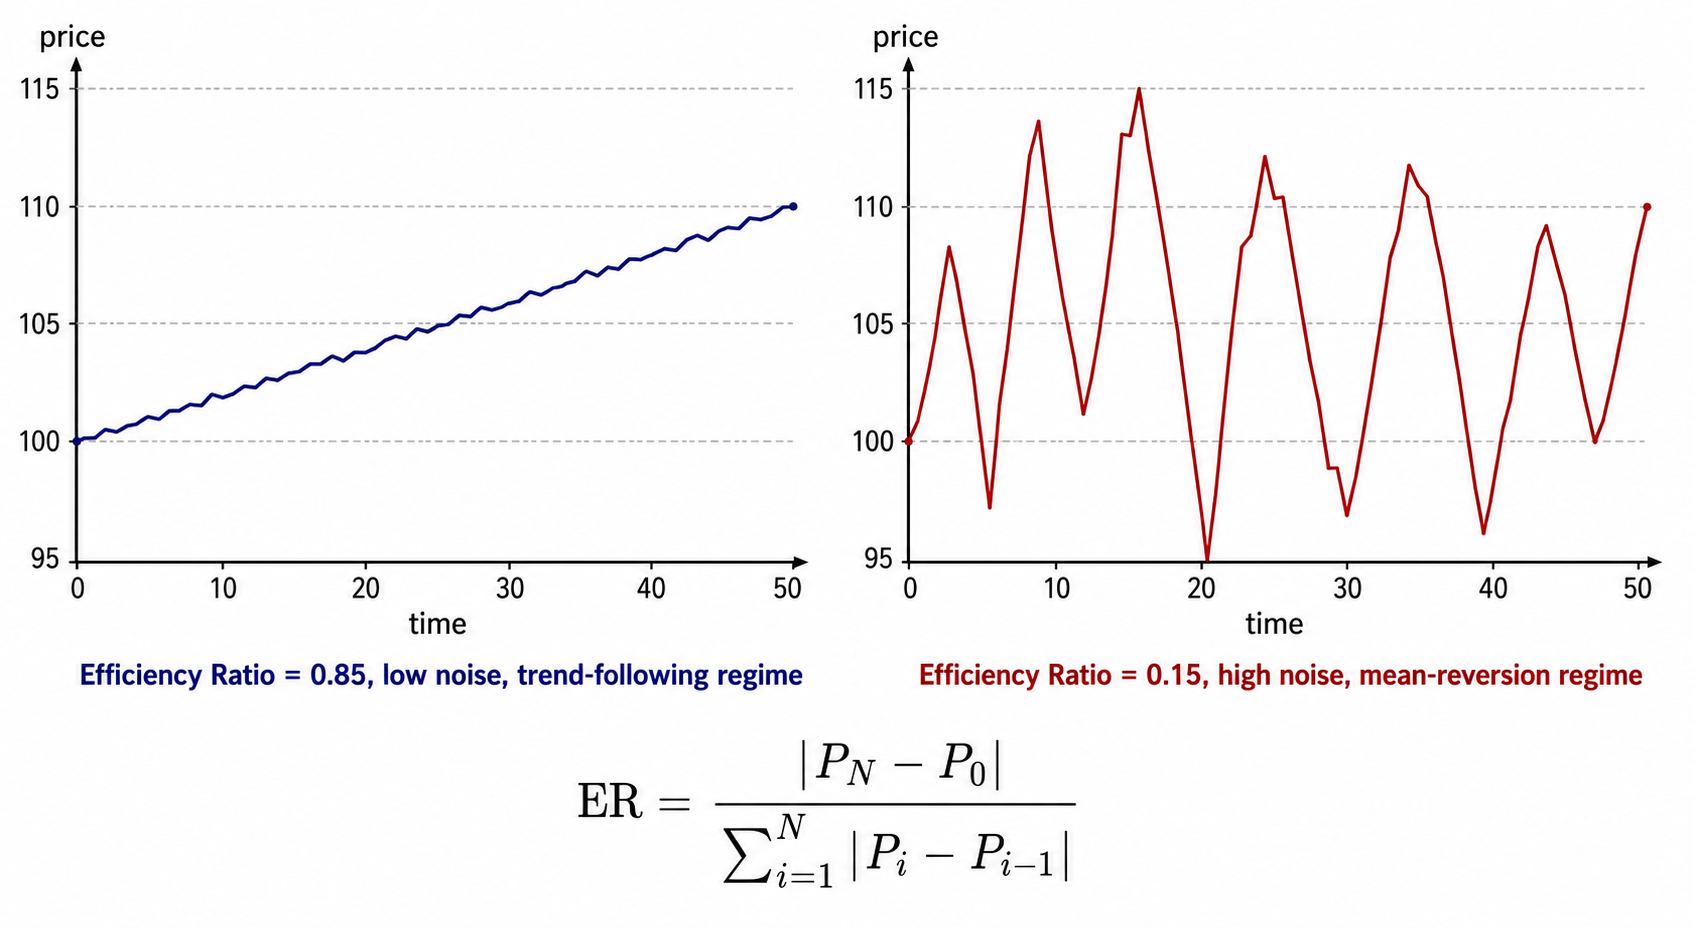
The two charts in the visual have the same net return and the same endpoint. They have very different efficiency ratios. A trader pattern-matching on the endpoint sees identical markets. A trader measuring the ratio sees two markets that need opposite strategies.
The ER rhymes across markets and across decades. Energy futures have higher ER than FX spot. FX spot has higher ER than equity index futures intraday. The relative ordering has held since the 1990s. The absolute level shifts with regime; the ordering survives. That is what rhyming looks like in practice. The measurable property is stable enough to write a rule against. The shape of the line is not.
The trap of visual pattern matching
A specific chart pattern, like a "double bottom" or a "bull flag," is a low-information feature defined over a small number of bars. The number of degrees of freedom involved in finding a pattern that matches a label is high enough that any sufficiently long random walk produces dozens of pattern-matching candidates. The historical "success rate" of these patterns is reported on hand-selected examples after the fact.
A statistical property, like the efficiency ratio, is a single number computed from the entire price window with no degrees of freedom. It cannot be cherry-picked. It cannot be retro-fit. Either the window has an ER of 0.7 or it does not.
This is the difference between a pattern that rhymes and a pattern that looks similar. A statistical property can be:
- Computed on any window.
- Compared across regimes.
- Used as input to a rule without selection bias.
A visual chart pattern can be:
- Found in any random walk if you look hard enough.
- Compared only by hand, with selection bias built into the comparison.
- Used as input to a rule only after retrofitting the rule to known-successful instances.
The first survives the move from specific to general. The second does not.
Move from specific to general
The implication for system design is to push every rule one level up the abstraction ladder. Instead of "long when price breaks the 20-day high," ask what the rule is trying to capture. Answer: low-noise directional movement. Then build the rule on the property, not the shape: long when the efficiency ratio over the last N bars exceeds a threshold and the recent move is positive.
The general rule loses the visual punch. The breakout chart on social media looks more exciting than the ER threshold scan. The general rule also survives regime changes that kill the specific one. The 20-day high is a specific level that means different things in different volatility regimes. The ER threshold is a relative measure that adapts.
A rule written on a statistical property can rhyme across regimes. A rule written on a specific level can only repeat. The market does not repeat.
KEY POINTS
- Markets do not repeat. The participant mix, volatility regime, information environment, and instrument composition all change between any two periods that look visually similar.
- Markets rhyme statistically. Mean reversion in high-noise regimes, momentum in low-noise regimes, volatility clustering, fat tails, and lead-lag relationships all recur across decades and instruments.
- The properties that rhyme are measurable numbers. The properties that do not are visual shapes.
- The efficiency ratio is a worked example: ER = |net distance| / total path length, on a scale from 0 to 1. Same return and same range can produce ER of 0.85 or 0.15, which require opposite strategies.
- Visual chart patterns have high degrees of freedom. Any random walk produces them. Reported success rates are after-the-fact selections.
- Statistical properties have zero degrees of freedom on a given window. They cannot be retrofitted.
- Push every rule one level up the abstraction ladder. Replace "long on a 20-day breakout" with "long when the efficiency ratio exceeds a threshold and the move is positive."
- A rule written on a statistical property survives regime changes. A rule written on a specific level survives only as long as the regime that produced the level does.
References
- Evidence-Based Technical Analysis - David Aronson (Amazon)
- Systematic Trading - Robert Carver (Amazon)
- Systematic Testing of Systematic Trading Strategies
- Avoiding Backtesting Overfitting by Covariance-Penalties in the Presence of Multiple Trading Rules
- Systematic Funds Outperform Discretionary Funds
- The Power of Price Action Reading
- Five Financial Eras: How Financial Markets Transformed the World
- Risk-Managed Momentum Strategies
- Trended Momentum
- A Rigorous Walk-Forward Validation Framework for Market Evaluation and Algorithmic Trading