4.38 Is Your Seasonal Real or Curve-Fit? A Reliability Checklist
Most seasonals are curve-fits with good marketing. Four tests separate a real calendar edge from a coincidence: beat the drift, survive dropping the best year, beat the coin, and name the cause.
The standard objection to seasonal trading is the correct one: most of it is curve-fitting dressed up as a pattern. Slice any market by enough calendar windows and you will find a stretch that was up 80% of the time over your sample. It means nothing. With 250 trading days and the freedom to pick start and end dates, you can manufacture a gorgeous seasonal out of pure noise, the same data-snooping trap the article "How to Test Indicator Thresholds Without Fooling Yourself" laid out for indicator thresholds. The calendar just gives you more knobs to overfit with.
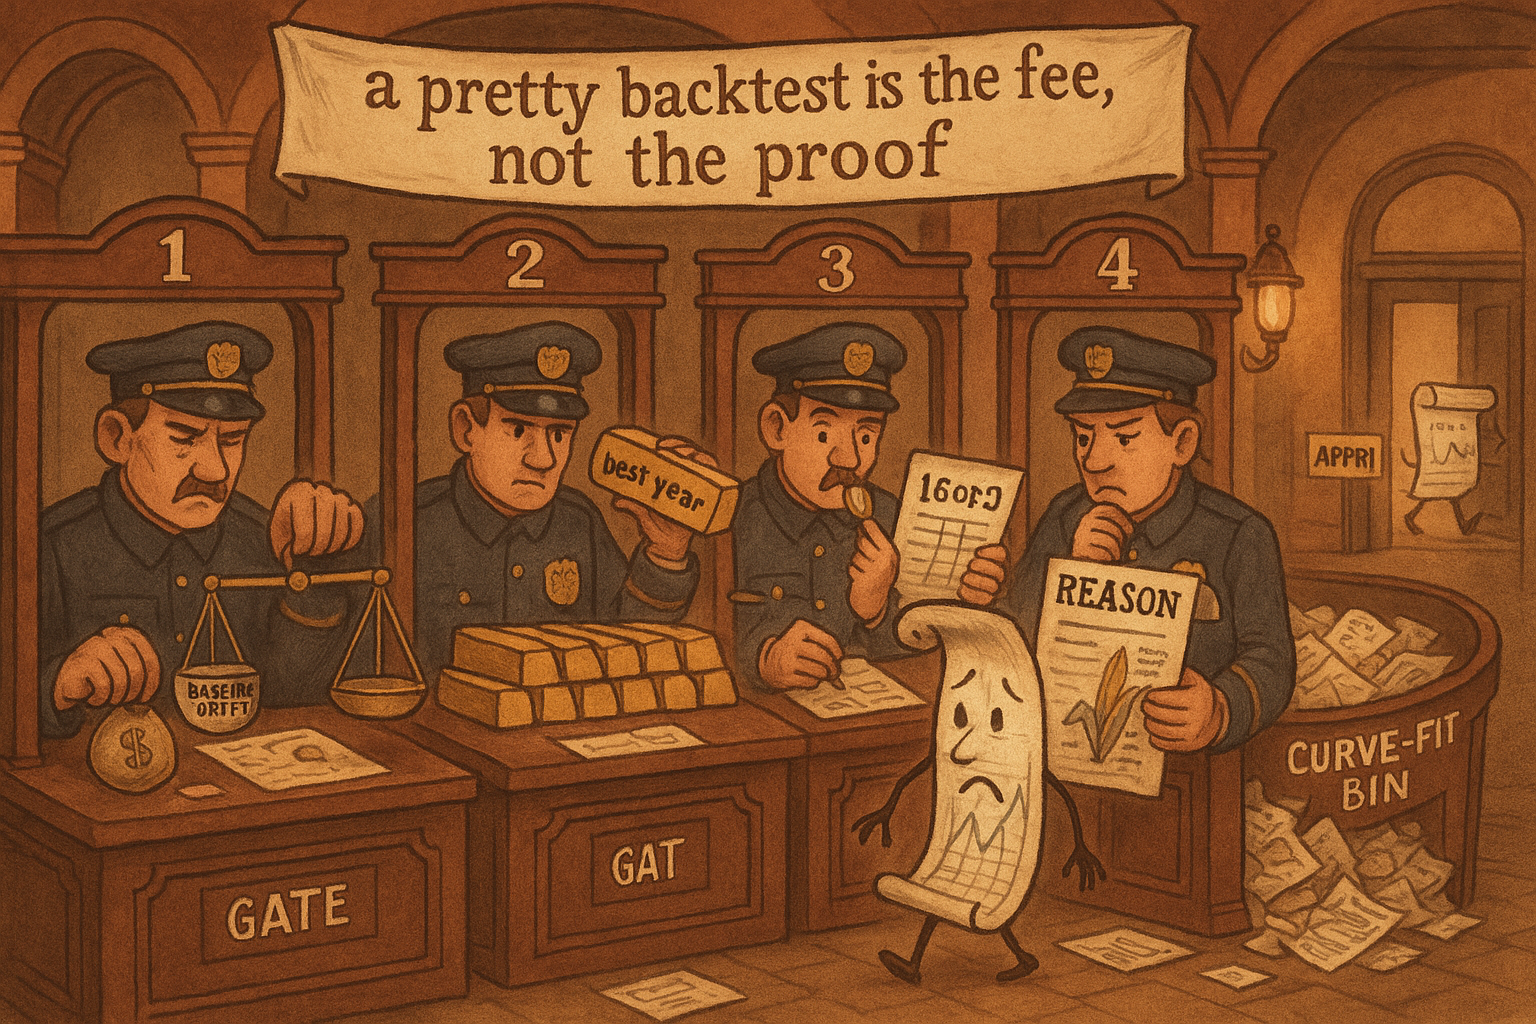
So the burden is on the seasonal to prove it is real. A pretty backtest is the entry fee, not the proof. Most computed seasonals will not survive the future, and the job of this checklist is to throw out the ones that were never going to. Four tests, and a seasonal has to clear all four. Fail one and you do not have a seasonal, you have a coincidence with good marketing.
Test one: beat the same-period bias
A seasonal return is only interesting if it beats what the market was doing anyway during that window. If stocks drift up over the whole sample, then "long stocks in November" looks profitable, but so does long stocks in any month. The seasonal has to outperform the baseline drift over the same calendar period, not just be positive.
$$ \text{Edge}_{\text{seasonal}} \;=\; R_{\text{seasonal}} \;-\; R_{\text{baseline,\,same period}} $$
The seasonal return minus the average return of the market over the same span. If you trade long during a 10-day window, compare it to the average 10-day return of just holding the market, not to zero. A seasonal that makes 2% while the market averaged 1.8% over that window is barely a seasonal; you captured the drift, not a pattern. The bias-relative return is what has to be positive and meaningful, and it is the number most seasonal pitches quietly skip, because the raw return looks better than the edge.
This is the seasonal version of a benchmark. The honest question is never "did this make money," it is "did this make money beyond the dumbest thing I could have done over the same dates."
Test two: no single trade carries the profit
A seasonal that worked 19 years out of 20 is a pattern. A seasonal that lost or broke even 19 years and got rescued by one monster year is an accident wearing a costume. Pull up the year-by-year contribution and check whether the total profit survives removing the single best trade.
$$ \text{Concentration} \;=\; \frac{\max_{y}\, \pi_{y}}{\sum_{y} \pi_{y}}\,,\qquad \text{drop the top year:}\;\; \sum_{y \neq y^{*}} \pi_{y} \;\overset{?}{>}\; 0 $$
The first piece is the share of total profit from the single best year; the second checks whether the seasonal is still profitable after you delete that year. If one year out of twenty supplies half the profit, the concentration is 0.5 and the pattern is fragile. If removing the best year flips the seasonal to a loss, you do not have a seasonal, you have one good trade and nineteen years of filler. This is the same fragility test you would run on any system: a strategy whose edge lives in one or two observations is indistinguishable from luck, the concern the article "Permutation Tests for Indicator Significance" formalized for indicators.
Test three: a significant share of years follows the bias
Direction matters more than dollars here. If the seasonal says "up in this window," you want a statistically significant majority of years to actually go up in that window, not just a high average dragged around by magnitude. Count the hit rate and ask whether it could have come from a fair coin.
$$ \text{under } H_0\,(p=0.5):\quad P(\text{at least }k\text{ up in }Y\text{ years}) \;=\; \sum_{i=k}^{Y} \binom{Y}{i} (0.5)^{Y} $$ $$ \text{example: } Y=20,\; k=16 \;\Rightarrow\; P \approx 0.006 $$
The null hypothesis is a coin: with no real bias, each year is up or down with probability one half. The formula gives the chance of seeing at least k up-years out of Y purely by luck. With 20 years, getting 16 or more up in the window has about a 0.6% chance under the coin, so 16/20 in the right direction is hard to dismiss as noise. Getting 12/20 has a probability around 25%, which a coin produces all the time, so 12/20 proves nothing no matter how good the average return looks. Pair this with the magnitude test from before: you want both a directional hit rate that beats the coin and profit that does not hinge on one year. Either alone is gameable. This is the falsifiability discipline from "How to Make Technical Analysis Falsifiable" applied to the calendar: state the coin-flip null out loud and make the seasonal reject it.
One warning that the test cannot enforce for you. The more calendar windows you searched to find this seasonal, the more your p-value lies. A 0.6% result is only a 0.6% result if you tested one window. Test 100 windows and you expect several to clear that bar by chance alone. Count the windows you tried, not just the one you kept.
Test four: it has to make sense
The last test is not statistical, and it is the one that matters most for the future. The seasonal must have a fundamental cause you can name before you trust it forward. Corn falls after the danger of crop damage from drought has passed, because the weather premium that justified the higher price is no longer needed. That is a reason. "Soybeans are up the second week of March" with no mechanism is not a reason, it is a number.
The cause is what makes the pattern likely to persist. A seasonal with a real driver behind it, a harvest cycle, a tax deadline, a scheduled release, will tend to keep working until that driver changes, and when it stops you will often be able to see why. A seasonal with no cause has nothing holding it in place, so it can evaporate the year after you find it and you will never know whether it was ever real. This connects to the engine framing in "The Three Engines of Seasonality: Fixed-Date, Floating-Date, and Behavioral": the engine is the cause, and a seasonal with no identifiable engine fails test four by definition.
The order matters. Ideally you form the fundamental hypothesis first, then test it, the way you would design any honest experiment. Finding the pattern by data-mining and then inventing a story to fit it is the cardinal sin, because human beings can rationalize any number after the fact. A plausible story attached to a mined pattern is more dangerous than no story, because it manufactures false confidence.
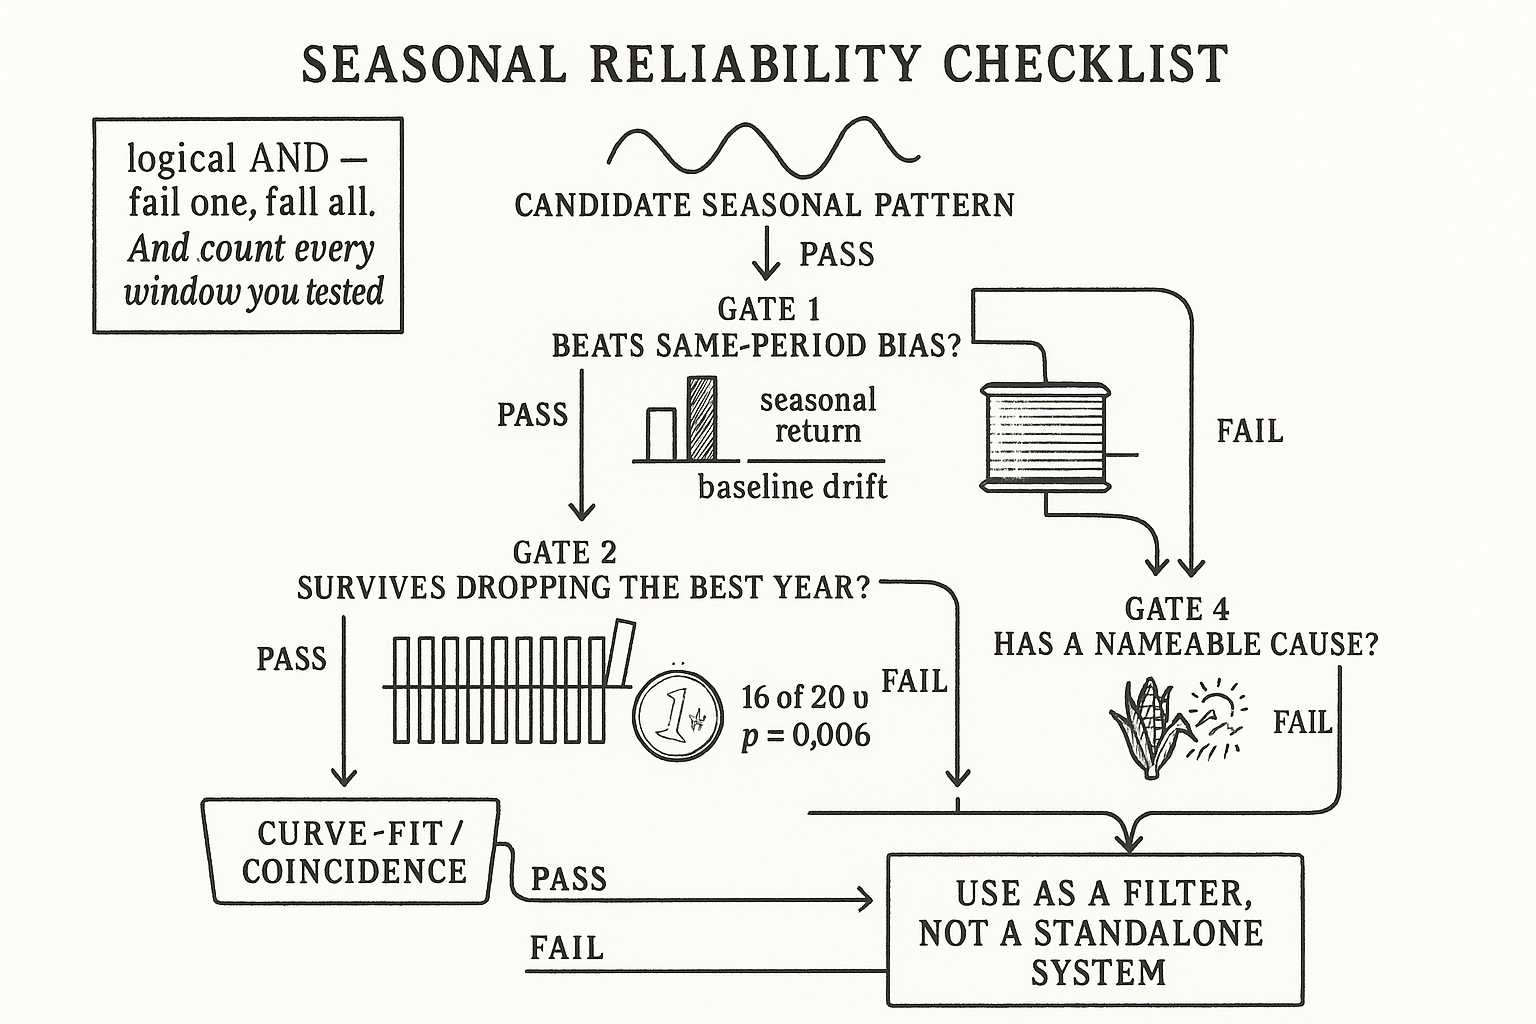
Running the checklist
All four, in order, before a seasonal earns a place in a system.
$$ \text{Trust} \;=\; \big(\text{edge} > 0\big)\;\wedge\; \big(\text{survives dropping best year}\big)\;\wedge\; \big(\text{hit rate beats coin}\big)\;\wedge\; \big(\text{nameable cause}\big) $$
It is a logical AND, not a weighted score. A seasonal does not get to be strong on three and weak on one. A pattern with a great hit rate, great edge, and no cause is a curve-fit you have not caught yet. A pattern with a perfect story but a coin-flip hit rate is a story, not a trade. The whole point of the checklist is that each test catches a different way to fool yourself, and skipping any one leaves that door open.
What survives the checklist is rarely a standalone system, and that is fine. A seasonal that clears all four is usually a modest bias, not a money machine, and the right use for a modest, well-founded bias is as a filter or a tilt on top of other signals. The article "Seasonality as a Filter, Not a Standalone System" takes the seasonals that pass this gate and puts them to work without asking them to carry the whole book.
Visualizing the checklist
KEY POINTS
- The burden is on the seasonal to prove it is real. With 250 days and free choice of start and end dates, you can mine a beautiful seasonal out of pure noise; a good backtest is the entry fee, not the proof.
- Test one, beat the same-period bias: the seasonal return must exceed the market's baseline drift over the same calendar window, not just be positive. Capturing the drift is not a pattern.
- Test two, no single trade carries the profit: check the concentration and whether the seasonal stays profitable after deleting the single best year. One monster year rescuing nineteen flat ones is luck in costume.
- Test three, a significant share of years follows the bias: count the directional hit rate and test it against a fair-coin null. 16 of 20 up has about a 0.6% chance by luck; 12 of 20 has about 25% and proves nothing.
- The hit-rate p-value lies if you searched many windows. Count every window you tested, not just the one you kept.
- Test four, it has to make sense: the seasonal needs a nameable fundamental cause (harvest, tax deadline, scheduled release). The cause is what makes it likely to persist. Mining first and inventing a story after is the cardinal sin.
- Run all four as a logical AND. Each test catches a different self-deception; skipping one leaves that door open. What survives is usually a modest bias best used as a filter, not a standalone system.
References
- Trading Systems and Methods - Perry Kaufman (Amazon)
- Cybernetic Trading Strategies - Murray Ruggiero (Amazon)
- The Art of Currency Trading - Brent Donnelly (Amazon)
- Beyond the replication crisis of weekly seasonality
- Seasonality Tests
- A Survey of Recent Developments in Seasonal Adjustment
- When Are Statistical Forecast Gains Economically Relevant? The Case of Bitcoin
- High-Frequency Trading, Asset Pricing, and Market Microstructure
- On stock price overreactions: frequency, seasonality and information
- Performance and Risk of an AI-Driven Trading Framework - arXiv
- Predicting DART Spread Spikes in ISO Electricity Markets - arXiv