1.19 How to Make Technical Analysis Falsifiable
Most published TA is unfalsifiable. Every claim that is not structurally circular can be made falsifiable through a seven-step transformation: operationalize the trigger, bound the prediction, quantify success and failure, specify the benchmark, pre-commit everything. The rest is vibes.
Most technical analysis is not wrong. It is unfalsifiable. The distinction matters because unfalsifiable claims sit outside the domain of evidence. They cannot be tested, proven, or disproven. They can only be agreed with or disagreed with on aesthetic grounds. A claim that cannot be falsified by any possible observation is a claim about taste, not about markets.
Every TA claim can be made falsifiable. The transformation is operational and mechanical. It requires turning fuzzy verbal descriptions into deterministic functions, bounded predictions, and pre-committed thresholds. The transformation is what most published TA refuses to do, because the transformation often kills the claim.
The trader who learns to perform the transformation systematically will discard most of the TA they previously trusted. The remaining patterns, if any, will be the few worth running.
Seven structural defects that block falsifiability
A TA claim fails the falsifiability test when it has one or more of these defects.
Subjective pattern recognition. "A head and shoulders pattern appears here." Different analysts looking at the same chart disagree on whether the pattern is present. The criterion for "the pattern exists" lives in human judgment, not in the data. Two researchers running the same test on the same data get different inputs and different outputs.
Open-ended time horizons. "Eventually the price will revert." Eventually is not a time horizon. Any prediction can be true eventually if the horizon is unbounded. A claim that does not specify when the prediction must occur cannot be tested before then, which means it cannot be tested at all.
Missing parameters. "Buy when the moving average crosses." Which moving average? Crosses what? Buy how much? Hold for how long? Without parameters, the claim is not a rule. It is a sketch.
Cherry-picked instances. "Look at this chart, the pattern worked here, and here, and here." The published examples are the ones that worked. The implicit population of attempts (including the failures that were never published) is unknown. The headline win rate is the win rate of the surviving examples, which is unrelated to the true population rate.
Missing baseline. "After this pattern, the market went up 60% of the time." Without knowing how often the market went up unconditionally during the same period, the conditional rate carries no information. If the market went up 60% of the time anyway, the pattern adds nothing.
Result-dependent definition. "This was a true breakout because the price kept rising. A breakout that fails is a false breakout, not a true one." The pattern's definition includes the outcome. The pattern, defined this way, can never fail because failure is excluded by definition. This is the classic move that turns a falsifiable claim into an unfalsifiable one.
Goalpost-shifting on failure. "The pattern works, but only in trending markets, and only when volume confirms, and only when the broader trend agrees." Each new condition is added after a failure. The original claim recedes behind a growing list of exceptions, each of which was discovered after the fact. The growing claim is unfalsifiable by construction because any failure becomes evidence for a missing condition rather than evidence against the claim.
A TA claim that exhibits any of these defects is not falsifiable as stated. Fixing the defect is the first step of the transformation.
The seven-step transformation
Take any TA claim. Apply these seven steps in order. The output is a falsifiable specification.
Step 1. Operationalize the trigger. Replace subjective pattern recognition with a deterministic function. The function takes market data as input and returns a binary signal as output. Two researchers running the function on the same data produce identical signal series. If two researchers cannot do this, the claim has not yet been operationalized.
Step 2. Operationalize the prediction. Replace vague directional statements ("the market will go up") with measurable outcomes. The prediction names a specific variable (close price, return, drawdown), a specific direction (up, down), and a specific magnitude (greater than X%, less than X%, between A% and B%).
Step 3. Bound the prediction in time. The prediction must specify when it is evaluated. "Within 10 trading days after the trigger fires" is a bound. "Eventually" is not. Without a bound, the claim cannot be falsified by any observation.
Step 4. Quantify the success criterion. The claim must specify what fraction of historical instances meeting the prediction qualifies as "the pattern works." If 60% of instances meet the prediction, is that success? Is 55%? Is 51%? The threshold is committed in advance, not chosen after seeing the result.
Step 5. Quantify the failure criterion. The claim must specify what fraction qualifies as "the pattern does not work." This is not always the complement of the success criterion. The failure criterion includes both the case where too few instances meet the prediction and the case where the conditional rate is statistically indistinguishable from the baseline rate.
Step 6. Specify the benchmark. The claim must specify what the pattern's outcome is compared against. The unconditional base rate of the same outcome during the same period is the minimum benchmark. A permutation null (signals randomized in time) is a stronger benchmark. A bias-matched random rule is a stronger benchmark still.
Step 7. Pre-commit all parameters. Every choice from steps 1 through 6 is written to a file with a timestamp before any historical data is queried. Modifying any choice after seeing the result invalidates the test and removes its falsification value.
A claim that has been through all seven steps is falsifiable. A claim that has been through fewer is still vibes.
Worked example: head and shoulders
Start with the published claim: "A head and shoulders pattern is a bearish reversal signal."
The claim is not falsifiable as stated. Apply the seven steps.
Trigger (Step 1). "A head and shoulders pattern is present at time t if all of the following hold:
- A local maximum P1 exists between t−60 and t−40 (the left shoulder)
- A local maximum P2 exists between t−40 and t−20 (the head), with P2 > P1 by at least 3%
- A local maximum P3 exists between t−20 and t−5 (the right shoulder), with |P3 − P1| < 1.5%
- A 'neckline' is the line connecting the troughs T1 (between P1 and P2) and T2 (between P2 and P3)
- The closing price at time t is below the neckline extrapolated to t."
The trigger is now a function. Any researcher running it on the same data produces the same signal series.
Prediction (Step 2). "After the trigger fires, the price will close below the neckline by at least 5% in subsequent observations."
Time bound (Step 3). "The prediction is evaluated 20 trading days after the trigger fires. If the price has closed at least 5% below the neckline at any point in those 20 days, the prediction is met. If not, the prediction fails."
Success criterion (Step 4). "The pattern is considered to have signal if at least 55% of historical trigger instances meet the prediction, AND the conditional win rate exceeds the baseline win rate by a margin that is statistically significant at the 5% level."
Failure criterion (Step 5). "The pattern is rejected if either the conditional win rate is below 55%, OR the conditional win rate is not statistically distinguishable from the baseline at the 5% level."
Benchmark (Step 6). "The baseline is the unconditional rate at which the price closes at least 5% below an arbitrary reference line within any 20-day window during the same historical period. A permutation null is also computed by randomizing the timestamps of all trigger instances 5000 times and recomputing the conditional rate."
Pre-commitment (Step 7). "All parameters (40-day shoulder windows, 3% head magnitude, 1.5% shoulder symmetry tolerance, 5% follow-through magnitude, 20-day evaluation horizon, 55% threshold, 5% significance level) are committed to a file with a timestamp before any backtest is executed."
The claim has been transformed. It is now a falsifiable hypothesis. It can be tested against historical data. The result will be either rejection or non-rejection of the null at the 5% level.
Most rigorous tests of patterns like head and shoulders find conditional win rates close to the unconditional baseline, with differences that are not statistically significant. The pattern, once operationalized, fails the test. The claim that the pattern is a reversal signal is rejected by the data. The trader who has done the work to falsify a popular pattern is ahead of the trader who has not.
The statistical machinery
The success criterion requires comparing two conditional probabilities: the rate at which the prediction is met given the pattern fires, and the rate at which the prediction is met given a random or baseline condition. The difference is tested for statistical significance.
Where p_pattern is the observed conditional rate, p_baseline is the unconditional rate, and N_pattern and N_baseline are the corresponding sample sizes. The z-score for the comparison is z = Δp / SE(Δp). If |z| > 1.96, the difference is significant at the 5% level and the pattern has evidence of signal. If |z| < 1.96, the difference is consistent with sampling noise and the pattern has not been distinguished from the baseline.
Concrete example. A head and shoulders trigger fires 200 times in a 20-year sample. Of those, 110 lead to a 5% drop within 20 days. The conditional rate is 0.55. The unconditional rate of 5% drops within any 20-day window during the same period is 0.51. The difference is 0.04. The standard error is approximately √(0.25/200 + 0.25/4000) ≈ 0.036. The z-score is 0.04 / 0.036 ≈ 1.11. The difference is not significant at the 5% level. The pattern has not been distinguished from the baseline. The claim is rejected.
A 4-percentage-point conditional advantage that looks impressive in a marketing slide collapses under the standard error of the comparison. This is the experience most published TA patterns deliver when tested rigorously.
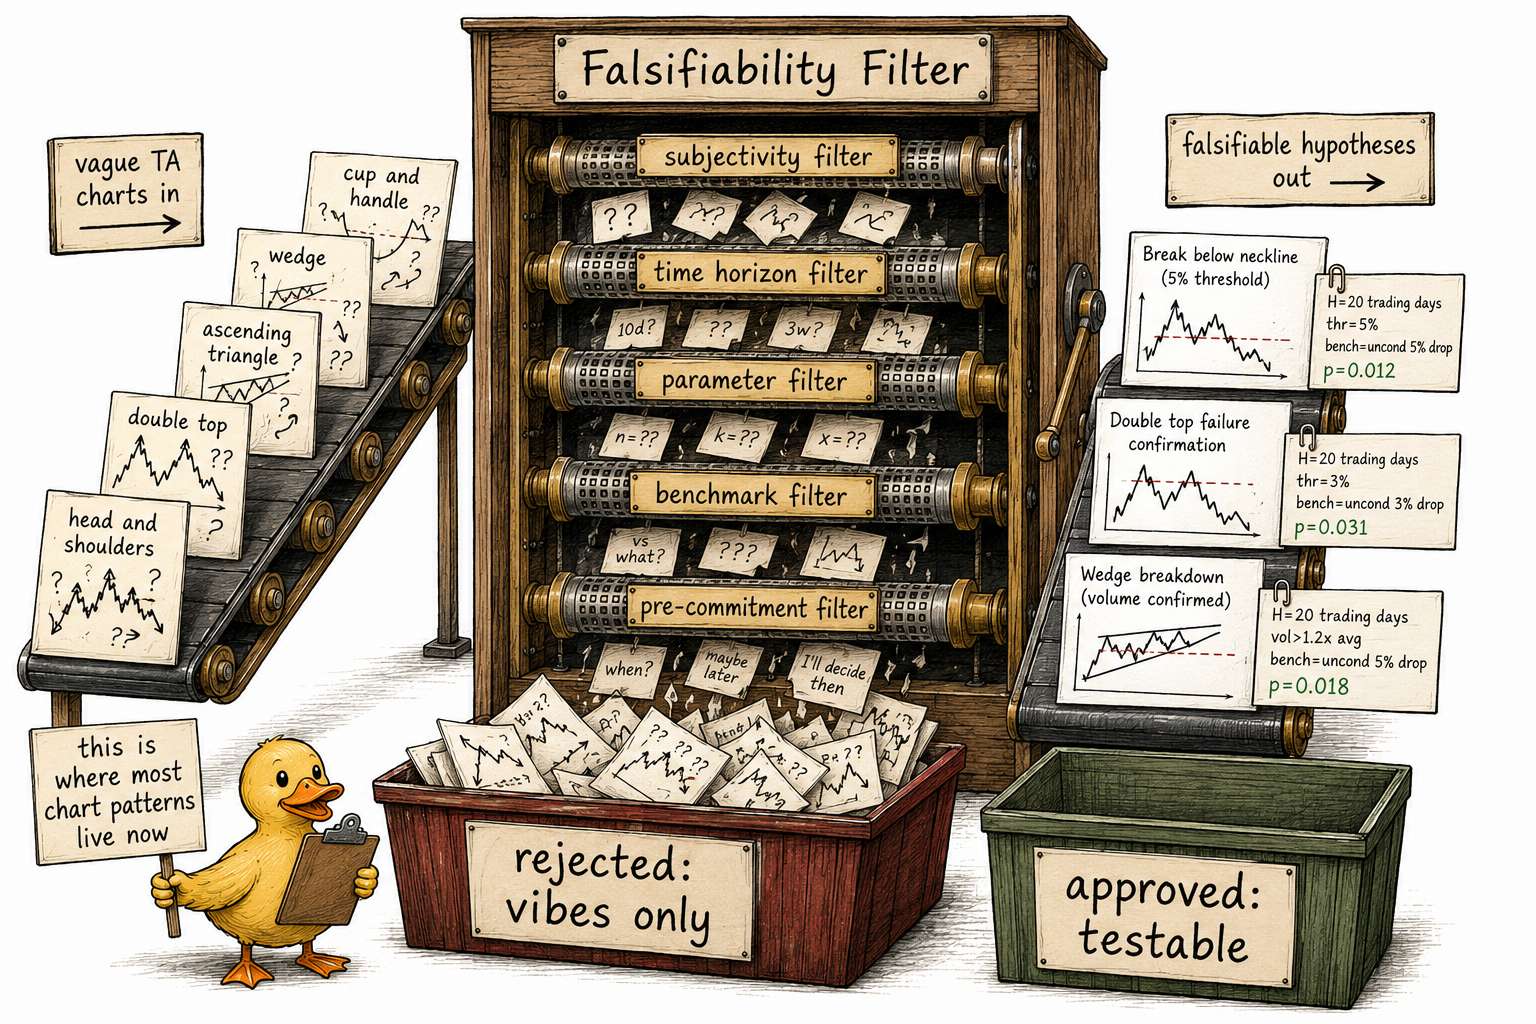
Visualizing the transformation
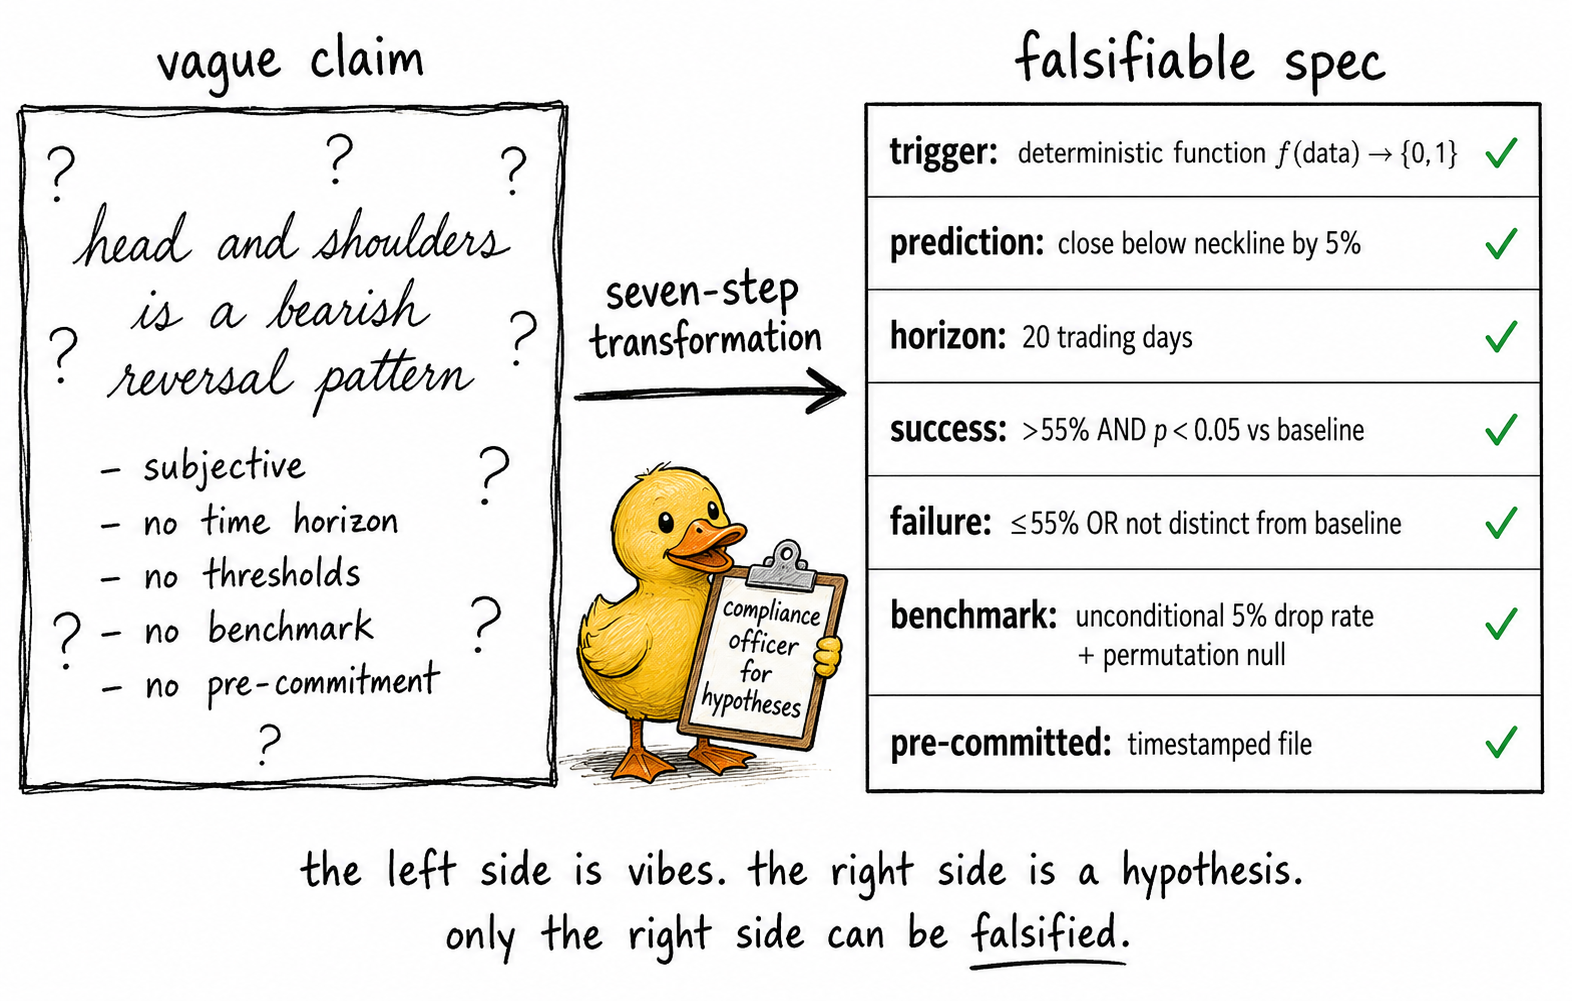
The picture is the entire article in one image. The left side is most published TA. The right side is the only form of TA that can be evaluated.
Claims that cannot be made falsifiable
Some TA claims are structurally unfalsifiable and cannot be saved by any transformation. These should be rejected before any testing.
Circular claims. "The trend is your friend" is true by definition if "trend" is defined as the price direction that is going to continue. The claim contains no testable content because the definition includes the outcome.
Claims with infinite escape hatches. "This works when the conditions are right" is unfalsifiable because any failure becomes evidence of wrong conditions, not evidence against the claim. The list of conditions can be extended without limit to absorb any counter-example.
Result-dependent definitions. "A real breakout is one where the price keeps going. A failed breakout was never a real breakout." The pattern is defined by the outcome, so the pattern can never fail. The transformation cannot fix this without redefining the pattern, which changes the claim.
Claims that reject all tests. Some TA practitioners reject any quantitative test as "missing the art of the chart." This is the explicit declaration that the claim is not in the domain of evidence. It is honest in a way most TA is not. It also makes the claim irrelevant to anyone running real capital.
What this changes for the practitioner
Three practical consequences.
Refuse to evaluate any TA claim that has not been put through the seven-step transformation. If the claim cannot be coded into a deterministic function, it is not a rule. If it has no time horizon, it is not a prediction. If it has no benchmark, it is not testable.
Treat the failure of a transformed claim as the more common outcome. When real TA patterns are tested with operational definitions and proper benchmarks, the majority of them produce no significant signal. This is the empirical pattern. Expecting it in advance prevents disappointment and saves capital.
Be willing to publish the rejections. The TA practitioner who tests 30 patterns and reports the 2 that survived has done useful work for the community. The practitioner who reports only the 2 successes has done the opposite.
KEY POINTS
- Most published TA is unfalsifiable because the claims are subjective, time-unbounded, parameter-free, cherry-picked, baseline-free, result-dependent, or built to absorb failures with new conditions.
- Every TA claim that is not structurally unfalsifiable can be transformed into a falsifiable specification through a seven-step procedure: operationalize the trigger, operationalize the prediction, bound the horizon, quantify the success criterion, quantify the failure criterion, specify the benchmark, and pre-commit all parameters.
- The trigger must be a deterministic function. Two researchers running the same function on the same data must produce identical signals. Subjective pattern recognition does not survive this step.
- The benchmark is the unconditional rate of the same outcome during the same period. A permutation null is a stronger benchmark. A bias-matched random rule is stronger still.
- The statistical test compares the conditional rate to the baseline rate. Δp = p_pattern − p_baseline, with SE computed from both sample sizes. |z| > 1.96 is significant at the 5% level.
- Worked head-and-shoulders example: 200 triggers, 110 successes (55%), baseline 51%, z ≈ 1.11, p > 0.05. The pattern is not distinguished from the baseline. The claim is rejected. This is the typical empirical result for popular patterns.
- Some TA claims are structurally unfalsifiable and cannot be saved: circular claims, claims with infinite escape hatches, result-dependent definitions, and claims that reject all quantitative testing on principle. These should be rejected before any testing.
- Practitioner consequences: refuse to evaluate untransformed claims, expect most transformed claims to fail the test, publish the rejections alongside the survivors.
References
- Evidence-Based Technical Analysis - David Aronson (Amazon)
- Systematic Trading - Robert Carver (Amazon)
- Classifying Hedge Fund Strategies with Large Language Models
- Non-random behavior in financial markets
- systematic funds outperform discretionary funds
- Introduction - arXiv
- A Hybrid Systematic-Discretionary Channel Breakout Framework for
- Modeling Market States with Clustering and State Machines - arXiv
- Trading and the Limits of Reason
- Leveraging Sample Entropy for Enhanced Volatility Measurement and