4.71 Stocks and Bonds Predict FX — But Only in Emerging Markets
The random walk still wins for developed FX. But a stock-return signal beats it for emerging currencies, netting about 7% a year, when it works. The edge is real, and it comes and goes.

Meese and Rogoff broke exchange-rate forecasting in 1983. They showed that no macro model, not interest rates, not money supply, not trade balances, beat a coin-flip random walk out of sample. Four decades later that result still stands for the dollar, the euro, the yen. Phylaktis and Yamani ran a different predictor through the same gauntlet: not the usual macro fundamentals, but the return on a country's own stock and bond markets relative to the US. The random walk survived again for developed currencies. For emerging currencies it did not. An equity-return signal predicted the next month's move well enough to trade, net of costs, and the profit did not exist in the developed world.
The old article "Why FX Traders Must Watch Gold, Rates, and Equities" made the structural case that a currency has no standalone fundamentals, so the force that moves it lives in other markets. This paper is that claim run as a strict out-of-sample horse race across 28 countries, and it hands back a sharp, uncomfortable answer: the cross-market signal is real, but only where the market is inefficient enough to leak it.
One regression, one differential
The whole paper hangs on a single predictive regression. Take a currency, take the return on that country's stock market minus the return on the US stock market, and use that differential to forecast next month's exchange-rate move.
$$ \Delta s_{i,t+1} = \alpha + \beta \left( r^{E}_{i,t} - r^{E,US}_{t} \right) + \varepsilon_{i,t+1} $$
The left side, delta-s, is next month's log change in the exchange rate quoted as foreign-currency units per one US dollar, so a fall in delta-s means the foreign currency strengthened. The predictor in parentheses is the local stock return minus the US stock return, the equity differential. Beta is the one number that decides whether the signal points the right way, and alpha is the drift the random walk also gets. The bond version swaps in the government-bond return differential; the combined version uses both.
The sign of beta is the mechanism. Across the combined model the equity coefficient came in negative for every basket: minus 0.105 developed, minus 0.129 emerging, minus 0.083 global. Negative means that when the foreign stock market outruns the US, the foreign currency tends to appreciate next month. That is the return-chasing story: foreign investors see a hot local equity market, buy in, and bid up the local currency to do it.
Work a number. Emerging equity coefficient is minus 0.129. Suppose an emerging market's stocks beat US stocks by 2 percentage points this month, so the differential is plus 2. The model predicts delta-s of minus 0.129 times 2, which is minus 0.26%. Delta-s negative means the foreign currency is forecast to appreciate about a quarter percent next month, so you buy that currency. That is the entire forecast. One coefficient, one differential, one month ahead.
The random walk is the bar, and it is a high one
A positive-looking regression means nothing here, because the benchmark is not zero. It is the random walk, and beating it out of sample is the whole game the FX literature has lost for forty years. The paper scores every forecast against the random walk with the out-of-sample R-squared.
$$ R^{2}_{OOS} = 1 - \frac{MSFE^{\chi}}{MSFE^{RW}} $$
MSFE is the mean squared forecast error, the average of the squared misses. The formula divides your model's error by the random walk's error and subtracts from one. If your model's squared errors are smaller, the ratio drops below one and the out-of-sample R-squared turns positive. If you forecast worse than the random walk, it goes negative. Zero is the coin flip.
Work it for the combined model on emerging currencies. Its MSFE is 4.479 and the random walk's is about 4.715, so the ratio is 0.95 and the out-of-sample R-squared is 1 minus 0.95, which is 0.05. The model's squared errors run about 5% below the random walk. For monthly FX that is a large edge, and it only appears in emerging currencies. The developed combined model posts a ratio of 1.016, an out-of-sample R-squared of minus 0.016, so it forecasts worse than doing nothing. The paper backs this with a Clark-West test, a formal t-test of whether two nested models have equal predictive accuracy, because a raw R-squared gap can be luck.
The asymmetry is the whole result
The Clark-West statistics draw a clean line between the two worlds. Read them and the paper's thesis is obvious in one glance.
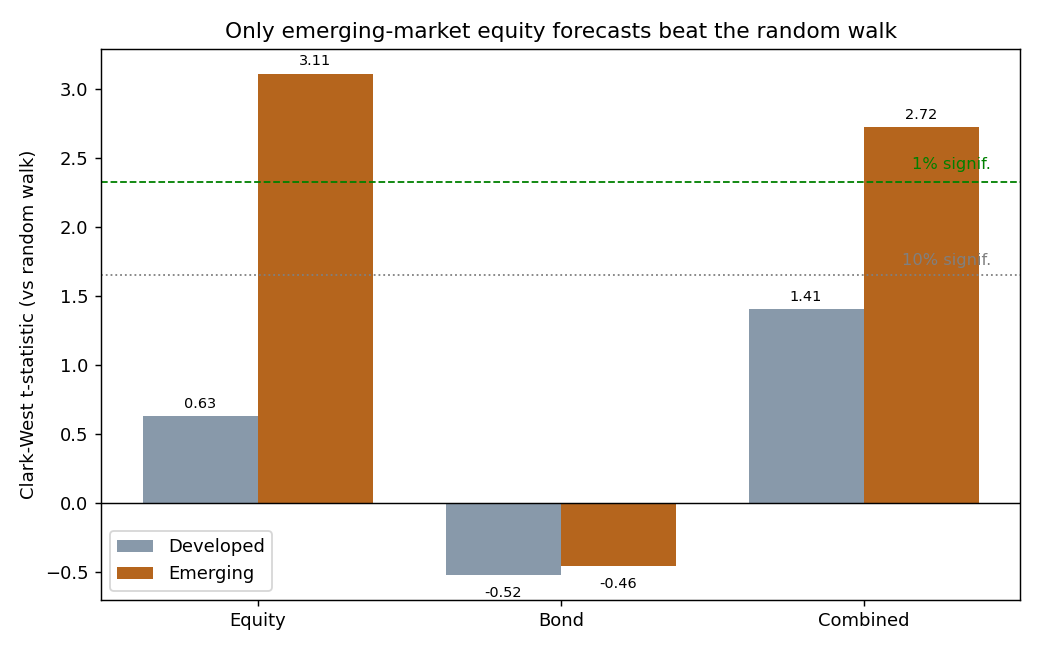
Emerging equity forecasts hit a Clark-West t of 3.11, past the 1% bar. Emerging combined forecasts hit 2.72, also past 1%. Both crush the random walk. The developed portfolio's equity model manages 0.63 and its combined model 1.41, neither clearing even the 10% line. Bonds fail everywhere in this full-sample test, with negative t-stats for both groups. Stock returns carry information about emerging currencies and almost nothing about developed ones.
This is the empirical face of what the old article "Using Bonds to Filter Equity Signals" argued in the other direction: stocks and bonds and currencies are three prices set by overlapping forces, so one market's return is a legitimate gate or predictor for another. Here the equity market is the leading price and the currency lags it by a month, but only where the lag is wide enough to trade.
Statistical significance is not a paycheck
A significant t-stat does not pay rent. The paper's second test turns each forecast into a position: go long the currency if the predicted return is positive, short it if negative.
$$ Signal_t = \operatorname{sign}\left( \widehat{\Delta s}^{\chi}_{t+1|t} \right), \qquad \Delta s^{\chi}_{i,t} = Signal_t \times \Delta s_{i,t+1} $$
The signal is plus one or minus one depending on the sign of the forecast. The strategy return is that signal times the actual realized currency move. When the forecast calls direction right, sign and realized move share a sign and the product is positive. When it calls direction wrong, the product is negative. Direction is all that matters; the paper cites the old point that getting the sign right beats getting the magnitude right for a trading rule. Then it subtracts transaction costs, half the bid-ask spread on each turn, before reporting anything.
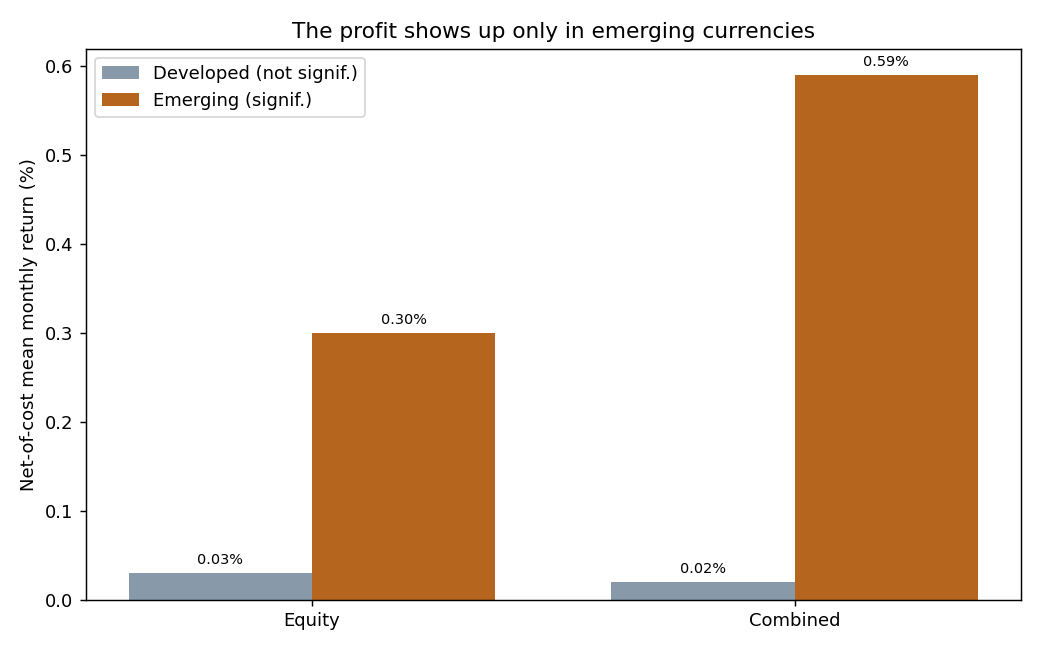
Net of those costs the emerging equity strategy earned 0.30% a month and the combined strategy 0.59% a month, about 7% a year, with positive skew, meaning the rare big months were gains not losses. Both beat the random walk, and the combined rule beat currency momentum and the carry trade, the two workhorses of FX. In developed currencies the same machinery produced nothing worth trading.
Why emerging and not developed
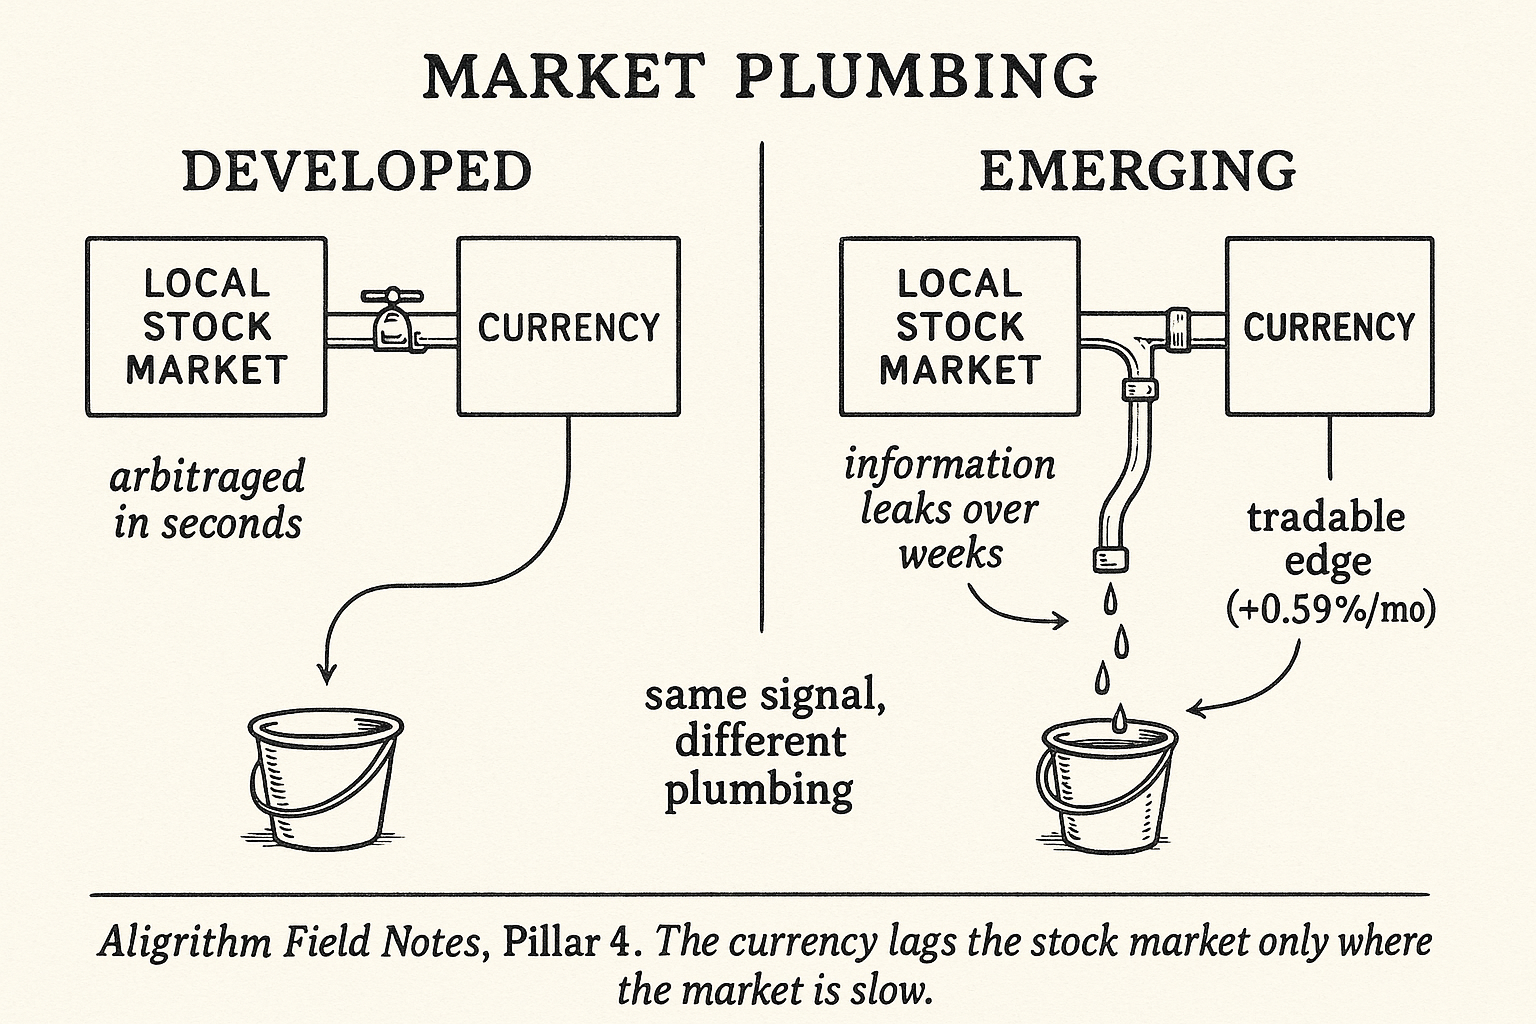
The split is not an accident of the sample; it is the point. Developed currency markets are deep, integrated, and picked over, so any stock-to-currency signal gets arbitraged before you can trade it. Emerging markets are thinner, more segmented, and carry more information leakage, so prices absorb news sluggishly and the equity lead-in survives long enough to harvest. The paper leans on the return-chasing channel to explain the mechanism: capital flows into hot emerging equity markets drag the currency up behind them, and that flow is slow and observable.
This is where the old article "PPP and the Big Mac Index: Why Valuation Only Matters Long-Term" fits as a foil. Purchasing power parity says a currency has a fair value it eventually reverts to, but it can stay mispriced for years, so valuation is useless for a one-month bet. This paper works the other clock. It ignores fair value entirely and rides the short-horizon flow signal from equities, the thing that actually moves the pair next month while PPP sleeps. Two different horizons, two different drivers, and only one of them pays inside a month.
The catch: it comes and goes
Here the skeptic earns their seat. The paper splits the out-of-sample period in two, and the edge is not stable. From September 2006 to April 2013, through the global financial crisis and the sharp dollar spike that came with it, none of the combined-model forecasts beat the random walk and the strategies made no reliable money. The bond strategy actually lost 0.68% a month on emerging currencies in that window. Only from May 2013 to December 2019 did the signal switch on: the combined model turned significant, and the bond strategy flipped from that 0.68% loss to a 0.47% monthly gain.
So the headline "stocks predict emerging FX" is really "stocks predicted emerging FX in one six-year window of a twenty-year sample." That is a live warning, not a footnote. A monthly signal whose sign of profitability inverts across regimes is exactly the kind of edge that looks great in the full-sample table and gets you run over when you deploy it into the wrong half of the cycle. The authors are honest about it, tying the dead patch to the crisis-era dollar and calling the profitability time-varying. Treat the 7%-a-year combined number as a regime-conditional result with a real off switch, size it small, and watch the same rate-equity-gold confirmation the old FX articles insist on before trusting the stock signal alone.
KEY POINTS
- The predictor is a country's own stock (or bond) return minus the US return, run through one linear regression to forecast next month's exchange-rate move.
- The benchmark is the random walk, unbeaten in developed FX since Meese and Rogoff 1983. Beating it out of sample, not posting a positive backtest, is the entire bar.
- Equity return differentials beat the random walk for emerging currencies (Clark-West t of 3.11 equity, 2.72 combined, both 1% significant) and fail for developed currencies (t of 0.63 and 1.41, not significant). Bonds fail in the full sample for both.
- The combined emerging model cut mean squared forecast error about 5% below the random walk, an out-of-sample R-squared near 0.05, large for monthly FX.
- Trading the sign of the forecast net of costs earned about 0.30% a month on emerging equity signals and 0.59% a month combined, with positive skew, beating carry and momentum. Developed currencies produced nothing tradable.
- The mechanism is return-chasing: capital flows into hot emerging equity markets pull the currency up behind them, and emerging markets are slow and segmented enough that the lag survives arbitrage.
- The edge is time-varying. It was dead from 2006 to 2013 (the bond rule lost 0.68% a month through the crisis) and alive from 2013 to 2019 (bond rule +0.47%). One six-year window carries the full-sample result.
- Valuation anchors like PPP work on a multi-year clock and are useless here; this is a one-month flow signal, a different driver at a different horizon.
A note on AI. The ideas, research, analysis, and conclusions in this article are my own. I use AI tools to help with editing and wordsmithing, because English is not my first language, and I am not shy about that. AI-generated ideas and AI-assisted writing are not the same thing: the first is empty slop from a generic prompt, the second is a tool for communicating years of real research more clearly. Judge the work by its substance, not by whether software helped polish the prose.
References
- Trading Systems and Methods - Perry Kaufman (Amazon)
- Cybernetic Trading Strategies - Murray Ruggiero (Amazon)
- The Art of Currency Trading - Brent Donnelly (Amazon)
- Foreign currency forecasting: What can stock and bond markets tell us?* (Foreign currency forecasting What can stock and bond markets tell us)