2.54 Spectral Dilation: Why Long Cycles Drown Out Short Ones
Long cycles are bigger, not just slower, so a raw spectrum reports them as dominant by default. Across several octaves you must compensate for this amplitude tilt or your cycle estimate lies.
The old article "The Frequency Response of Trading Indicators" taught you to read a filter's magnitude curve, the gain at every cycle band, and to pick indicators by which cycles they keep rather than by their name. That curve describes what the filter does to a signal of fixed amplitude. It quietly assumes every cycle arrives at the same size. In real price data they do not, and the gap between that assumption and reality has a name: spectral dilation. Ignore it and your spectrum estimate will tell you the market is dominated by a long cycle when the truth is that the long cycle is just louder.
Long cycles are bigger, not just slower
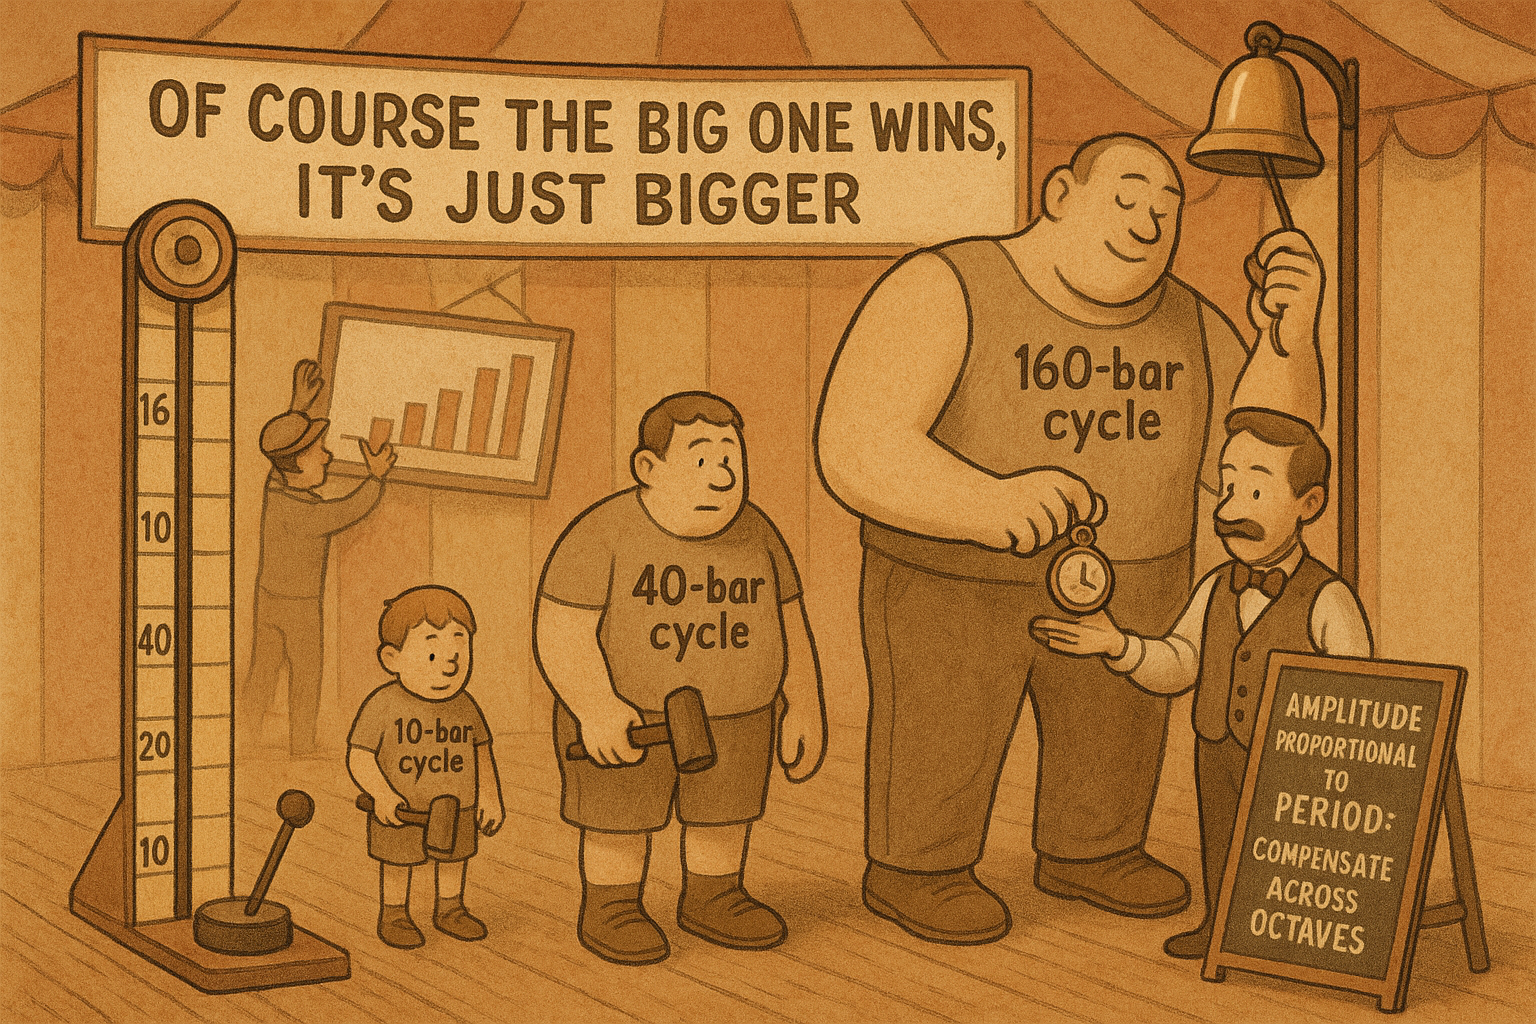
Pull up any instrument across timescales and the pattern is impossible to miss: the annual swing is larger than the monthly swing, and the monthly swing is larger than the daily swing. Amplitude grows with the period of the cycle. This is not a quirk of one market; it is the structural consequence of price being close to a random walk, where the expected size of a move scales with the square root of the horizon, so longer cycles accumulate larger excursions. Ehlers' working approximation is even blunter and good enough for the trader: amplitude is roughly proportional to period.
$$ \text{Amplitude} \;\propto\; \text{Period} $$
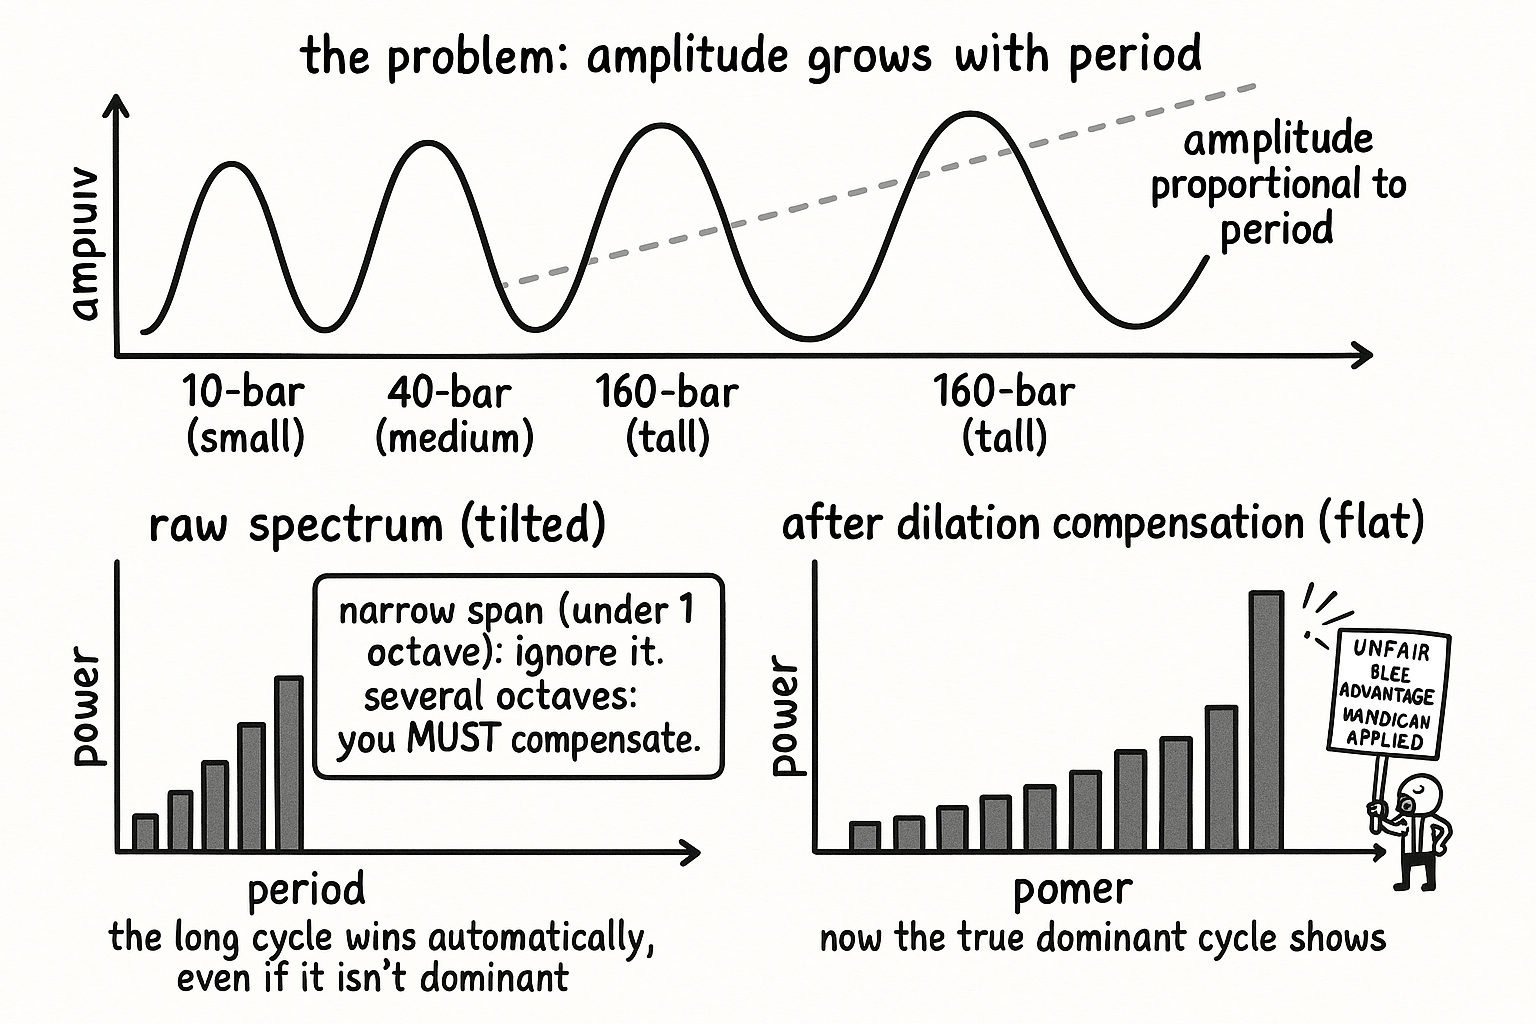
Read what that does to a spectrum. A spectrum measures power, the squared amplitude, at each cycle. If amplitude rises with period, power rises faster still, so a raw spectral estimate of price is tilted: the slow end towers over the fast end before you have learned anything about which cycle actually carries tradeable structure. This is the same fact the old article on noise colors stated from the other direction, that price sits near the brownian spectrum with power piled at the slow cycles. Spectral dilation is that tilt seen as a measurement problem.
When you can ignore it and when it ruins the estimate
The fix depends entirely on how wide a span of cycles you are looking across, measured in octaves (an octave is a doubling of period: 10 to 20 bars is one octave, 10 to 40 is two).
$$ \text{narrow span (under ~1 octave)} \;\Rightarrow\; \text{dilation negligible} \qquad \text{several octaves} \;\Rightarrow\; \text{must compensate} $$
If you are hunting the dominant cycle inside a narrow band, say somewhere between 18 and 30 bars, the amplitude tilt across that small range is mild and you can ignore it; every candidate cycle is roughly the same size, so whichever shows the most power is genuinely dominant. The trouble starts when you let the estimator see several octaves at once, from a 10-bar cycle out to an 80-bar cycle. Now the amplitude tilt spans a factor of eight, the power tilt far more, and the slow cycles drown out the fast ones by construction. Your periodogram will report a long dominant cycle every time, not because the market is trending on that period but because the long cycle was handed an unfair amplitude advantage before the contest began.
Compensate, or pick a method that never tilts
There are two honest responses. The first is to compensate explicitly: before reading the spectrum, scale each cycle's measured amplitude back down in proportion to its period, flattening the tilt so cycles compete on equal footing. This is the correction the dominant-cycle estimators apply when they have to work across a wide range, and skipping it is the single most common reason a homemade spectrum points at the wrong cycle. The second response, which the next article develops, is to use a method that does not produce the tilt in the first place. The autocorrelation periodogram, the old article "Dominant Cycle Estimation Without Astrology" flagged as the production default, sidesteps dilation entirely because it works from correlation rather than raw amplitude, so there is no amplitude tilt to undo.
Carry the caveat the frequency-response article and the evanescent-cycles article both pressed. A clean dominant-cycle number, even a dilation-corrected one, describes the recent sample, not the future; the cycle it names may already be drifting or gone. Spectral dilation is a measurement correction, not a source of edge. It keeps your estimator honest about which cycle is loudest right now, and nothing more.
KEY POINTS
- A filter's frequency-response curve assumes every cycle arrives at the same amplitude; real price violates this because longer cycles are larger, not just slower.
- Ehlers' working rule is amplitude proportional to period (a random-walk consequence), so a raw spectrum of price is tilted with power piled at the slow end, the same fact the noise-color article stated as price sitting near the brownian spectrum.
- The tilt is measured in octaves of cycle period. Across a narrow span (under about one octave) it is negligible and you can ignore it; across several octaves it dominates and your periodogram reports a long cycle by construction.
- Fix it either by compensating explicitly (scale each cycle's amplitude down in proportion to its period before reading the spectrum) or by using a method that never tilts.
- The autocorrelation periodogram, the production default from the old article "Dominant Cycle Estimation Without Astrology," sidesteps dilation entirely because it works from correlation, not raw amplitude.
- Dilation correction is a measurement fix, not edge; a clean dominant-cycle number still describes the recent sample and may already be drifting, per the old article "Why Market Cycles Are Evanescent."
References
- Cycle Analytics for Traders - John Ehlers (Amazon)
- Spectral Dilation and the Autocorrelation Periodogram (Ehlers, MESA papers)
- Power Spectral Density of random-walk and 1/f processes (Stanford CCRMA)
- Octave-band analysis and amplitude weighting (DSP overview)
- The Color of Noise (spectral tilt overview, Wikipedia)