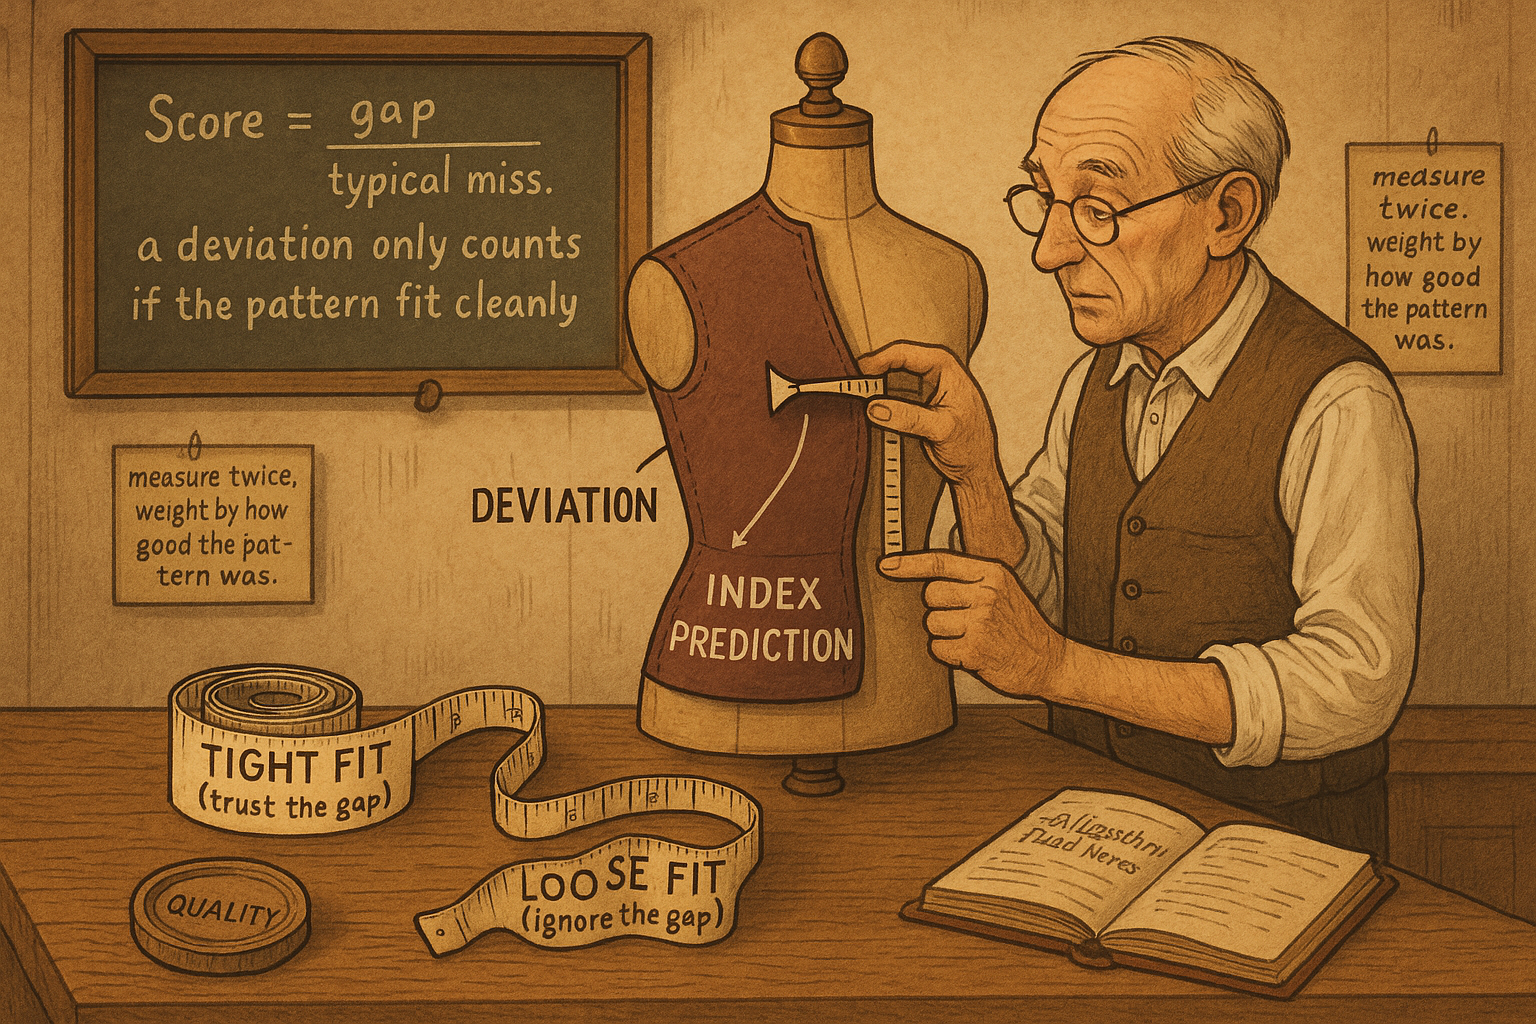
4.52 Deviation from Index Prediction, Weighted by Fit Quality
Regress a stock on its index in logs, read the residual, then divide it by the fit's RMS error so a gap only counts when the prediction was trustworthy. A weighted divergence filter, not a trigger.
The old article "Spearman Coupling: When a Stock Decouples from Its Index" answered one question: is the index still a valid reference for this stock? This answers the next one. Given that the index is a reference, what does it predict the stock should be doing right now, and how far is the stock from that prediction? The gap between the index-implied price and the actual price is the signal. A member tightly bound to the market moves when the market moves, so the index becomes a one-variable forecast of the member, and the residual, the part the index cannot explain, is where anything stock-specific shows up. The old article "Intermarket Divergence as a Trading Filter" worked the qualitative version of this: a market moving against what its partner predicts is the tradeable event. This builds the quantitative version, a regression that produces a number instead of an eyeball judgment.
The trap is treating every residual as equally meaningful. A two-dollar gap from a prediction built on a tight fit means something. The same two-dollar gap from a prediction built on a loose, scattered fit means nothing, because the model was never accurate enough to call two dollars a deviation. The fix is to weight the deviation by the quality of the fit that produced it, so a residual only counts when the regression had earned the right to be believed.
Regress the member on the index, in logs, including now
Use ordinary linear regression to predict the log price of the member from the log price of the index over a lookback window. Logs, not raw prices, for the reason this pillar keeps repeating: a ratio relationship between two prices becomes a linear one in logs, and proportional moves get treated equally across price levels. Do not reach for anything fancier than a straight line. Both series are soaked in noise, and a flexible model just fits more of that noise, so the simplest fit is the honest one.
Center both log-price windows, compute the slope from the cross term over the index's own variation, and you have the line.
$$ \text{slope} = \frac{\sum_{i} (x_i - \bar{x})(y_i - \bar{y})}{\sum_{i} (x_i - \bar{x})^2}, \qquad \hat{y}_t = \bar{y} + \text{slope}\,(x_t - \bar{x}) $$
Here x is the log index price and y is the log member price over the window, the bars are the windowed means, and the slope is the familiar least-squares estimate, the cross-variation of the two divided by the index's variation with itself. The predicted log member price y-hat at the current bar t is the member's average nudged by the slope times how far the index sits from its own average. The deviation is what is left over.
$$ \text{Dev}_t = y_t - \hat{y}_t $$
One detail decides whether this is honest: include the current bar in the regression. It sounds like cheating, fitting the line on the same bar you then measure against, but it is the opposite of cheating here. Leaving the current bar out lets a single fresh outlier blow the deviation up to nonsense, and it allows the absurd state of a fit that was perfect over the lookback yet shows a deviation on the new bar, which cannot happen if the new bar helped build the line. Including it anchors the deviation to a line the current bar actually belongs to, and shrinks the influence of any one print.
Devalue the deviation by the RMS error
The slope alone is not enough. A line can have a sensible slope and still fit terribly, with the points scattered far from it, and a deviation measured against a bad line is just noise dressed as signal. Quantify the fit with the root-mean-square error: predict the log member price at every bar in the lookback, accumulate the squared misses, divide by the number of bars, take the square root.
$$ \text{RMS} = \sqrt{\frac{1}{N}\sum_{i=1}^{N} \left(y_i - \hat{y}_i\right)^2}, \qquad \text{Score}_t = \frac{\text{Dev}_t}{\text{RMS}} $$
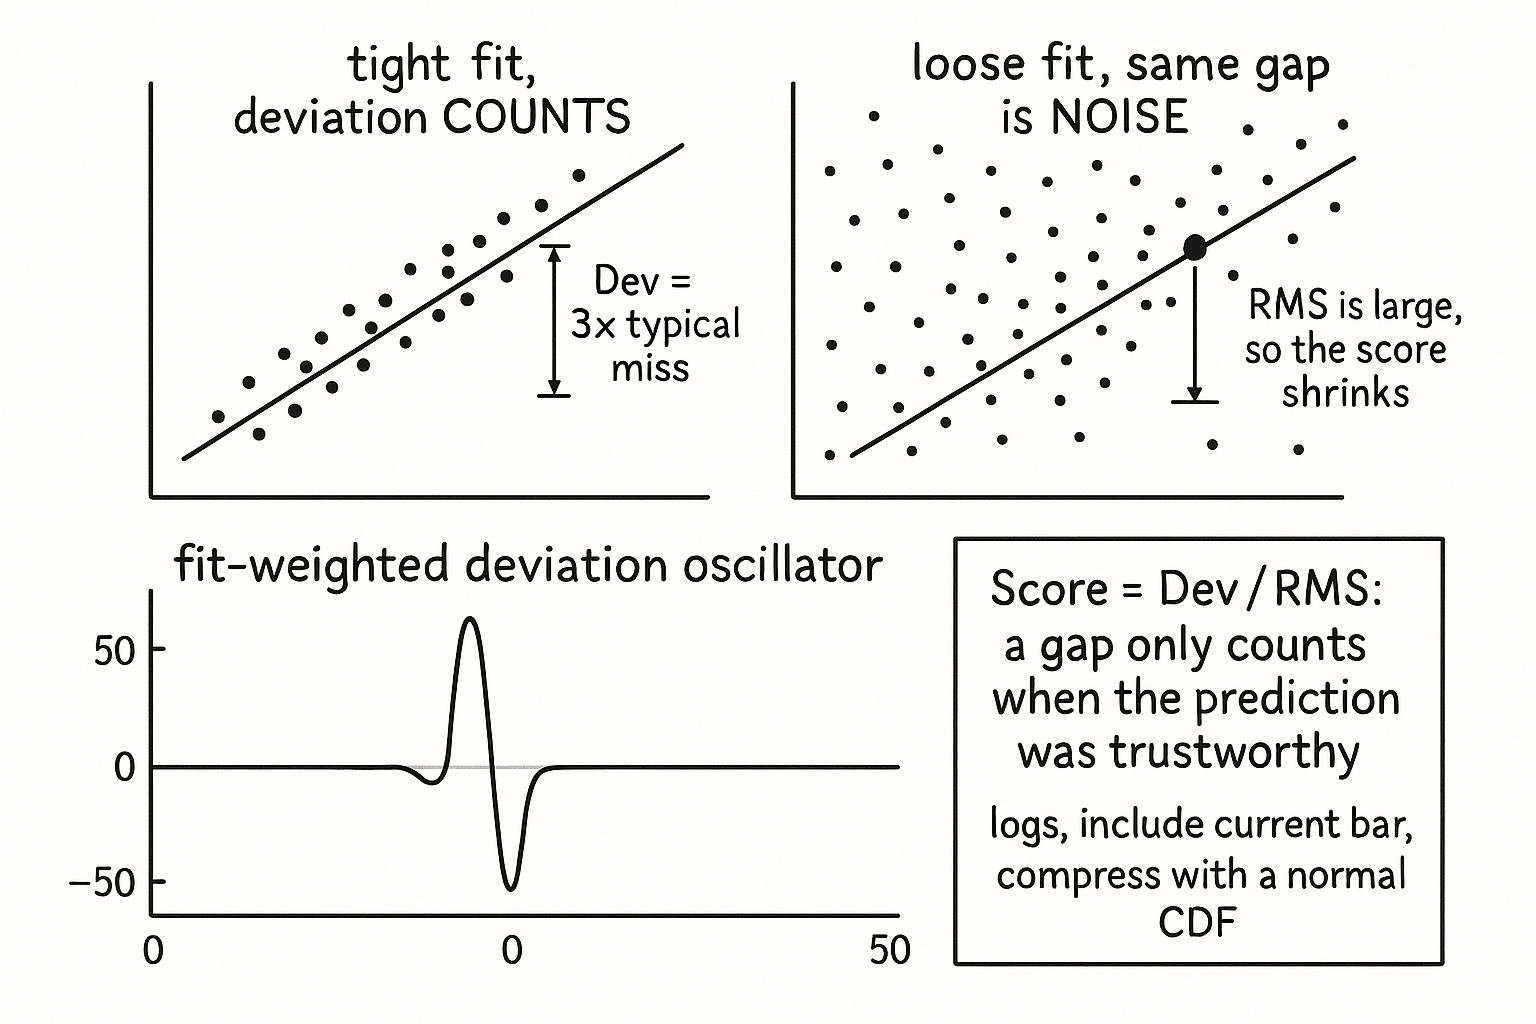
The RMS error is the typical size of a prediction miss over the window, in log-price units. Dividing the current deviation by it converts a raw gap into a count of typical misses, which is the whole point: a deviation gets emphasized when the fit was tight, because RMS is small and the ratio blows up, and gets buried when the fit was loose, because RMS is large and the ratio shrinks toward zero. A two-typical-miss deviation off a clean fit outranks a two-dollar deviation off a messy one, automatically. When the fit was excellent the model has earned the right to flag the gap as meaningful; when the fit was poor the same gap is correctly demoted to noise.
A worked number. Say the current log deviation is 0.018 and the window RMS error is 0.006, so the score is 3.0, a deviation three times the size of a normal miss, a genuine standout. Now suppose the index explained the member poorly that month and RMS is 0.020. The same 0.018 deviation scores 0.9, less than one typical miss, unremarkable. Same gap, opposite verdict, decided entirely by how trustworthy the prediction was.
Compress and smooth, then read it as a filter
The raw score has fat tails, so squash it into a bounded range with a normal CDF, the same compression the rest of the indicator pillar uses to tame outliers, scaled so the bulk of values land in a usable band. Then apply a short exponential smoothing to kill single-bar chatter, accepting the small lag that buys.
import numpy as np
import pandas as pd
from scipy.stats import norm


def index_deviation(member: pd.Series, index: pd.Series,
                    lookback: int = 60, smooth: int = 3) -> pd.Series:
    y = np.log(member)
    x = np.log(index)
    out = pd.Series(np.nan, index=member.index)
    for t in range(lookback, len(member)):
        xw = x.iloc[t - lookback + 1 : t + 1].to_numpy()   # includes current bar
        yw = y.iloc[t - lookback + 1 : t + 1].to_numpy()
        xc, yc = xw - xw.mean(), yw - yw.mean()
        xss = (xc ** 2).sum()
        slope = (xc * yc).sum() / xss if xss > 0 else 1.0
        pred = yw.mean() + slope * (xw - xw.mean())
        rms = np.sqrt(((yw - pred) ** 2).mean())
        dev = yw[-1] - pred[-1]
        score = dev / rms if rms > 0 else 0.0
        out.iloc[t] = 100.0 * norm.cdf(score) - 50.0     # compress to [-50, 50]
    return out.ewm(span=smooth).mean()
The window ends on the current bar, so there is no look-ahead despite the current bar being inside the regression, because every value used was known at time t. The output is a bounded oscillator centered at zero: positive when the member sits above what the index predicts after accounting for fit quality, negative when it sits below, and near zero when either the member is tracking the prediction or the fit was too poor to trust the gap.
Where it earns its keep and where it lies
Read this as a filter or a flag, the way the old article "Intermarket Divergence as a Trading Filter" framed divergence, not as a standalone entry. A large positive score says the member has run ahead of what the index justifies, which feeds two opposite theses depending on your model: mean-reversion, if you expect the member to snap back toward the index-implied level, or confirmation, if you read the breakaway as stock-specific strength the index has not caught up to. The indicator does not pick between those for you. It only quantifies and ranks the gap, and which interpretation pays is a property of your instrument and horizon that you have to test.
The honest failure modes are specific. The regression assumes a stable linear relationship over the lookback, and that relationship is exactly what breaks during the regime shifts you most want to catch, so the slope you fit can already be stale, which is why the coupling check from the old article "Spearman Coupling: When a Stock Decouples from Its Index" belongs upstream of this: do not trust an index-implied prediction for a stock that has decoupled. The fit-quality weighting helps but does not save you, because a high RMS correctly demotes the signal but also means you are flying blind exactly when the stock has gone idiosyncratic. The lookback is an arbitrary dial trading reactivity against stability, the CDF scaling is a cosmetic choice about where values land, and the whole construction is a relative statement, the member versus this index, so feeding it the wrong index produces a confident number about nothing. Choose the reference deliberately, gate it behind a coupling check, and treat the score as one input among several rather than a trigger.
KEY POINTS
- Regress the member's log price on the index's log price over a lookback, and read the residual: the index is a one-variable forecast of the member, and the gap between predicted and actual is where stock-specific information shows up.
- Use logs (proportional moves treated equally) and a plain straight line (both series are noisy, so a flexible model just fits noise). Include the current bar in the regression to stop a single fresh print from blowing up the deviation and to forbid the impossible perfect-fit-with-deviation state.
- Weight the deviation by fit quality: divide it by the window RMS error. A two-typical-miss gap off a clean fit outranks the same dollar gap off a messy fit. Same deviation, opposite verdict, decided by how trustworthy the prediction was.
- Compress the score with a normal CDF and apply short smoothing to get a bounded zero-centered oscillator, with the window ending on the current bar so there is no look-ahead.
- It is a filter, not a trigger. A large gap supports either mean-reversion or breakaway confirmation, and the indicator does not choose; your instrument and horizon do.
- Gate it behind the coupling check from the old article "Spearman Coupling: When a Stock Decouples from Its Index." The linear fit assumes a stable relationship, which is exactly what breaks in the regimes you care about, and a high RMS demotes the signal precisely when the stock has gone idiosyncratic.
References
- Statistically Sound Indicators for Financial Market Prediction - Timothy Masters (Amazon)
- Simple linear regression (Wikipedia)
- Root-mean-square deviation (Wikipedia)
- Ordinary least squares (Wikipedia)
- scipy.stats.norm: the normal CDF
- Trading Systems and Methods - Perry Kaufman (Amazon)
- Cybernetic Trading Strategies - Murray Ruggiero (Amazon)
- The Art of Currency Trading - Brent Donnelly (Amazon)
- Index tracking in financial markets: A comprehensive review of modeling approaches and strategies
- On the Use of Log Returns in Finance
- Stock Return Prediction based on a Functional Capital Asset Pricing Model
- Lead–lag relationship in daily returns between stock index futures and spot index prices
- Price discovery and liquidity recovery: Forex market reactions to macroeconomic news
- Deep Limit Order Book Forecasting: A Microstructural Guide
- Explainable Patterns in Cryptocurrency Microstructure
- Missing markets: Microstructure and liquidity on the London Stock Exchange