4.51 Spearman Coupling: When a Stock Decouples from Its Index
A stock's link to its index is a regime, not a constant. Measure it with outlier-proof Spearman rank correlation, watch it break, and use the break to kill index signals or arm event trades.
A single stock spends most of its life chained to its index. SPY twitches and AAPL twitches with it, because the market factor is the largest piece of any large-cap return. That chain is not a constant. It loosens during earnings, breaks when a company-specific shock lands, and occasionally inverts when the stock trades on its own news while the tape does the opposite. The coupling itself is a regime variable, and you can measure it directly instead of guessing from a chart. The old article "Cross-Pair Signals: Can EUR Predict GBP?" made the same point in FX: two instruments move together because they share a driver, and the interesting information lives in the moments they stop. Here the shared driver is the index, the member is the stock, and the quantity worth tracking is how tightly the two are still linked right now.
The wrong tool for this is Pearson correlation, and the old article "Why the Median Often Beats the Mean in Trading Features" already explained why. One earnings gap, one fat-tailed day, and Pearson's correlation swings on the strength of a single outlier, because it is built on squared deviations that the tail dominates. Stock returns are heavy-tailed by nature. Spearman's rank correlation fixes this by throwing away the magnitudes and keeping only the order.
Rank correlation, and why it survives the tail
Spearman correlation is Pearson correlation computed on ranks instead of raw values. Replace each return in the window with its rank (1 for the smallest, n for the largest), do the same for the index, and correlate the two rank vectors. Because a wild outlier becomes rank n no matter how wild, its leverage is capped. The closed form, when there are no ties, is a count of how far the two rank orders disagree.
$$ \rho = 1 - \frac{6\sum_{i=1}^{n} d_i^2}{n\,(n^2 - 1)} $$
Read it piece by piece. The term d_i is the difference between a day's rank in the stock and its rank in the index, so a day that is the stock's 3rd-largest move and the index's 3rd-largest move contributes a d_i of zero. Square those rank gaps, sum them, scale by the window size n, and subtract from one. When the two orderings match perfectly, every d_i is zero and rho is +1. When they are reversed, the sum hits its maximum and rho is -1. The output lives on the same minus-one-to-plus-one scale as Pearson, so it drops into any pipeline that expected a correlation, but it cannot be hijacked by one violent session.
A worked case makes the outlier immunity concrete. Take five days where the stock and index agree on direction every day, so their Spearman rho is +1. Now replace one of the stock's days with a 12-sigma earnings gap that the index did not share. Pearson correlation collapses toward zero because that one squared term swamps the others. Spearman barely moves, because the gap is still just the largest rank in the window, position n, and it only disagrees with the index by however many rank slots separate them. The rank machinery refuses to let one day rewrite the relationship.
What a falling rho actually tells you
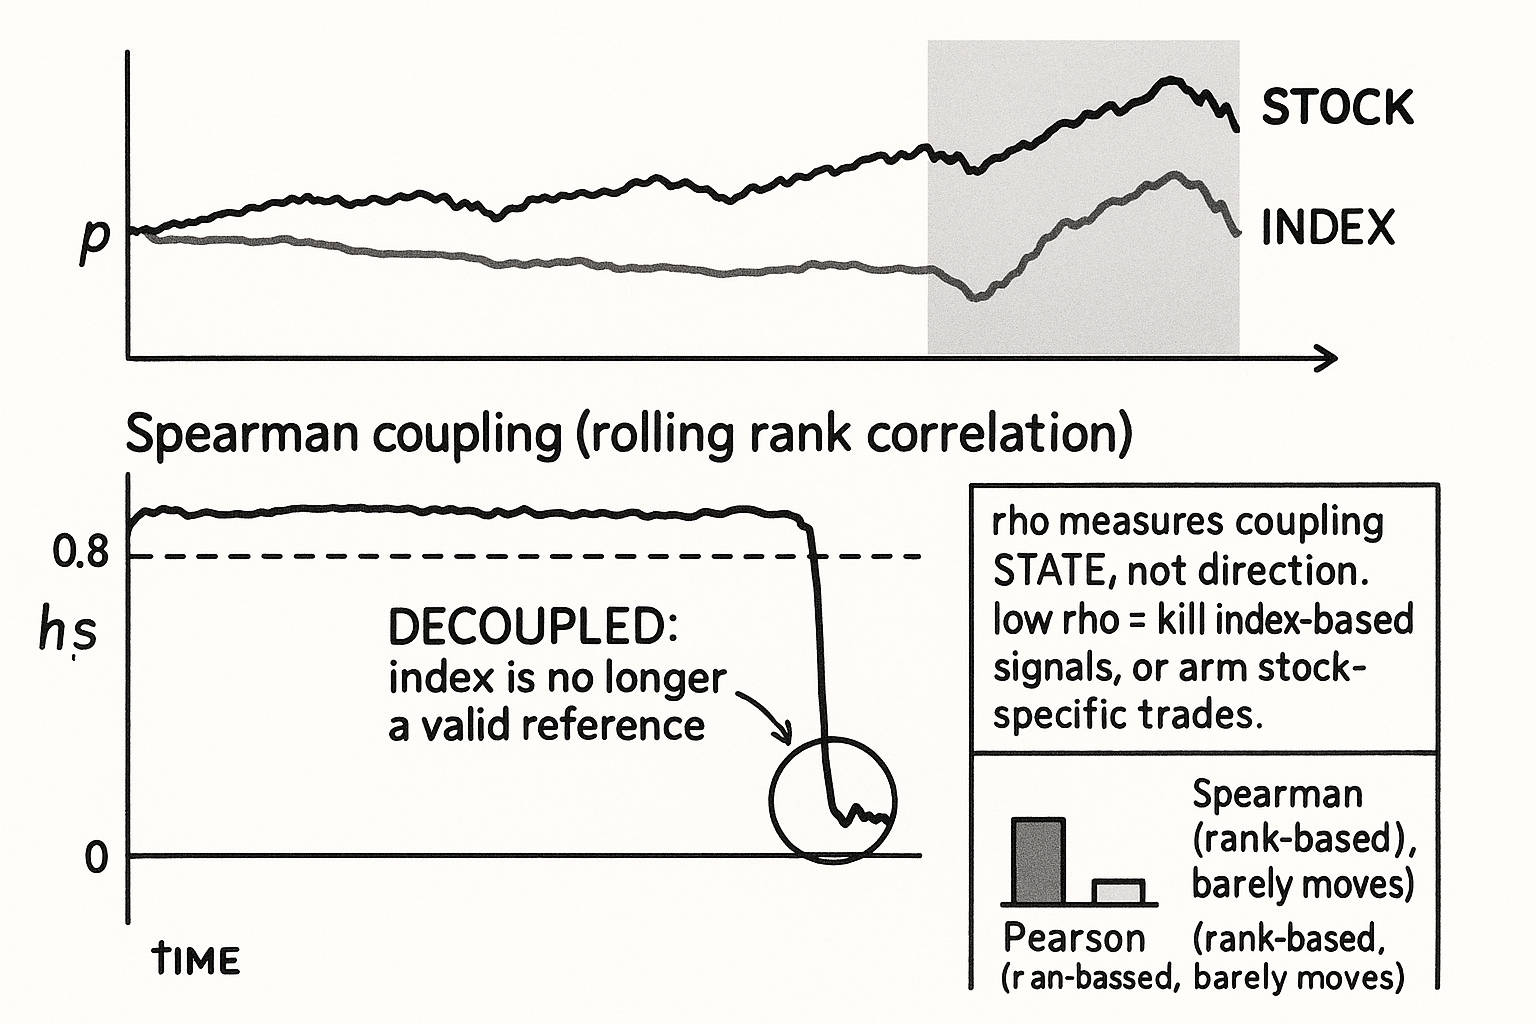
The level of rho is the coupling state. A large-cap that normally rides the index sits at a high baseline, often 0.7 to 0.9 over a two- or three-month window. The signal is not the absolute number, it is the departure from that stock's own baseline. When rho slides from 0.85 toward 0.2, the stock has stopped taking its orders from the market and started trading on something idiosyncratic, an acquisition rumor, a guidance cut, a sector rotation that singled it out. When rho goes negative, the stock is fighting the tape, which is rare and usually news-driven.
This is a regime flag, not a direction signal, and conflating the two is the standard way to lose money with it. Spearman coupling says nothing about whether the stock goes up or down. It says whether the index is still a valid reference for this stock today. That distinction drives two honest uses. The first is as a kill switch for any index-based model: if you trade the stock using the index as a lead or a hedge or a beta-neutral leg, a collapsed rho means the assumption underneath that model just expired, so suppress those signals until coupling returns. The old article "Intermarket Divergence as a Trading Filter" built exactly this caution case, where a broken relationship is a reason to stand down rather than a reason to act. The second use is the opposite posture for a different strategy: a decoupling event is the entry condition for stock-specific, event-driven trades, because the stock has announced that it is now moving on its own information.
Building it without lying to yourself
The computation is a rolling Spearman of log returns, with the window ending at the current bar so nothing leaks from the future. Resist the temptation to rank the returns once over the whole history and roll a Pearson on those global ranks, because that smuggles in look-ahead: a day's global rank depends on days that have not happened yet. Rank inside each window instead.
import numpy as np
import pandas as pd
from scipy.stats import spearmanr


def spearman_coupling(member: pd.Series, index: pd.Series, lookback: int = 60) -> pd.Series:
    rm = np.log(member).diff()
    ri = np.log(index).diff()
    out = pd.Series(np.nan, index=member.index)
    for t in range(lookback, len(member)):
        wm = rm.iloc[t - lookback + 1 : t + 1]
        wi = ri.iloc[t - lookback + 1 : t + 1]
        out.iloc[t] = spearmanr(wm, wi).correlation
    return out


def decoupling_flag(rho: pd.Series, baseline_window: int = 250, drop: float = 0.3) -> pd.Series:
    baseline = rho.rolling(baseline_window).median()
    return (rho < baseline - drop).astype(int)
The first function returns the coupling line. The second turns it into a flag by comparing today's rho to a slow median baseline, the stock's own normal, computed with the median rather than the mean for the same outlier reason the rest of this pillar keeps returning to. A flag fires when coupling drops a fixed amount below baseline. Both numbers, the lookback and the drop threshold, are arbitrary dials, and you should treat them as such: the lookback sets how fast the coupling estimate reacts versus how noisy it is, and the drop threshold trades false alarms against missed decouplings. Neither has a correct value, only a value you have tested on your instrument.
The limits worth stating out loud
Rank correlation buys robustness by discarding magnitude, and that is also its blind spot. A stock can stay perfectly rank-coupled to the index while its volatility doubles, because order is preserved even as amplitudes blow out, so Spearman alone will not catch a pure volatility-regime shift. Pair it with a separate volatility measure if that case matters to you. The estimate is also noisy on short windows, and a short window is exactly what you want for catching a fast decoupling, so you sit on the same lag-versus-noise frontier every rolling statistic lives on. Coupling can revert as fast as it broke, since the news that decoupled the stock gets digested and the index reasserts itself, which means a decoupling flag is a short-lived state, not a trend to ride. And the relationship is built on the assumption that this index is the stock's real reference, so a member that has quietly migrated to a different driver, a semiconductor name that now tracks an industry ETF more than the broad market, will show a misleadingly low baseline that is structure, not signal. Measure the coupling against the reference that actually matters, and recheck which reference that is.
KEY POINTS
- A stock's coupling to its index is a regime variable, not a constant. It loosens on earnings, breaks on company-specific shocks, and rarely inverts, and you can measure it directly rather than reading it off a chart.
- Use Spearman rank correlation, not Pearson. Ranks cap the leverage of any single outlier, so a 12-sigma earnings gap barely moves rho while it collapses a Pearson estimate, the heavy-tail problem from the old article "Why the Median Often Beats the Mean in Trading Features."
- Rho is the coupling state, never a direction. Track its departure from the stock's own baseline, not its absolute level: a slide from 0.85 toward 0.2 means the index has stopped being a valid reference for this stock.
- Two honest uses, opposite in posture: kill index-based signals when coupling collapses (the caution case from the old article "Intermarket Divergence as a Trading Filter"), or arm stock-specific event trades because the stock now moves on its own information.
- Compute it as a rolling Spearman with the window ending on the current bar, ranking inside each window. Ranking once over all history leaks the future.
- It discards magnitude, so it misses pure volatility-regime shifts, is noisy on the short windows that catch fast decouplings, reverts quickly, and assumes the chosen index is the stock's true reference. Verify that reference and pair rho with a volatility measure.
References
- Statistically Sound Indicators for Financial Market Prediction - Timothy Masters (Amazon)
- Spearman's rank correlation coefficient (Wikipedia)
- scipy.stats.spearmanr documentation
- Robust statistics: breakdown point (Wikipedia)
- Pearson vs Spearman correlation (PMC, Schober et al.)
- Trading Systems and Methods - Perry Kaufman (Amazon)
- Cybernetic Trading Strategies - Murray Ruggiero (Amazon)
- The Art of Currency Trading - Brent Donnelly (Amazon)
- Construction of Minimum Spanning Trees from Financial Returns using Rank Correlation
- Testing for financial contagion based on a nonparametric measure of comovement
- Measuring rank correlation coefficients between financial time series: A GARCH-copula based sequence alignment algorithm
- Novel indexes based on network structure to indicate financial market
- Nonparametric correlation models for portfolio allocation
- Empirical Models of Market Microstructure
- A Selective Overview of Nonparametric Methods in Financial Econometrics
- Parametric and Nonparametric Models and Methods in Financial Econometrics