4.54 Order Statistics Across Markets: Median and Range as Breadth
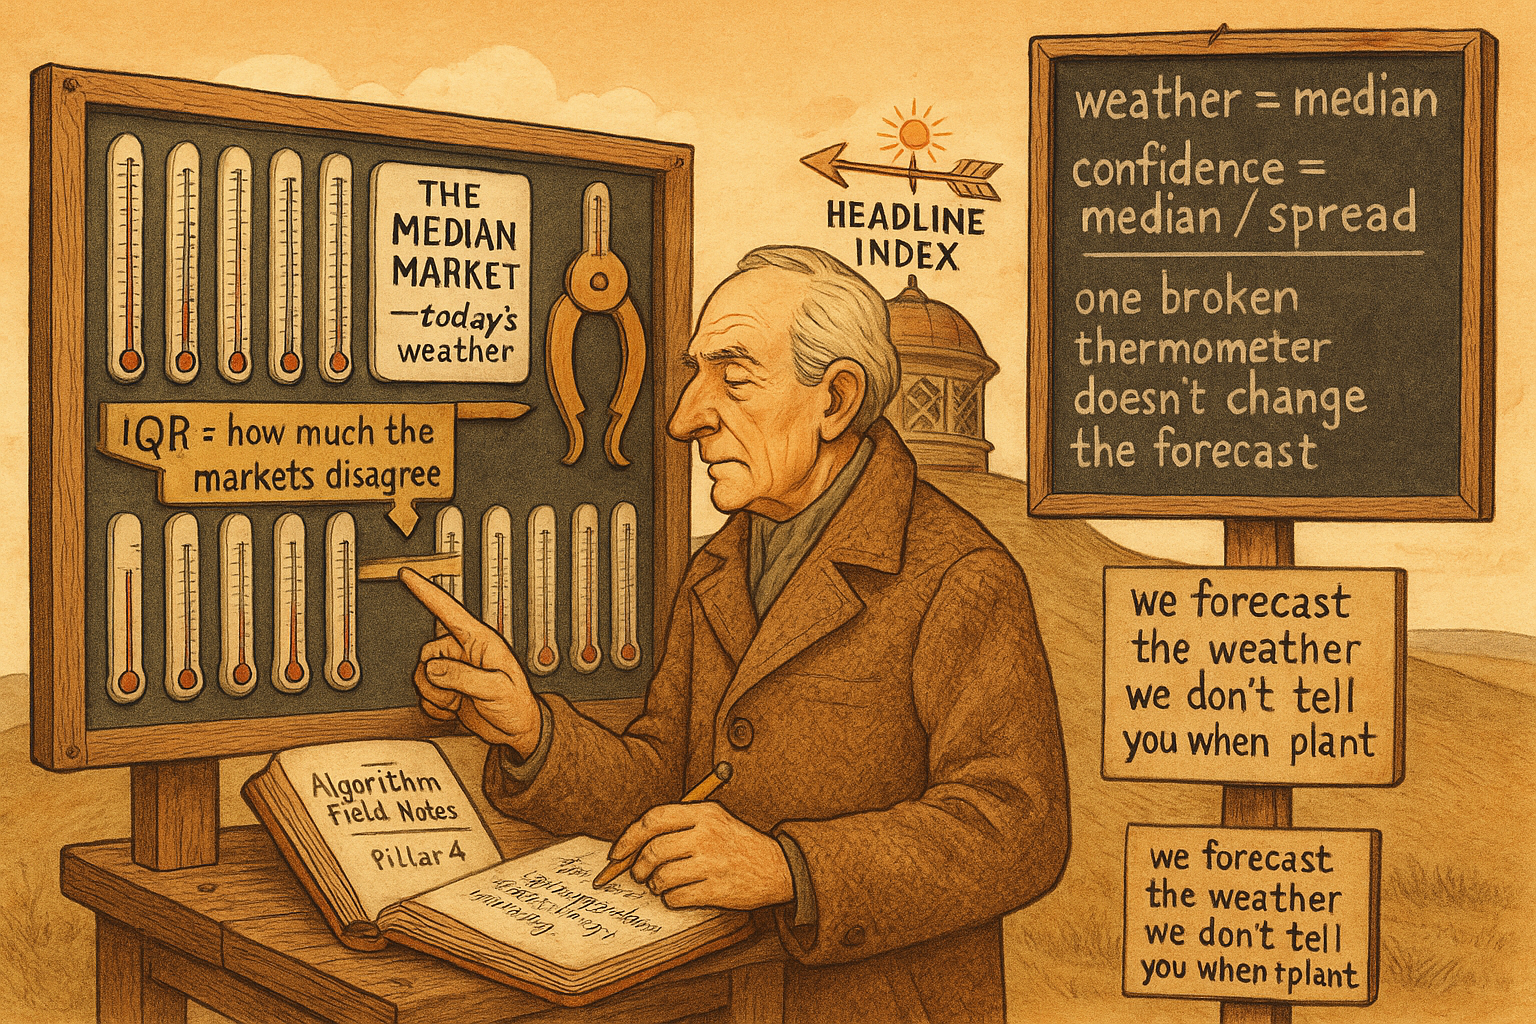
Compute one indicator across a universe and summarize the cloud with order statistics: median is the market state, median over IQR is a non-parametric breadth z-score. Outlier-proof regime weather, not a trigger.
The old article "Cross-Sectional Percentile Rank Within a Universe" asked where one market sits in the pack. This asks a different question about the same panel: what is the pack itself doing? Take an indicator computed identically across every market in a universe, and on each bar you have a cloud of values, one per market. Summarize that cloud with order statistics, the numbers you get by sorting the values and reading off positions, and you have a breadth gauge: a measure of the general market state and how tightly or loosely the markets agree. The median of the cloud is the state. The spread of the cloud is the dispersion. Both come straight out of sorting, no model required.
The choice of order statistics over the obvious alternatives is the same argument the old article "Why the Median Often Beats the Mean in Trading Features" made. A mean across markets and a standard deviation across markets are both wrecked by one berserk member, and in a panel of markets you will have a berserk member, a single name gapping on a buyout or a halt. The median and the interquartile range do not care. One market doing something insane shifts the median by at most one slot and barely touches the IQR, so the breadth reading reflects the group, not the loudest outlier in it.
Median of the cloud is the market state
Compute a stationary trend indicator for every market, the same recipe everywhere. The natural primitive is the CMMA, the close minus a moving average normalized by volatility, from the old article "CMMA: A Better Momentum Primitive Than Price-minus-MA Alone," because it is already comparable across instruments. On each bar you have M of these values. Take their median.
$$ \text{State}_t = \operatorname{median}\big(\,\text{CMMA}_t(1),\, \text{CMMA}_t(2),\, \ldots,\, \text{CMMA}_t(M)\,\big) $$
The median CMMA is the trend of the typical market. Positive means more than half the universe is above its own moving average, a broad uptrend. Negative means the typical market is below, a broad downtrend. Near zero means the universe is split. This is breadth in the honest sense, not a cap-weighted index that two giant names can drag around, but the experience of the median market, which is closer to what a diversified book actually feels. A worked read: across 30 markets the median CMMA sits at +0.8 in a healthy trend, then over two weeks slides to -0.3 while the headline index is still green, because the index is being held up by a handful of leaders while the median market has already rolled over. That divergence, breadth deteriorating under a rising index, is the classic warning the median catches and the index hides.
Median over IQR is a non-parametric breadth z-score
The state alone is half the picture. A median CMMA of +0.8 means something different when every market is clustered near +0.8 than when the markets are scattered from -3 to +5 and +0.8 is just the midpoint of chaos. Measure the scatter with the interquartile range, the distance from the 25th to the 75th percentile of the cloud, the robust cousin of standard deviation. Then divide the state by it.
$$ \text{Breadth}_t = \frac{\operatorname{median}_t}{\text{IQR}_t}, \qquad \text{IQR}_t = Q_{75,t} - Q_{25,t} $$
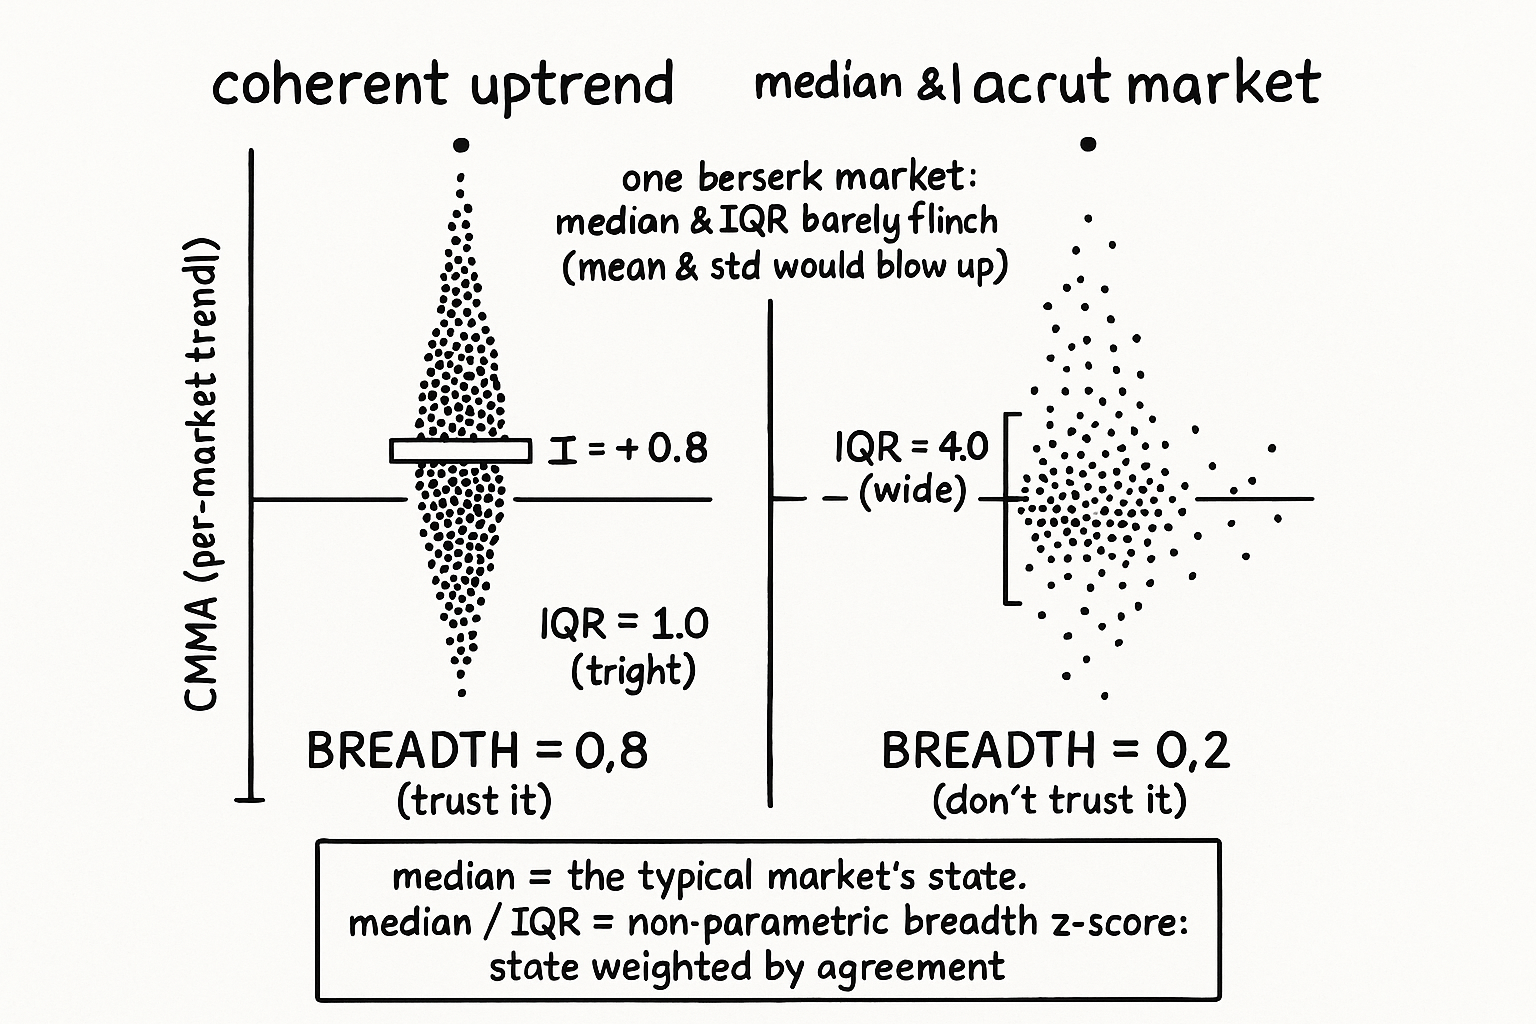
The IQR is the width of the middle half of the universe, the typical spread among markets, and dividing the median by it builds a non-parametric z-score: how far the typical market has departed from neutral, measured in units of how spread out the markets normally are. A large positive Breadth means the markets are not only mostly up but tightly agreed about it, a coherent broad trend. A small Breadth, even with a positive median, means the agreement is weak and the trend is a wide disagreement that happens to lean up. The construction exaggerates the readings that matter, a unified market, and damps the readings that do not, a market pulling in every direction at once, exactly the behavior you want from a regime gauge. Because it is built from order statistics it carries the outlier immunity of the median straight through to the dispersion term, where a standard z-score would have its denominator blown out by the same outlier that spares the median.
A number to anchor it. Median CMMA +0.8, IQR 1.0, Breadth 0.8, a solid coherent uptrend. Same median +0.8 but the universe has fractured and IQR widens to 4.0, Breadth drops to 0.2, and the gauge correctly reports that the broad up-lean is not to be trusted because the markets are all over the place. Same state, opposite confidence, decided by dispersion.
Building the breadth panel
Lay the per-market indicator out as a DataFrame, one column per market, then collapse across columns on each bar with the robust order statistics. Every operation is a row-wise quantile, so it uses only the markets' values on that bar, and the only history involved is inside the per-market CMMA window. No look-ahead, no cap weighting, no single market dominating.
import numpy as np
import pandas as pd


def cmma(prices: pd.DataFrame, ma_window: int = 20, atr_window: int = 20) -> pd.DataFrame:
    logp = np.log(prices)
    ma = logp.rolling(ma_window).mean()
    vol = logp.diff().rolling(atr_window).std()
    return (logp - ma) / (vol * np.sqrt(ma_window))


def market_breadth(prices: pd.DataFrame, ma_window: int = 20) -> pd.DataFrame:
    c = cmma(prices, ma_window)
    state = c.median(axis=1)
    iqr = c.quantile(0.75, axis=1) - c.quantile(0.25, axis=1)
    breadth = state / iqr.replace(0, np.nan)
    return pd.DataFrame({"state": state, "iqr": iqr, "breadth": breadth})
The CMMA function normalizes each market's distance from its own moving average by its own volatility, scaled by the square root of the window so the value does not grow with lookback, which is what makes the per-market values comparable enough to pool. The breadth function then reports three lines: the median state, the IQR dispersion, and the non-parametric z-score that combines them. Use the state as a market-regime variable, gating or sizing the rest of your book, and use the breadth z-score as the confidence weight on that state.
What it is and what it is not
This is a regime and confidence gauge, not a timing trigger, and the line between those is where people misuse it. The median state tells you the broad posture of the universe, which is exactly the absolute regime filter the old article "Cross-Sectional Percentile Rank Within a Universe" said you needed to pair with a relative ranking, because a 90th-percentile market in a collapsing universe is still inside a collapsing universe. Run the two together: percentile rank picks which markets, breadth state tells you whether the universe as a whole is worth being long at all. The honest limits are the usual ones. The universe definition decides everything, and a survivorship-biased or mismatched basket produces a breadth reading about a fiction. The breadth gauge lags by exactly the CMMA window underneath it, so it confirms regimes rather than calling tops, and treating a breadth rollover as a precise sell signal will have you late every time. Order statistics are robust but coarse, the median ignores how far above zero the leaders are and the IQR ignores the tails entirely, so a market with healthy breadth can still carry concentrated tail risk in a few names the gauge cannot see. And like everything cross-sectional it is silent on direction conviction for any single instrument; it describes the forest, and you still need the per-market work to choose the trees. Use it to set the weather, not to place the trade.
KEY POINTS
- Compute one stationary indicator (CMMA is the natural primitive) identically across a universe, and on each bar summarize the cloud of values with order statistics: the median is the market state, the spread is the dispersion. No model, just sorting.
- Use median and IQR, not mean and standard deviation, because one berserk market wrecks the mean and inflates the standard deviation while barely moving the robust pair, the outlier argument from the old article "Why the Median Often Beats the Mean in Trading Features."
- Median CMMA is honest breadth: the trend of the typical market, not a cap-weighted index two giants can drag. Watch for the median rolling over while the headline index still rises, the classic breadth-deterioration warning.
- Divide median by IQR for a non-parametric breadth z-score: the typical market's departure from neutral measured in units of how spread out markets normally are. It exaggerates coherent moves and damps fractured ones. Same state, opposite confidence, decided by dispersion.
- Build it as row-wise quantiles across a panel, no look-ahead and no cap weighting. Report state, IQR, and breadth as three lines.
- It is a regime and confidence gauge, not a trigger. Pair the state with the cross-sectional percentile rank from the old article "Cross-Sectional Percentile Rank Within a Universe" so you know whether the universe is worth being long at all. It lags by the CMMA window, depends on an honest universe, and is coarse to the tails.
References
- Statistically Sound Indicators for Financial Market Prediction - Timothy Masters (Amazon)
- Order statistic (Wikipedia)
- Interquartile range (Wikipedia)
- Market breadth (Wikipedia)
- pandas.DataFrame.quantile documentation
- Trading Systems and Methods - Perry Kaufman (Amazon)
- Cybernetic Trading Strategies - Murray Ruggiero (Amazon)
- The Art of Currency Trading - Brent Donnelly (Amazon)
- High Frequency Market Microstructure Noise Estimates and Liquidity Measures
- Microstructure Order Flow: Statistical and Economic Evaluation of Nonlinear Forecasts
- Lead-Lag Relationships in Market Microstructure
- High-Frequency Market Microstructure (Digest Summary)
- Dynamic Momentum Strategies: Return Dispersion and Predictability
- Cross-Sectional Alpha Dispersion and Performance Evaluation
- Option-Implied Belief Dispersion and Economic Uncertainty
- Is Decentralized Always Better? How Market Structure Affects Trading in Cryptocurrency Markets