4.53 Cross-Sectional Percentile Rank Within a Universe
Rank a market's trend against its peers instead of reading it on an absolute scale. The percentile is comparable across instruments, robust by construction, silent on sizing, and only as good as the universe.

The old article "Ranking Beats Forecasting for Many Trading Problems" made the case from the portfolio side: for selecting among instruments you do not need to predict returns, you need to order instruments, because the order survives the miscalibration that wrecks point forecasts. This builds the same idea from the indicator side. Instead of asking what a single market is doing on its own absolute scale, ask where it sits among its peers right now. The output is a percentile, a number from 0 to 100 that says how this market's trend ranks against the universe it belongs to, and that number is comparable across instruments in a way a raw indicator never is.
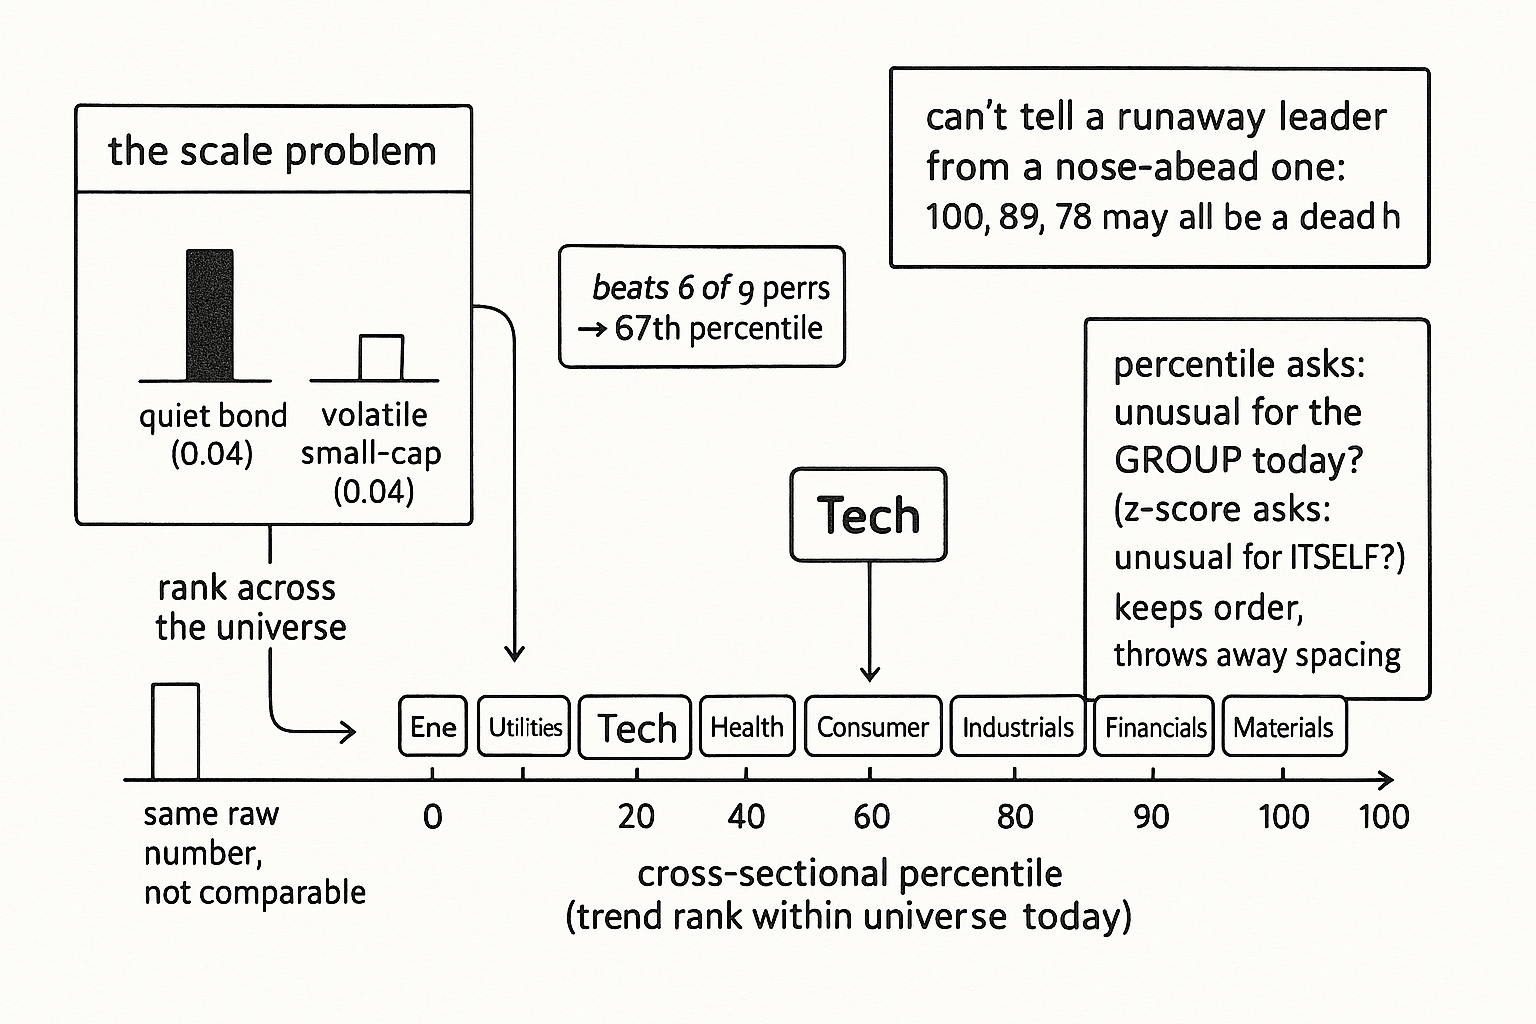
The motivation is the scale problem the old article "Why Z-Scoring Makes Ranking Cleaner" diagnosed. A raw trend reading of 0.04 means one thing on a quiet bond future and something else entirely on a volatile small-cap, so sorting raw values lets the loudest instruments dominate for no reason but their volatility. Percentile rank dissolves the problem by construction. Every market's score becomes its position in the line, 0 for the weakest trend in the universe, 100 for the strongest, and a market at the 90th percentile is at the 90th percentile whether it is gold or a penny stock.
Pick a per-market property, then rank it across the universe
The recipe has two stages. First compute one number per market that captures the property you care about, on each bar. The natural choice is a normalized linear trend over a short window, the slope of a line fit through recent prices, scaled by volatility so it is comparable in spirit before ranking even starts. Any stationary per-market indicator works here, a CMMA, a momentum, an efficiency ratio, the percentile machinery does not care what you feed it as long as it is the same recipe for every market. Second, on each bar, line up that property across all markets in the universe and find where the market of interest falls.
$$ \text{Percentile}_t(m) = 100 \times \frac{\#\{\,j : v_t(j) < v_t(m)\,\}}{M - 1} $$
Read it directly. The term v_t(m) is the property, say the normalized trend, of the market m you care about on bar t, and v_t(j) runs over all M markets in the universe on that same bar. Count how many peers have a strictly smaller value than your market, divide by the M minus one other markets, and scale to 100. A market stronger than 90 percent of its peers lands near 90. A market in the middle of the pack lands near 50. The denominator uses M minus one so the strongest market hits 100 and the weakest hits 0, the full range. Ties get handled by averaging their ranks, the standard convention, so two markets with identical trend share the percentile slot between them.
A worked case. Ten sector ETFs, and you compute each one's 20-day normalized trend on today's bar. Energy reads strongest, financials weakest, and the tech ETF you are tracking beats six of the other nine. Its percentile is 100 times six over nine, about 67, so tech is trending in the upper third of the sector board today. Tomorrow energy fades and tech now beats eight of nine, percentile jumps to 89. The absolute trend value moved too, but the percentile tells you the thing you actually want for cross-sectional work: tech climbed the leaderboard.
Why the cross-section is doing the normalizing
Notice what the ranking step replaced. A z-score, from the old article "Why Z-Scoring Makes Ranking Cleaner," normalizes a market against its own history, subtracting a trailing mean and dividing by a trailing standard deviation, so a +2 means two of this market's own standard deviations. Percentile rank normalizes against the contemporaneous cross-section instead, so a 90 means stronger than 90 percent of the peer group today. The two answer different questions. The z-score asks whether this market is unusual for itself; the percentile asks whether it is unusual for the group right now. For rotation strategies, longing the strongest names and shorting the weakest, the cross-sectional question is the one that pays, because you are choosing between instruments on the same bar, not deciding whether one instrument is having a strange day.
Percentile rank is also the most aggressive normalizer available, and that cuts both ways. It throws away magnitude entirely, keeping only order, so it is maximally robust to outliers and scale, a berserk reading just becomes rank M and stops there, the same outlier immunity the rank approach bought in the old article "Why the Median Often Beats the Mean in Trading Features." The cost is that it cannot tell a runaway leader from a market barely ahead of the pack. If the top three sectors are in a dead heat and the fourth is far behind, the percentiles still read 100, 89, 78, 67, evenly spaced, hiding the cluster at the top. Pure rank discards exactly the spacing that a z-score keeps. The old article "Why Z-Scoring Makes Ranking Cleaner" argued you fall back to pure rank only when magnitudes are too unreliable to trust; percentile rank is that fallback, chosen deliberately when you want robustness over resolution.
Building it across a panel
With a panel of markets in a DataFrame, one column per market, compute the per-market property column by column, then rank across columns on each bar. The cross-sectional rank is a single pandas call, and because each bar ranks only the values known on that bar, there is no look-ahead from the ranking step itself; the only history used is inside the per-market trend window.
import numpy as np
import pandas as pd


def normalized_trend(prices: pd.DataFrame, window: int = 20) -> pd.DataFrame:
    # slope of a line fit through log prices, scaled by return volatility
    logp = np.log(prices)
    x = np.arange(window)
    xc = x - x.mean()
    denom = (xc ** 2).sum()
    slope = logp.rolling(window).apply(lambda y: np.dot(xc, y - y.mean()) / denom, raw=True)
    vol = np.log(prices).diff().rolling(window).std()
    return slope / vol


def cross_sectional_percentile(prices: pd.DataFrame, window: int = 20) -> pd.DataFrame:
    trend = normalized_trend(prices, window)
    # rank each row (bar) across markets, scale to 0..100
    return trend.rank(axis=1, pct=True) * 100.0
The first function turns each market's price history into a volatility-scaled trend, the per-market property. The second ranks that property across the universe on every bar and scales to a percentile. The output is a panel of the same shape, every cell a 0-to-100 standing of that market against its peers on that bar, ready to drive a rotation rule: long the cells above some high percentile, short the cells below some low one, the indicator-side feed for the ranked long/short machinery the portfolio articles built.
The honest caveats
Percentile rank inherits every limit of ranking and adds one of its own. It says nothing about how hard to bet. A market at the 95th percentile might be a screaming standout or a hair ahead of the 94th, and the percentile cannot tell you, so the old article "Ranking Beats Forecasting for Many Trading Problems" was right that ranking solves selection and is silent on sizing; you still need a separate volatility-based sizing layer downstream. The universe definition is a real choice that the math hides: a market is only as meaningful as the peer group you rank it against, and a badly chosen universe, mixing instruments that do not belong together or quietly dropping survivors, produces confident percentiles about a meaningless comparison. The per-market property has its own lookback, an arbitrary dial trading reactivity against noise, and the percentile is only as good as that underlying number, so garbage trend in means garbage rank out. And the whole thing is relative, which means in a universe where everything is falling, the 90th-percentile market is the best of a bad lot, not a long, so the cross-section tells you who is winning the race without telling you whether the race is worth running. Pair it with an absolute trend or regime filter if that distinction matters to your strategy.
KEY POINTS
- Instead of reading a single market's indicator on its own absolute scale, rank that indicator across the universe and report a 0-to-100 percentile. The percentile is comparable across instruments in a way a raw reading never is.
- Two stages: compute one stationary per-market property on each bar (a volatility-scaled linear trend is the natural choice), then on each bar count how many peers it beats and scale to 100.
- Percentile rank normalizes against the contemporaneous cross-section, answering "unusual for the group today?", while a z-score normalizes against a market's own history, answering "unusual for itself?". For rotation, the cross-sectional question is the one that pays.
- It is the most aggressive normalizer: maximally robust to scale and outliers because it keeps only order, at the cost of discarding spacing, so it cannot tell a runaway leader from one barely ahead. It is the pure-rank fallback from the old article "Why Z-Scoring Makes Ranking Cleaner," chosen when you want robustness over resolution.
- Compute it on a panel by ranking each bar across markets (pandas rank with pct), with no look-ahead from the ranking step. Feed the result to a ranked long/short rule.
- It is silent on sizing (pair with volatility-based sizing), depends entirely on an honestly built universe, inherits its lookback's reactivity-versus-noise tradeoff, and is purely relative, so in a falling universe the top percentile is the best of a bad lot, not a long. Gate it with an absolute regime filter if that matters.
References
- Statistically Sound Indicators for Financial Market Prediction - Timothy Masters (Amazon)
- Systematic Trading - Robert Carver (Amazon)
- Percentile rank (Wikipedia)
- pandas.DataFrame.rank documentation
- Cross-sectional momentum (AQR, Asness Moskowitz Pedersen, "Value and Momentum Everywhere")
- Trading Systems and Methods - Perry Kaufman (Amazon)
- Cybernetic Trading Strategies - Murray Ruggiero (Amazon)
- The Art of Currency Trading - Brent Donnelly (Amazon)
- Design Choices, Machine Learning, and the Cross-Section of Stock Returns
- A Deep Multi-Factor Framework for Cross-Sectional Stock Return Prediction
- Deeply Equal-Weighted Subset Portfolios
- Quantum Stochastic Walks for Portfolio Optimization
- High Frequency Market Microstructure Noise Estimates and Liquidity Measures
- TradeFM: A Generative Foundation Model for Trade-flow and Market Microstructure
- Lead-Lag Relationships in Market Microstructure
- Skewness Dispersion and Stock Market ReturnsThe support ... - arXiv