2.56 Reading Reversals from Autocorrelation
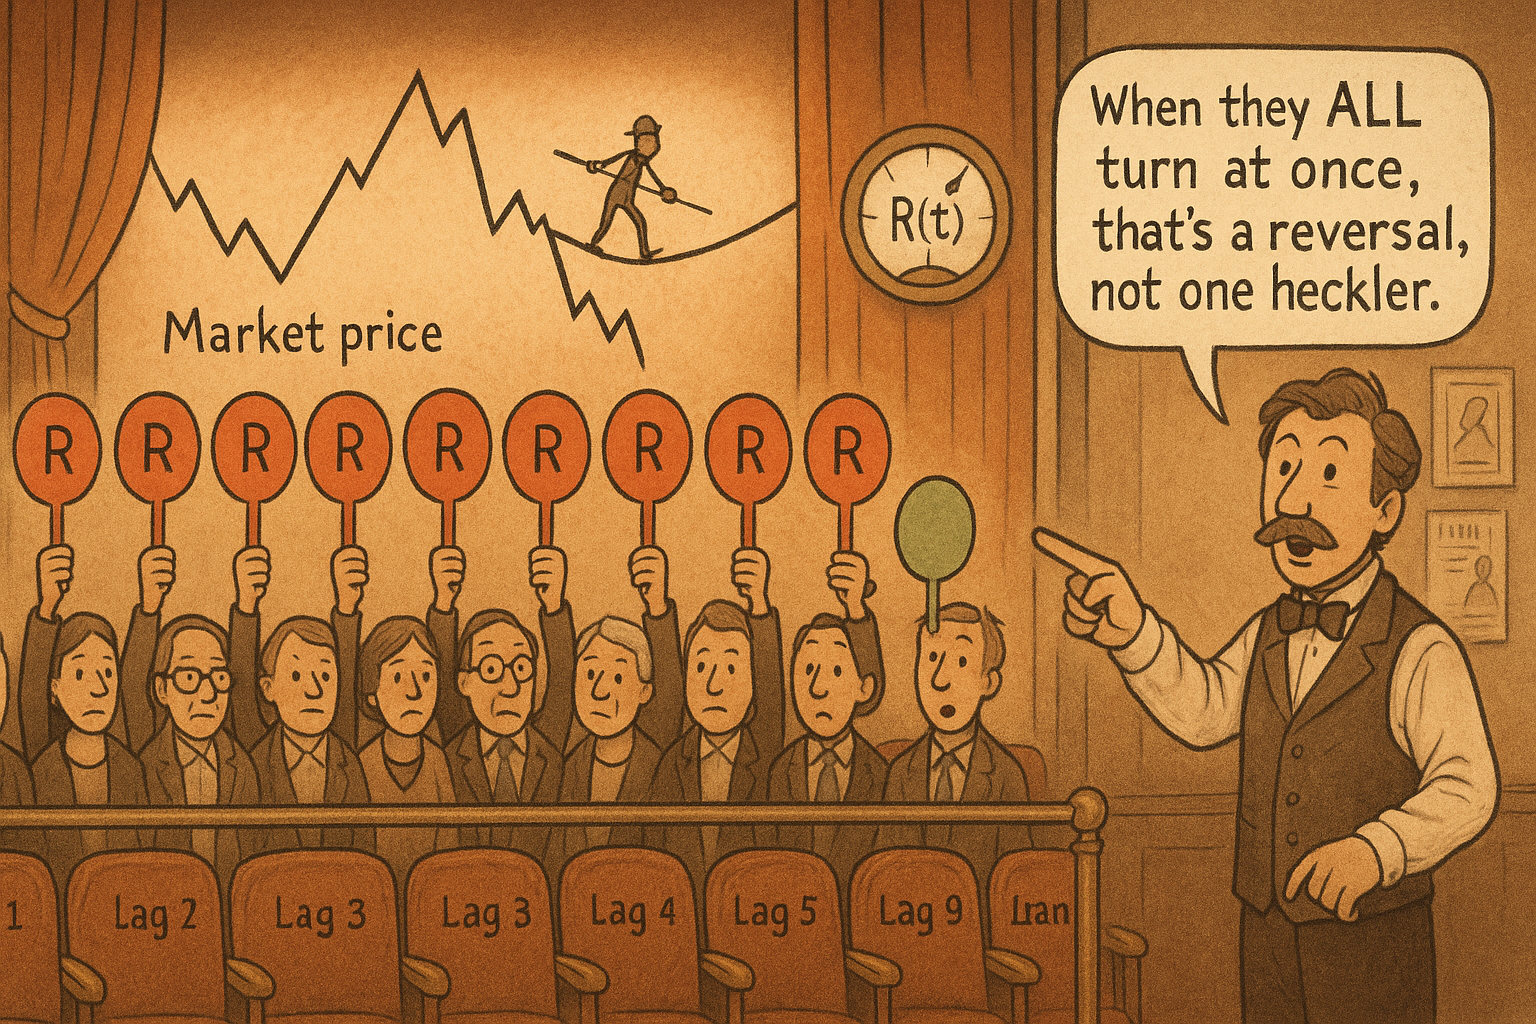
At a real reversal the autocorrelation flips at every lag at once, not just one. Sum the bar-to-bar changes across all lags and the spike flags the turn, no cycle period required.
The old article "The Autocorrelation Periodogram" used autocorrelation to answer one question: what is the dominant cycle period right now. The same autocorrelation data answers a second question for free, and it is the one traders actually care about: did the market just turn. The old article "Why Market Cycles Are Evanescent" warned that the dominant period drifts and a cycle you measured may already be gone, which makes a turn detector that does not depend on knowing the period valuable. Autocorrelation gives you exactly that.
A reversal moves the correlation at every lag at once
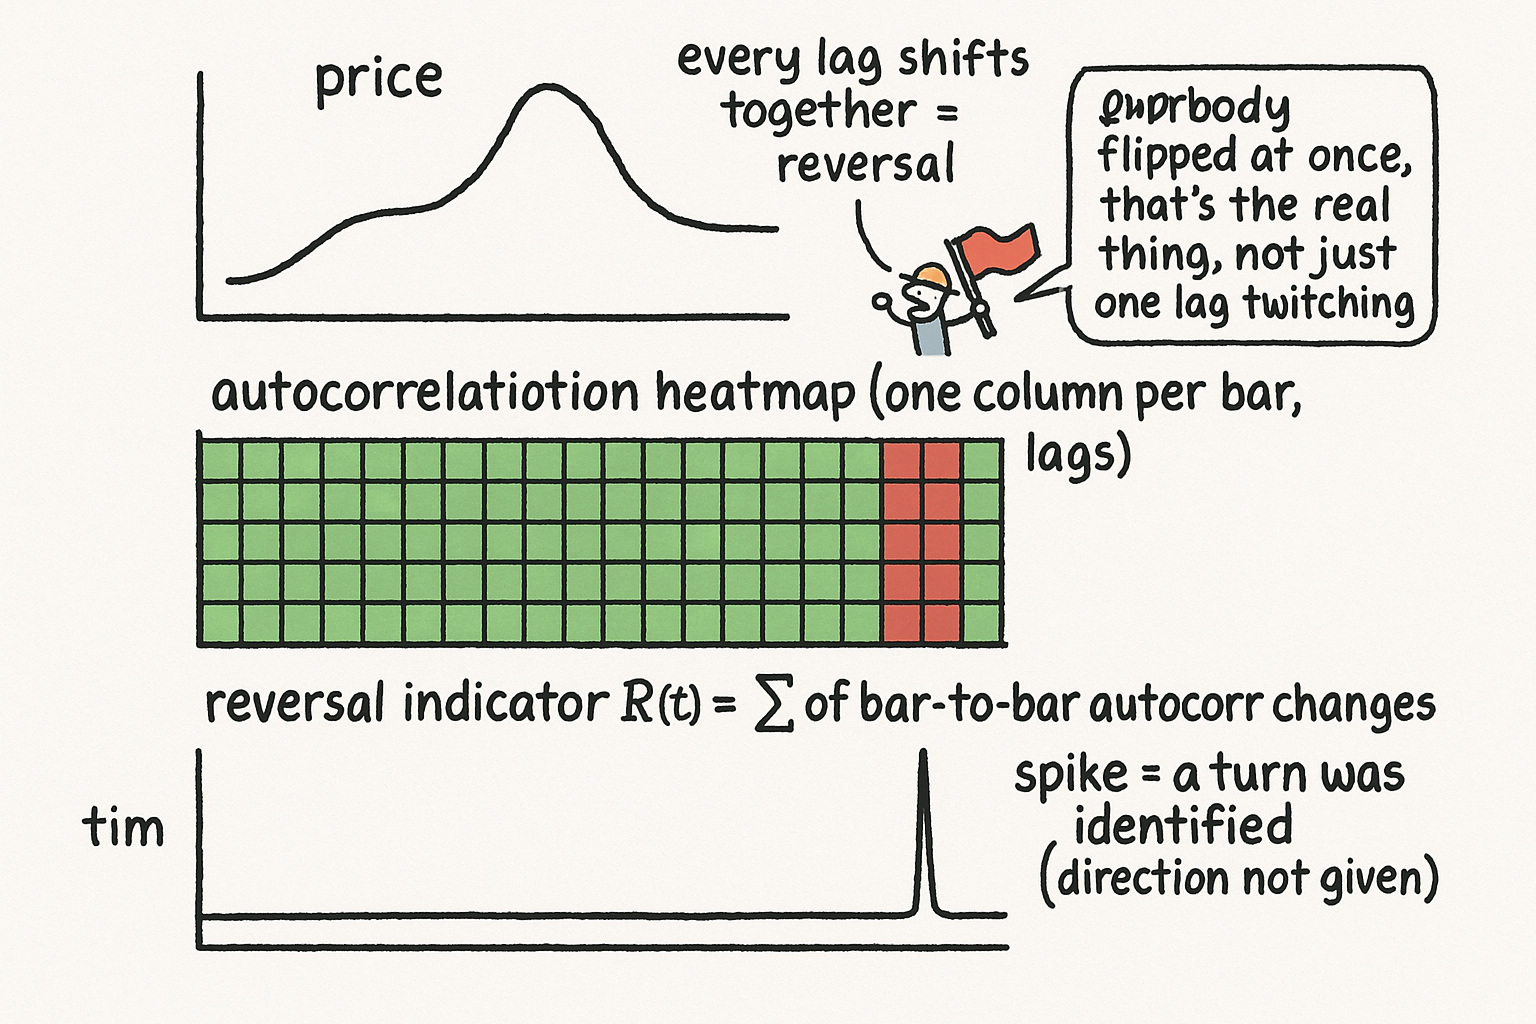
Picture the autocorrelation function as a row of readings, one per lag: the correlation of price with itself one bar back, two bars back, on out to some maximum lag. Plot it as a colored strip, green where correlation is high, red where it is low, and stack a new strip every bar. While the market grinds along in a stable cycle, the strip barely changes from bar to bar; the correlation at each lag holds roughly steady because the relationship between now and the recent past is stable. At a genuine cyclic reversal, the relationship between now and the past inverts, and the autocorrelation shifts at every lag simultaneously, the whole strip flips from green to red across all values of lag at once. That synchronized flip across the entire lag spectrum is the fingerprint of a turn, and it is far harder to fake than any single-lag wiggle.
This is why the method is robust. A change at one lag could be noise. A coordinated change at every lag at the same bar is structural, the signature of the underlying relationship reorganizing rather than one correlation reading jittering.
Sum the bar-to-bar changes across all lags
Turn that observation into a number. For each lag, take the absolute change in its autocorrelation from the previous bar to this one. Then sum those changes across all lags into a single reversal indicator.
$$ R(t) \;=\; \sum_{\text{lag}} \left| \,\text{AutoCorr}(\text{lag},\, t) \;-\; \text{AutoCorr}(\text{lag},\, t-1)\, \right| $$
Read it piece by piece. The inner term is how much the correlation at one lag moved from yesterday to today; the absolute value keeps a rise and a fall from cancelling; the sum adds up that movement over every lag. When the market is holding its structure, each lag barely moves, the terms are small, and R(t) stays low. When the market reverses, every lag jumps together, the terms pile up in the same direction of magnitude, and R(t) spikes. So a large value of R(t) flags that a turning point has been identified, without R(t) ever needing to know what the cycle period is.
What it does and does not tell you
The strength of this indicator is precisely that it is period-agnostic. The old dominant-cycle and evanescent-cycles articles both ran into the same wall: to trade a cycle you usually need its period, and the period keeps drifting. The autocorrelation reversal indicator steps around that wall because the synchronized flip happens at a turn regardless of which period the market was running, so it keeps working through the regime changes that break a period-locked strategy. It is a clean companion to the periodogram: the periodogram tells you whether a tradeable cycle exists and how long it is, while the reversal indicator tells you when that cycle is rolling over.
The limits are the usual ones, stated honestly. R(t) detects that a turn has occurred, it does not tell you the direction, so it is a timing alarm that still needs a directional read from price or trend context to become a trade. It will fire on any large reorganization of structure, which includes the transition from cycle mode into trend mode, so a spike is not always a clean reversal to fade. And like everything built from a trailing window, it confirms a turn slightly after the fact rather than predicting it; the synchronized flip is visible once the new relationship has started forming, not before. Use it to flag that the recent structure just broke, then let the periodogram and the price context decide whether there is anything worth trading on the other side.
KEY POINTS
- The autocorrelation function is a row of correlations, one per lag; stacked bar by bar it forms a heatmap that stays stable while the market holds its structure.
- At a genuine cyclic reversal the relationship between now and the past inverts, so the autocorrelation shifts at every lag simultaneously, the whole strip flips from green to red at once, a fingerprint far harder to fake than a single-lag move.
- Quantify it by summing the absolute bar-to-bar change in autocorrelation across all lags into one indicator R(t); it stays low during stable structure and spikes at a turn.
- The method is period-agnostic, which is its main advantage: it keeps working through the period drift that breaks the cycle-locked strategies the old dominant-cycle and evanescent-cycles articles described.
- It pairs with the autocorrelation periodogram: the periodogram says whether a cycle exists and how long, the reversal indicator says when it is rolling over.
- It flags that a turn happened, not its direction, fires on any large structural reorganization including cycle-to-trend transitions, and confirms slightly after the fact rather than predicting; combine it with directional context before trading.