2.57 Adaptive Indicators: Tuning RSI to the Measured Cycle
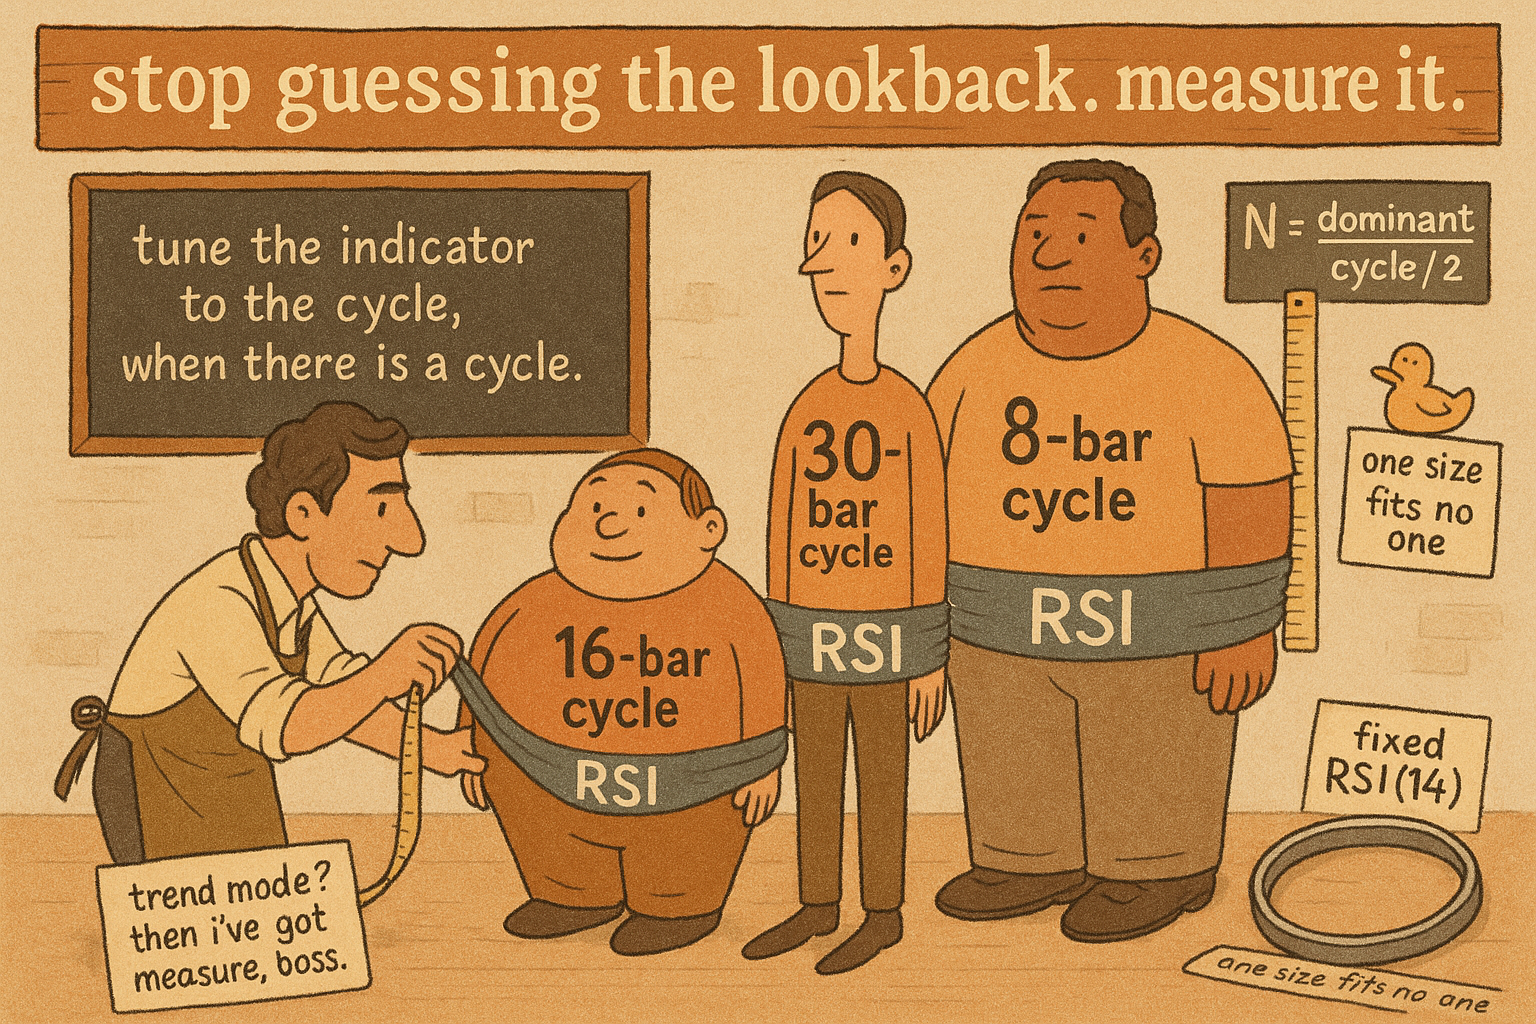
Stop hardcoding RSI(14). Set the lookback to half the measured dominant cycle, feed it a band-pass input, and recompute every bar. Tuned to a persistent cycle it can even lead, but only in cycle mode.
The RSI you trade has a fixed lookback. You picked 14 because someone printed 14 in a book in 1978, and you have used 14 on a 5-minute chart and a weekly chart and a tick chart without ever asking whether 14 bars is the right amount of history for the swing in front of you. It usually is not. A 14-bar oscillator on a market whose dominant swing runs 30 bars is half-tuned, too twitchy to catch the cycle and too slow to call its turn. The old article "Dominant Cycle Estimation Without Astrology" gave us a number for that swing, the dominant cycle period, measured from the data and updated every bar. This article does the obvious thing with it: stop guessing the lookback and let the measured cycle set it.
A fixed lookback is a bet you keep losing
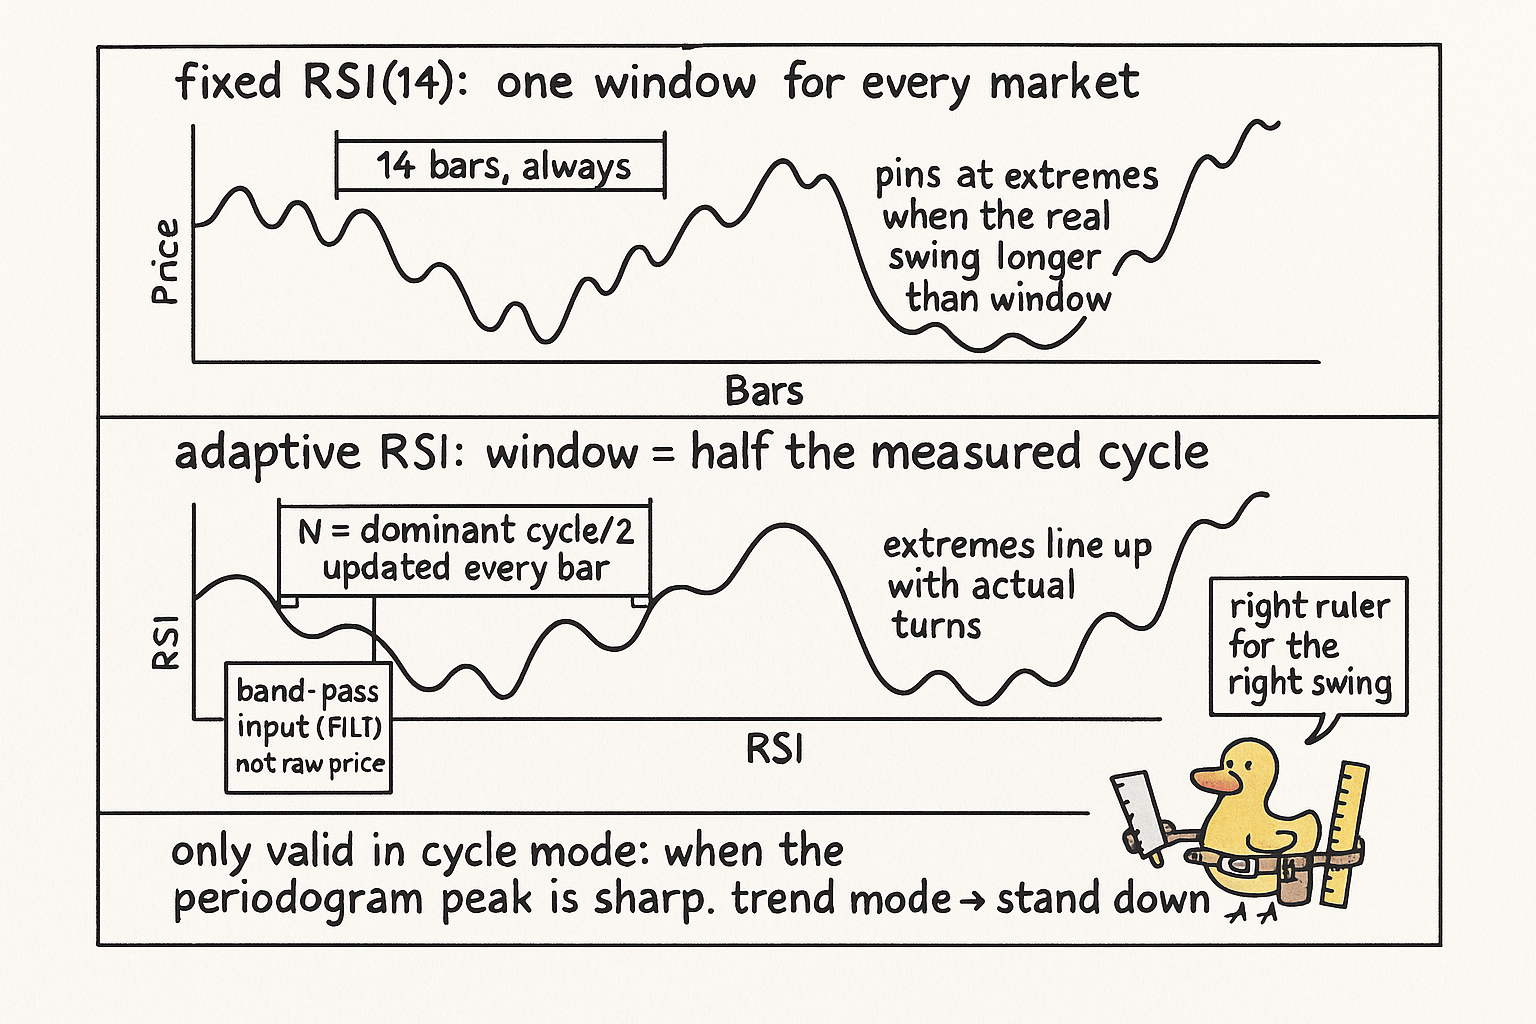
Every oscillator carries an implicit claim about how long the market's relevant memory is. RSI(14) claims 14 bars. A stochastic with a 20-bar window claims 20. When the real swing is longer than your window the oscillator pins at the extremes and chops; when the real swing is shorter your oscillator smooths it into mush and reports the turn late. The old article "Why Market Cycles Are Evanescent" is the reason this hurts: the dominant period is not a constant you can hardcode, it drifts through regimes, sitting at 22 bars for months and then collapsing to 8 in a panic. A fixed-lookback indicator is right for the brief window when its period happens to match the market and wrong the rest of the time, and it never tells you which case you are in.
The fix is to make the lookback a variable fed by the measurement. Measure the dominant cycle, set the indicator's window to it, recompute every bar. The indicator now breathes with the market: it widens its memory when swings stretch out and tightens it when they compress. The old article "Automatic Gain Control for Trading Indicators" did this for amplitude, rescaling an indicator so its swings stay readable as volatility changes. This is the same move applied to time instead of size, adapt the lookback, not the gain.
Building the adaptive RSI
Start with RSI written cleanly. Over a lookback of N bars, sum the up closes and the down closes, then take the ratio of up movement to total movement.
$$ \text{CU} = \sum_{i=1}^{N}\max(x_i - x_{i-1},\,0), \qquad \text{CD} = \sum_{i=1}^{N}\max(x_{i-1} - x_i,\,0) $$ $$ \text{RSI} = \frac{\text{CU}}{\text{CU} + \text{CD}} $$
This is the same RSI you know, written so the output runs 0 to 1 instead of 0 to 100 (multiply by 100 if you miss the old scale). CU is the total up movement over the window, CD the total down movement, and the ratio is the fraction of motion that was upward. Pinned near 1 means almost all motion was up, near 0 means almost all down.
Two changes make it adaptive. First, set the lookback to half the measured dominant cycle rather than a constant.
$$ N = \frac{\text{DominantCycle}}{2} $$
Half a cycle is the natural window for an oscillator, because one full swing from peak to trough takes half a period, so N bars of half-cycle memory is exactly enough to span the move you are trying to time without dragging in the previous swing. When the periodogram reports a 30-bar dominant cycle, RSI runs on a 15-bar window; when the market compresses to a 16-bar cycle, the same RSI tightens to 8 bars on its own, no reoptimization, no curve-fit.
Second, do not feed it raw closing prices. Feed it the output of a band-pass filter centered on the dominant cycle, the FILT in the source, a two-pole band-pass that strips the trend below the cycle and the noise above it. The old article "Why Moving Averages Can Lie at Turning Points" showed that raw price near a turn is dominated by trend lag and noise; band-limiting the input first means the RSI sees a clean cycle, so its overbought and oversold readings line up with the actual swing extremes instead of with whatever the trend and the jitter happened to be doing.
Why this can lead instead of lag, and when it cannot
Every indicator built from past data lags, this pillar has hammered that since the start, and adapting the lookback does not repeal it. What adaptation buys is something narrower and real: when a cycle persists for several swings, an indicator tuned to that cycle is at its sharpest exactly where the swing turns, because the band-pass input and the matched window put the oscillator's most responsive region on the live cycle. The oscillator crosses its midline and hits its extremes in step with the swing rather than a quarter-cycle late, and during a persistent cycle the next swing looks like the last, so a correctly tuned reading of this swing carries information about the next one. That is the predictive characteristic, and it is conditional, not free.
The condition is cycle mode, and the old article "Why Market Cycles Are Evanescent" is the gate. The adaptive RSI is only trustworthy when the periodogram shows a real, persistent peak: a sharp dominant cycle with stable period and amplitude above the noise floor. When the market trends, the periodogram flattens, the dominant cycle measurement turns to noise, and the lookback it feeds the RSI starts thrashing on garbage, at which point your adaptive oscillator is worse than the fixed one because at least the fixed one was stable. So gate it. Run the adaptive RSI only when cycle quality is high, stand down to a trend-mode tool when the peak collapses, and never let a low-confidence cycle estimate drive the window. Tune the indicator to the cycle when there is a cycle; when there is not, the honest reading is that this tool has nothing to say.
KEY POINTS
- A fixed-lookback oscillator like RSI(14) hardcodes a claim about the market's swing length that is right only for the brief window when the dominant cycle matches it, and the old article "Why Market Cycles Are Evanescent" guarantees that window keeps moving.
- The adaptive RSI sets its lookback to half the dominant cycle measured by the autocorrelation periodogram from the old article "Dominant Cycle Estimation Without Astrology", recomputed every bar, so the window widens and tightens with the market.
- Half a cycle is the natural oscillator window because one peak-to-trough swing spans half a period, so N = DominantCycle/2 holds exactly one swing of memory.
- Feed the RSI a band-pass (FILT) output centered on the cycle, not raw price, so its extremes align with the real swing instead of with trend lag and noise, the failure detailed in the old article "Why Moving Averages Can Lie at Turning Points".
- The predictive edge is conditional: when a cycle persists, a correctly tuned reading of this swing informs the next, but only in cycle mode.
- Gate it on cycle quality. When the periodogram flattens (trend mode) the dominant-cycle estimate is noise and the adaptive window thrashes, so stand the tool down rather than trust it.