8.6 Entropy as a Market Choppiness Gauge
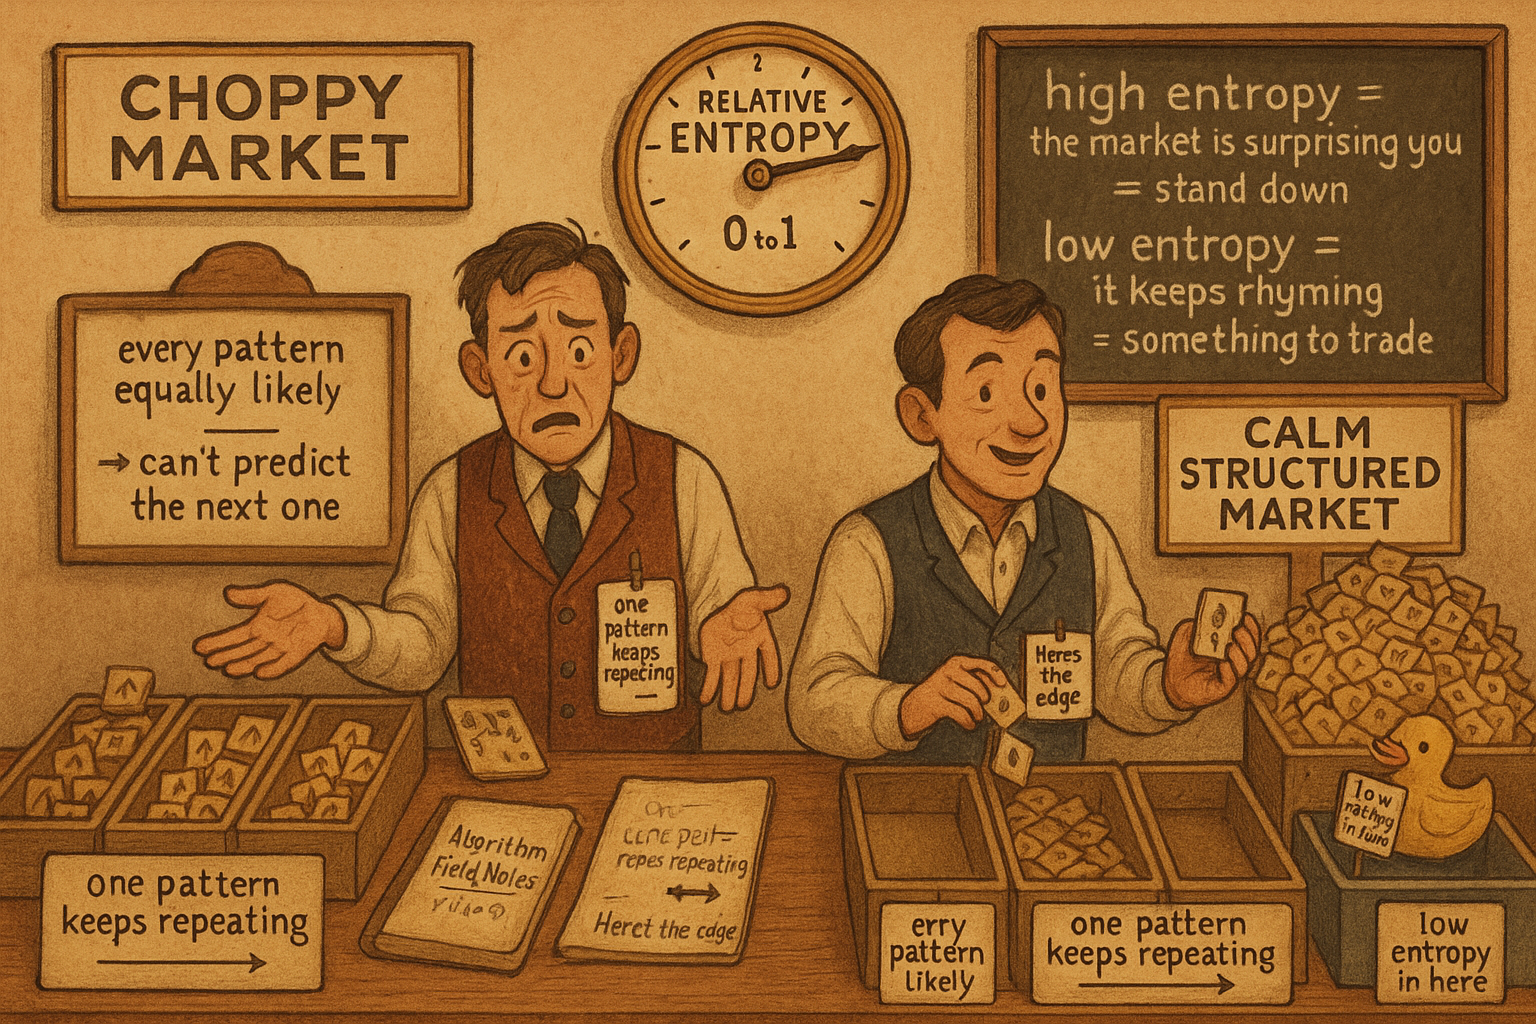
Chop price into up/down "words", histogram them, and measure their entropy: near 1 the market is choppy noise, near 0 it keeps rhyming. Same formula as the indicator-quality score, opposite meaning.
The old article "Relative Entropy as an Indicator Quality Score" used entropy to grade an indicator: bin its values, measure how evenly it fills its range, and reject the ones that pile up in a corner. Same formula, opposite job here. Point the entropy measurement at the price itself instead of at an indicator, and you stop grading a tool and start reading the market. A choppy stretch where price jumps up and down with no follow-through is high entropy, maximum surprise about the next move. A slow steady drift, where each bar mostly continues the last, is low entropy. The old article "Entropy as a Market Concept" argued an efficient market is high-entropy with the predictable structure squeezed out. This article builds the gauge that puts a number on how much structure is left in the last few weeks of price.
Turning price into words
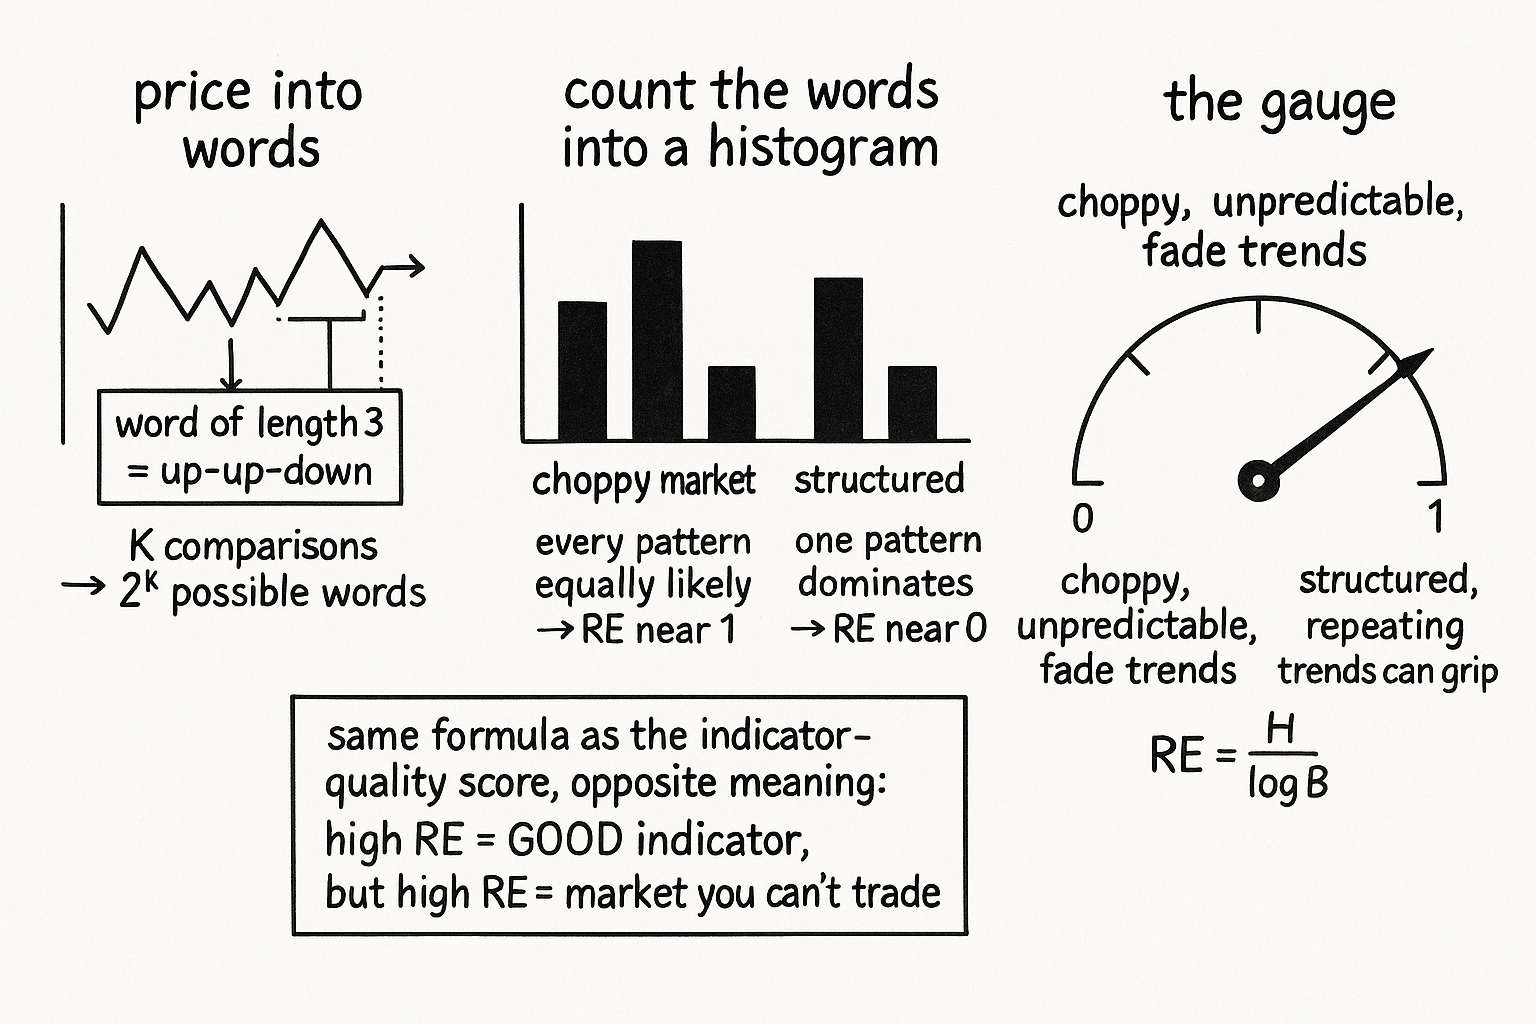
Entropy needs discrete outcomes, and a raw price is continuous, so the first move is to chop recent price action into a finite alphabet. Compare each close to the one before it and ask a single yes-or-no question: did price go up? That gives one bit. Stack K of these consecutive comparisons and you get a pattern of K bits, what information theory calls a word of length K. A word of length 3 might read up-up-down, or down-up-up, and there are exactly two-to-the-K such words.
$$ B = 2^{K} $$
B is the number of possible words, the size of the alphabet, and K is the word length, the number of consecutive up-or-down comparisons that make one word. Length 2 gives 4 words, length 3 gives 8, length 4 gives 16. Keep K small. A word length of 2 already carries usable information about market behavior, and pushing K up multiplies the bins faster than your window can fill them, so the estimate degrades into noise. Each bin needs enough visits to estimate its probability, so the window length should be a multiple of B, not a multiple of bars you picked because they felt round.
Slide a window over the series, read off the word at each bar, and tally how often each of the B words shows up. Divide each count by the number of words in the window and you have a probability histogram: p(b) is the fraction of the time the recent market spelled out word b.
From the histogram to one number
Entropy collapses that whole histogram into a single value, the average surprise of seeing a word.
$$ H = -\sum_{b=1}^{B} p(b)\,\log p(b) $$
H is the entropy, the sum runs over all B words, p(b) is the probability of word b from the histogram, and the log base is your choice because it only rescales the result. Read the formula through its extremes. If one word dominates and the rest almost never appear, the market keeps repeating the same pattern, p(b) is near 1 for that word and near 0 for the others, and H collapses toward 0: low surprise, high predictability. If every word is equally likely, the market spells out a different pattern every time with no preference, p(b) equals 1/B for all of them, and H hits its ceiling at log(B): maximum surprise, no structure.
That ceiling is the trick for making the number portable. Raw H depends on B, so an H of 1.2 means nothing until you know whether the alphabet had 4 words or 64. Divide by the maximum and the scale problem disappears.
$$ \text{RE} = \frac{H}{\log B} $$
RE is the relative entropy, H over its theoretical maximum log(B), and it lands in a clean zero-to-one band regardless of word length. RE near 1 is a choppy, unpredictable market with the patterns spread evenly across the alphabet. RE near 0 is a market locked into a few repeating patterns, the low-entropy pocket the old article "Entropy as a Market Concept" called an edge.
Work a length-2 case to see the gauge move. Four words, so log(B) is log(4). Suppose the window splits evenly, each word at probability 0.25. Then H is the sum of four terms of minus 0.25 times log(0.25), which equals log(4), and RE is exactly 1.0: the market filled its alphabet uniformly, peak choppiness. Now skew it so one word carries 0.7 of the visits and the other three split 0.1 each. Using natural logs, H is minus the quantity 0.7 times ln(0.7) plus three times 0.1 times ln(0.1), which works out to about 0.94, and RE is 0.94 over ln(4), about 0.68. The market leaned on one pattern, entropy dropped, and the gauge reported a more structured tape without you eyeballing a single candle.
Why this is not the old quality score
The formula matches the old article "Relative Entropy as an Indicator Quality Score" down to the symbol, and that is exactly where traders trip. There, you bin one indicator's output and you want RE high, because a high score means the indicator uses its full range and feeds a model resolution instead of clumping into one bin. The high reading is the good outcome, the sign of a well-behaved tool. Here you bin patterns of price moves, and a high reading is the market telling you it has no exploitable structure. High RE is the thing you wanted from an indicator and the thing you fear from the market.
The inputs are different too, and that matters more than the shared equation. The quality score eats a continuous indicator and bins its values by magnitude. The choppiness gauge eats the sign of price changes and bins their arrangement, the words. One judges whether your measuring stick is any good; the other judges whether the thing you are measuring can be traded at all. Run both and you can be in the worst spot without noticing from either alone: a high-quality indicator, RE above 0.8 on its own distribution, pointed at a high-entropy market, RE near 1 on its words, a sharp instrument reading a surface with nothing on it.
Trading the gauge, and what it will not tell you
Use it as a state switch, not a signal. High RE flags a regime where the next move barely depends on the last, the choppy churn where trend rules get whipsawed and where mean-reversion or staying flat is the honest play. Low RE flags a stretch with repeating structure, where directional rules have something to grip. This is the noise axis from the old article "Noise Is Not Volatility" reached through information theory instead of path length, and the two agree on the part that matters: a quiet, low-volatility market can still be pure noise with RE near 1, and a violent one can carry real structure with RE well under it.
The gauge says nothing about direction. A low-entropy market repeating down-down-down scores the same as one repeating up-up-up; entropy counts patterns, not their sign, so pair it with something that reads which way the structure points before you take a side. It also lags by construction, because every reading is an average over a window, so a regime that just flipped will not show up until enough new words refill the histogram, and shrinking the window to react faster starves the bins and corrupts the estimate. Pick the window for stable bin counts first and accept the lag, rather than chasing responsiveness into garbage. And do not over-read small wiggles in RE near the top of its range; the difference between 0.95 and 0.98 is mostly estimation noise, while the drop from 0.9 to 0.6 is the market actually changing character.
KEY POINTS
- Chop recent price into a finite alphabet: compare each close to the prior one for an up-or-down bit, stack K of them into a word, giving two-to-the-K possible words; keep K small (2 is enough) so the bins fill.
- Build a probability histogram of the words over a sliding window, then collapse it with entropy H = minus the sum of p(b) log p(b), which is near 0 when one pattern repeats and at its maximum log(B) when every pattern is equally likely.
- Normalize to relative entropy RE = H over log(B) so the reading sits in zero-to-one regardless of word length; RE near 1 is a choppy unpredictable market, RE near 0 is the structured pocket the old article "Entropy as a Market Concept" called an edge.
- The formula matches the old article "Relative Entropy as an Indicator Quality Score" but the meaning flips: there high RE means a good indicator, here high RE means a market with no structure to trade, and the inputs differ (indicator magnitudes versus arrangements of price moves).
- It is the noise axis of the old article "Noise Is Not Volatility" reached through information theory: a calm low-volatility market can still read RE near 1 (pure noise) and a violent one can carry real structure.
- Use it as a regime switch, not a signal: it ignores direction, it lags because every reading averages a window, and shrinking the window to react faster starves the bins and corrupts the estimate.