2.58 The Even Better Sine Wave: Advancing Phase to Predict
Convert the swing to a clean sine wave, then advance its phase to read the cycle a few bars early. Genuine prediction, valid only in cycle mode; in a trend it fires confident false reversals, so gate it hard.
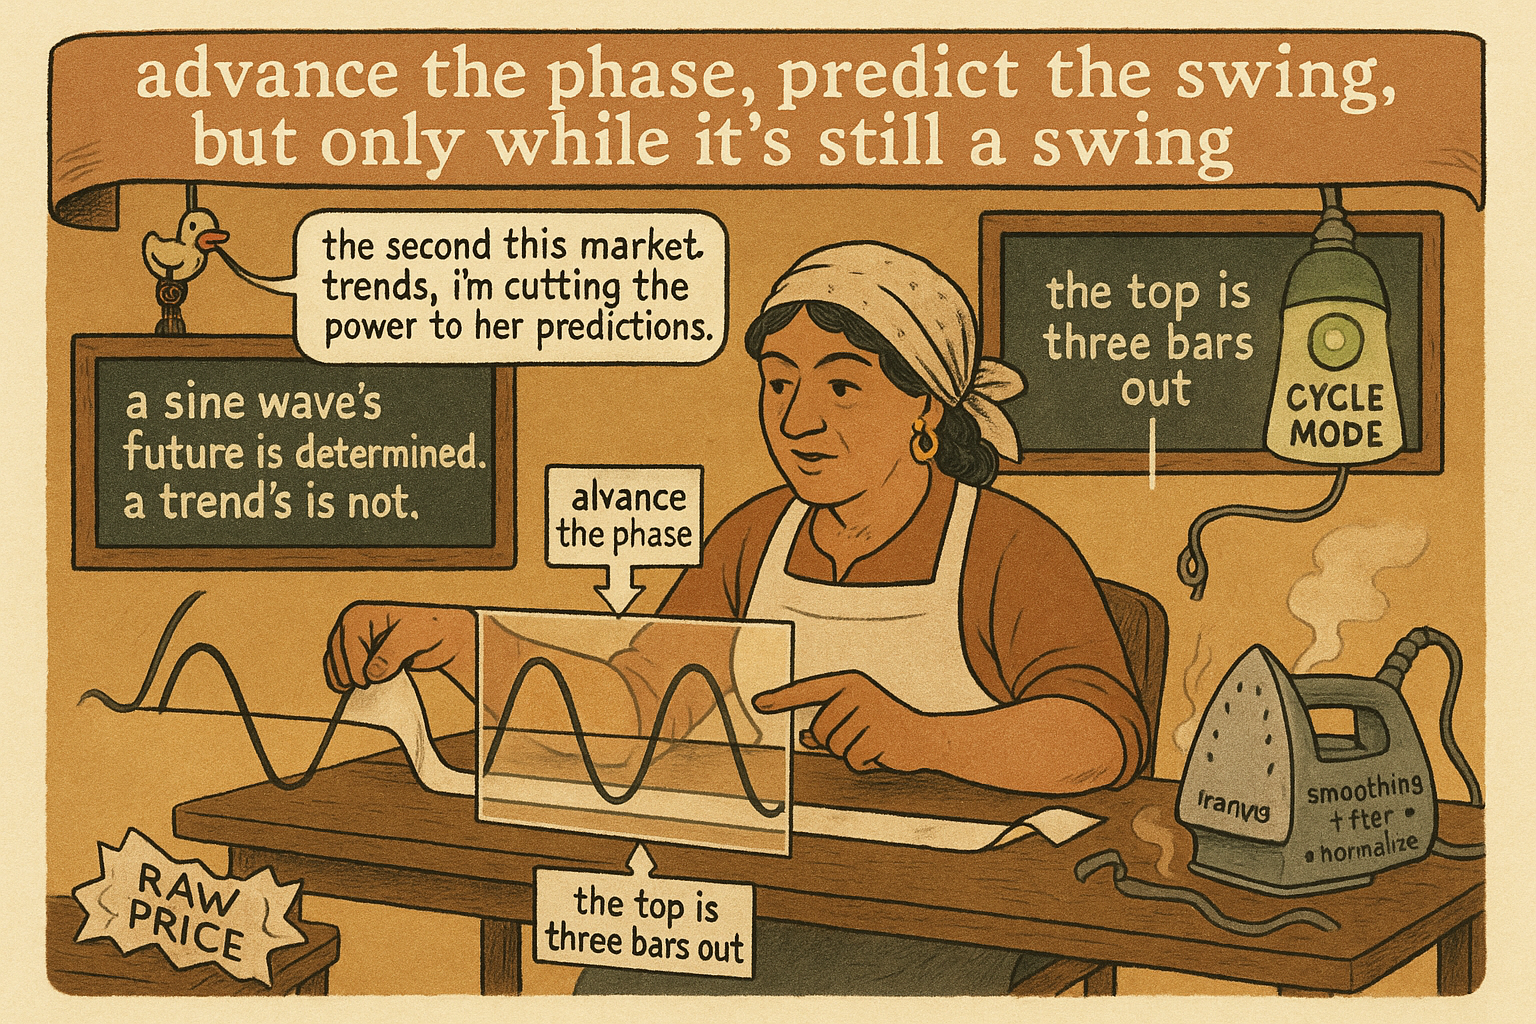
Every indicator in this pillar reshapes the past, and the old article "Why Moving Averages Can Lie at Turning Points" showed the bill that comes due for it: signals arrive after the turn, never before. There is one trick that looks like it cheats this, and it almost does. If you can convert the market's swing into a clean sine wave, you know something a price chart never gives you, the exact shape of what comes next, because a sine wave is perfectly predictable once you know where in its cycle you are. So you take the phase you measured and push it forward. The indicator now reports where the cycle will be a few bars from now instead of where it is. That is real prediction, and it is valid for exactly as long as the market keeps behaving like a sine wave, which is the whole catch.
Turn the swing into a sine wave first
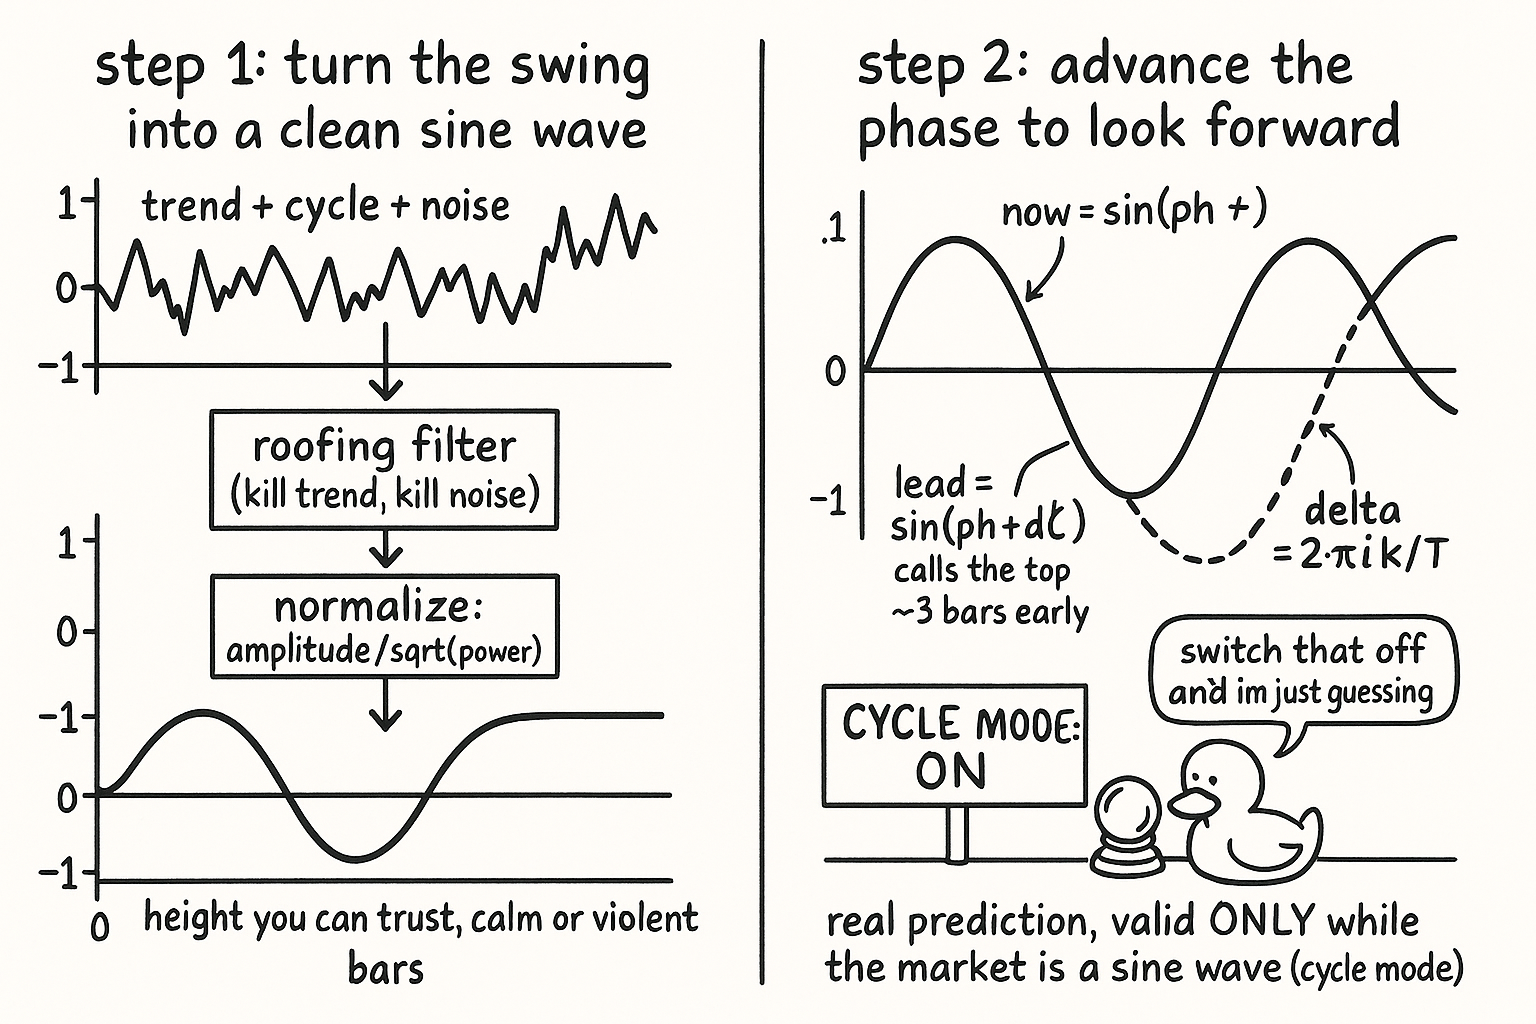
Raw price is trend plus cycle plus noise, and none of those three is a sine wave. To get one, band-limit the price into a roofing filter: a high-pass that kills the slow trend and a smoother that kills the fast noise, leaving the cycle band. The old article on isolating the cycle band covered why this matters; here it is the mandatory first step, because the phase-advance trick only works on a clean oscillation. Feed it raw price and you are advancing the phase of trend lag and noise, which is meaningless.
Once you have a clean cyclic waveform, normalize it hard so its amplitude stays fixed regardless of how strong the swing is. Compute the average wave amplitude and the average power over a short window, where power is proportional to the square of the amplitude, then divide the amplitude by the square root of the power.
$$ \text{Power} = \overline{\text{Wave}^2}, \qquad \text{SineWave} = \frac{\overline{\text{Wave}}}{\sqrt{\text{Power}}} $$
Dividing amplitude by the square root of average power forces the output to swing between roughly minus one and plus one no matter how big or small the raw cycle is, which is the same amplitude-stabilizing logic as the old article "Automatic Gain Control for Trading Indicators". The result is a waveform whose height you can trust, so a reading near plus one always means the same thing (near a cyclic top) and near minus one always means a cyclic bottom, across calm and violent markets alike.
Advance the phase to look forward
Now the prediction. A sine wave is fully described by its phase, the angle that says where in the cycle you are right now, and the wave's value is the sine of that phase.
$$ \text{now} = \sin(\phi), \qquad \text{lead} = \sin\!\left(\phi + \Delta\phi\right), \qquad \Delta\phi = 2\pi\,\frac{k}{T} $$
To see the wave k bars into the future, add the phase that k bars represents, which is 2 pi times k over the period T, and take the sine of the advanced angle. If the period is 20 bars and you advance by 3 bars, you add 2 pi times 3 over 20, about 54 degrees, and the lead curve crosses its peaks and zeros three bars before the present curve does. Plot both: the present sine wave and the advanced one. The advanced curve calls the top before the present one reaches it, and that lead is genuine prediction rather than lag reduction, because for a pure sine wave the future is determined and you are computing it, not estimating it.
This is why it earns the name. The original sine wave indicator hunted for the dominant cycle phase by correlating price against a theoretical sine, an expensive measurement. The even better version leans on the strong normalization instead, so the waveform is clean enough to advance directly. You get a forward-looking line from a backward-looking series, which feels like a free lunch.
It is not a free lunch, and the bill is regime
Read the assumption in the phase-advance equation: it computes the future under the premise that the wave continues as a sine of the same period. That premise is true only in cycle mode. The old article "Why Market Cycles Are Evanescent" is the entire risk here: the period drifts, the amplitude decays, the phase loses coherence, and the moment the market stops oscillating the advanced curve is confidently predicting a swing that will never happen. In a trend, a phase-advanced sine wave will scream reversal at every minor pause and be wrong each time, because there is no cycle to advance. Prediction of a cyclic swing while the market is trending is not just useless, it is a sequence of high-conviction wrong calls, which is worse than a lagging indicator that at least stays quiet.
So the discipline is the same gate as every cycle-mode tool. Advance the phase only when the dominant cycle is real and persistent, a sharp periodogram peak with stable period and amplitude above the noise floor, and the further you advance the more fragile the call, because a small error in the measured period compounds into a large phase error several bars out. Advance by a fraction of the cycle, not half of it. Treat the lead curve as a hypothesis that the current swing continues, gate it on cycle quality, and kill it the instant the market trends. Used inside its regime it is the closest thing to legitimate prediction this pillar offers. Used outside it, it is a confident liar.
KEY POINTS
- The phase-advance trick is the closest thing to genuine prediction in this pillar: convert the swing to a sine wave, then push its phase forward to read where the cycle will be a few bars from now.
- It requires a clean oscillation first, so band-limit price through a roofing filter (kill trend and noise) before doing anything else.
- Normalize hard: divide average wave amplitude by the square root of average power so the output swings a fixed minus-one to plus-one regardless of swing strength, the same amplitude logic as the old article "Automatic Gain Control for Trading Indicators".
- Advance by adding the phase that k bars represents, 2 pi times k over the period, and take the sine of the advanced angle; the lead curve calls peaks and troughs k bars before the present curve.
- This is real prediction, not lag reduction, because a pure sine wave's future is determined, but it assumes the wave continues at the same period.
- That assumption holds only in cycle mode. The old article "Why Market Cycles Are Evanescent" is the risk: in a trend the advanced curve fires high-conviction false reversals. Gate on cycle quality, advance by a small fraction of the cycle, and kill it when the market trends.