6.59 Everything Predicts the VIX Except the VIX
VIX timing from the S&P's two-day RSI and overnight Bitcoin: RSI at or below 20 booked 178.60 points shorting the VIX future; the VIX's own RSI booked 90.81.
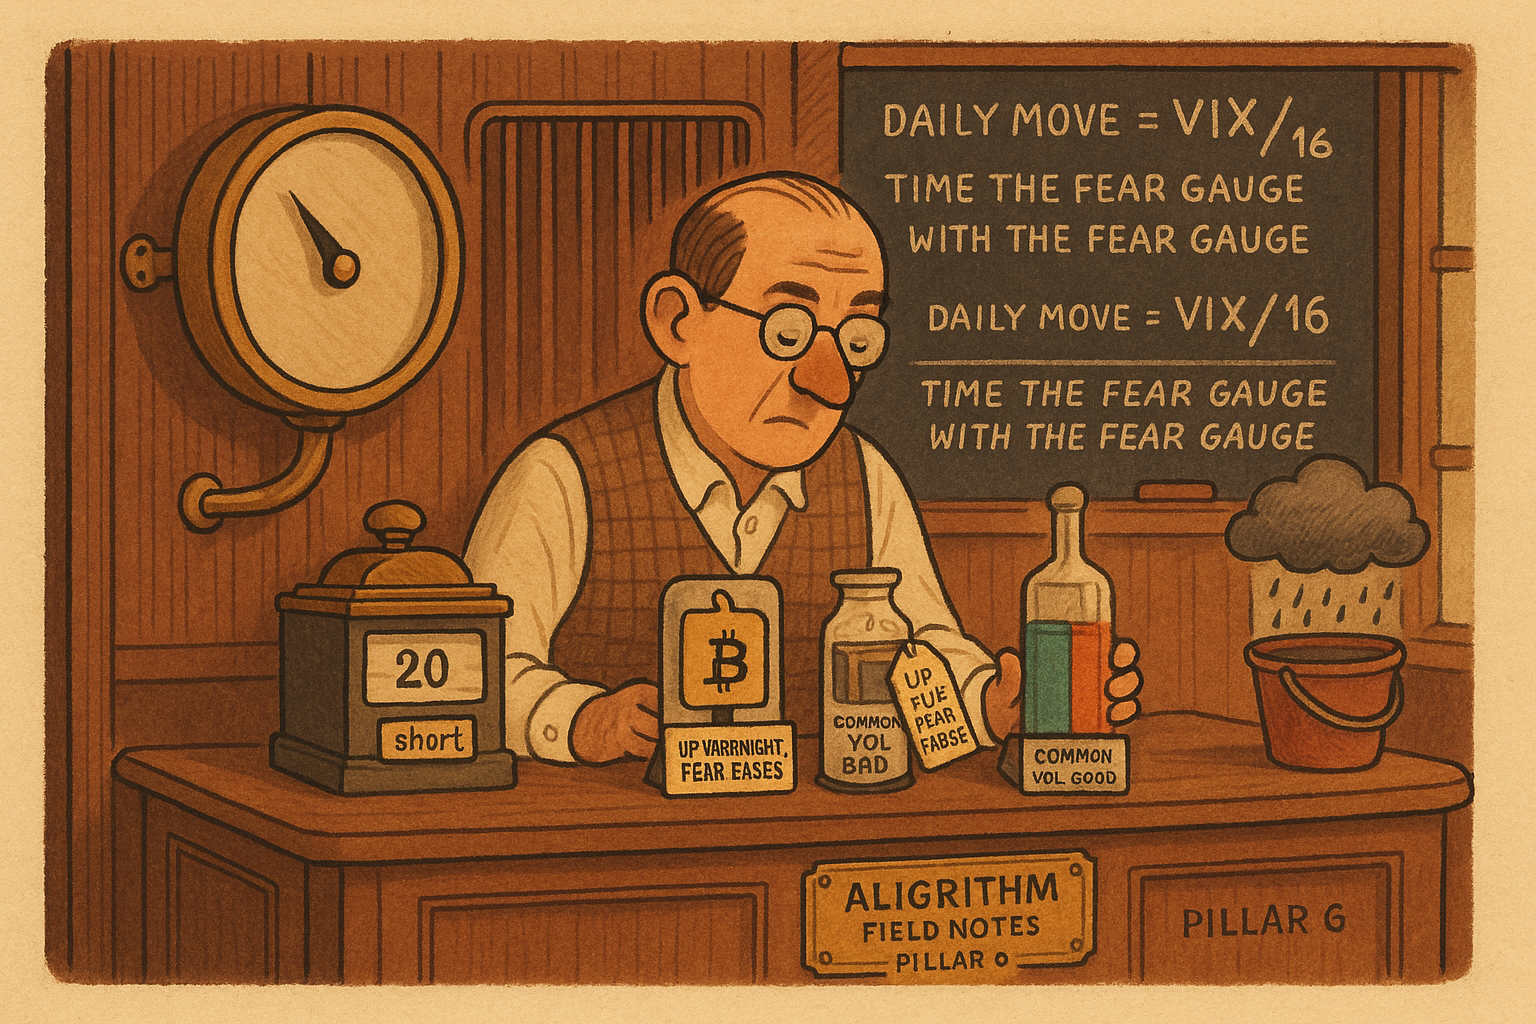
The next change in implied vol is forecastable, and the coordinates that move it are computed on other assets. Rob Hanna's two-day RSI on the S&P 500, closed at or below 20, booked 178.60 points as a one-day short of the VIX future from 2007 through 2023. Gu, Lin, and Liu get a parallel result on the overnight clock: Bitcoin's return while US equities are closed forecasts the next trading-hour change in the VIX, and the Bitcoin return during the cash session loses significance once that overnight leg is in the regression. Pham, Han, Nguyen, Pham, and Do keep a signed common-volatility factor in crypto that still predicts crypto variance after the change in the VIX sits in the same regression. The state you compute has those three coordinates. The VIX's own short-horizon oscillator leaves a short profitable in both of its tails.
The daily move is the VIX over the square root of 252
The VIX is the CBOE's 30-day implied volatility of S&P 500 options, taken from the strip with 23 to 37 days left. It is an annualized number. Hanna's closes from 1990 to 2023 run from 9.14 to 82.69. A daily move is that annualized reading divided by the square root of the number of trading days.
$$ \text{daily move} \approx \frac{\text{VIX}}{\sqrt{252}}, \qquad \sqrt{252} = 15.87 $$
The square root of 252 is 15.87. Hanna rounds the divisor to 16 and calls it the rule of 16. A VIX of 16 divided by 15.87 is a 1.01% daily move; divided by 16 it is exactly 1%. A VIX of 32 is 2.02% a day, and a VIX of 80 is 5.04% a day. Moves of that size are rare, so a print at 30 or 40 has a short life: the options are charging for a month of ranges the tape usually does not deliver, and the premium comes out when the tape quiets. The old article "Chicken and Egg: Use the SPX to Time the VIX, Not Vice Versa" runs the full test of which oscillator times which index. The conversion is the part you need before any of those points mean anything.
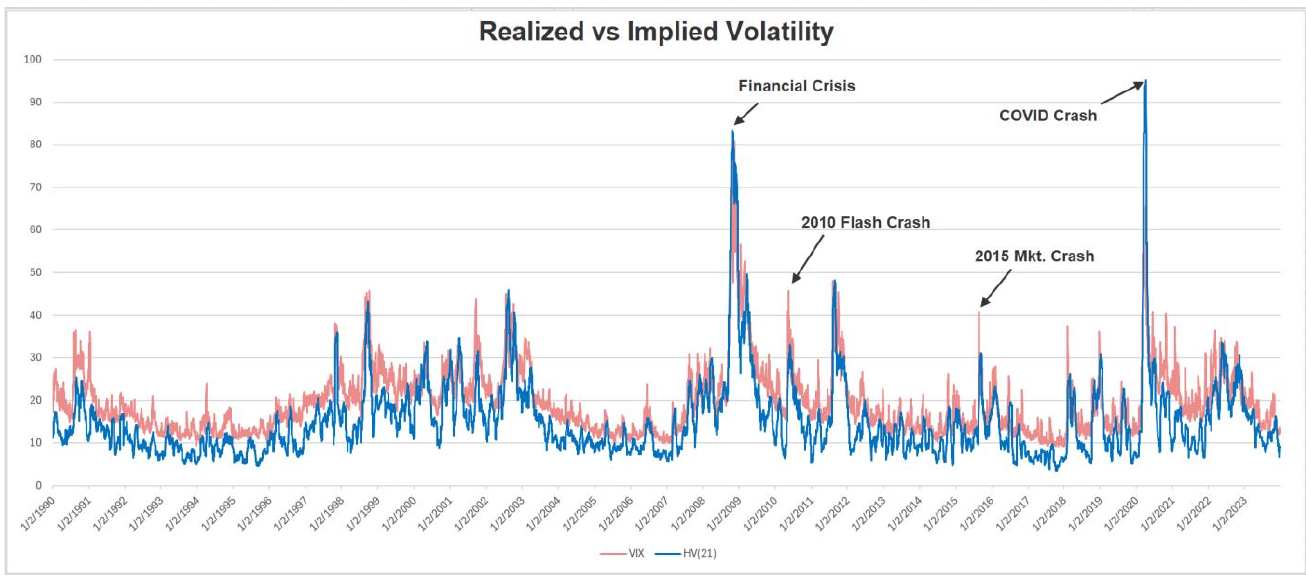
The red line is the VIX. The blue line is 21-day historical volatility of the S&P 500, Hanna's backward month against the VIX's forward month. They rise and fall together, and the red line usually sits on top, which is the premium for the month the seller has not seen yet. At the COVID peak the blue line is the one that spikes past the VIX's sample high of 82.69. Implied vol is equity realized vol, read on a different clock. A model that starts from yesterday's VIX is mostly forecasting that persistence.
The equity coordinate is a two-day RSI
Hanna's timing state is Wilder's RSI on the S&P close, length 2. He names Wilder and does not print the expression. The two-period seed is the average up-move over the last two closes divided by the average down-move.
$$ RSI_2 = 100 - \frac{100}{1 + RS}, \qquad RS = \frac{AG_2}{AL_2} $$
AG is the average of the up-closes over those two days, AL the average of the down-closes, and a day that did not rise contributes nothing to AG. The ratio RS is how much of the two-day move was up. The RSI maps that ratio onto 0 to 100. After the seed, Wilder's recursion for length 2 replaces each average with (yesterday's average plus today's value) divided by 2. The quintile tables are this oscillator.
Worked seed. The last two S&P changes are +0.4% and -1.6%. Average gain is 0.2, average loss is 0.8, RS is 0.25, and the RSI is 100 minus 100/1.25, which is 20. That is his oversold bucket. An RSI near 100 is two up-closes. An RSI near 0 is two down-closes. You are marking a short-horizon mean-reversion state of the underlier.
He turns the reading into a one-day position in the VIX future, which his tables label VX. He builds that continuous series from CBOE data and rolls on the Tuesday close before Wednesday expiry. The one-signal model has no 200-day filter.
$$ q_{t+1} = \begin{cases} -1 & \text{if } RSI_2(SPX_t) \le 30 \\ +1 & \text{if } RSI_2(SPX_t) > 90 \\ 0 & \text{otherwise} \end{cases} $$
You short one future when the two-day RSI closes at or below 30, you buy one when it closes above 90, and you hold cash in between, for one session. The RSI of 20 from the example is a short. An RSI of 95 is a long. An RSI of 55 is flat. The 30 is looser than the quintile edge at 20, and the 90 is tighter than the edge at 80. He set both after seeing those quintiles on the same 2007 to 2023 sample.
Overnight Bitcoin is the sentiment coordinate
Gu, Lin, and Liu align five-minute Bitcoin with the US cash session, 9:30 to 16:00 Eastern, holidays removed, January 2018 through December 2023. The close-to-close log return splits into the hours the equity pit is shut and the hours it is open.
$$ R^{ON}_t = \ln BTC^{Open}_t - \ln BTC^{Close}_{t-1}, \qquad R^{TH}_t = \ln BTC^{Close}_t - \ln BTC^{Open}_t $$
Overnight is the log change from the prior equity close to this equity open. Trading-hour is the log change from that open to the equity close. They sum to the close-to-close log return. Worked prices: 40,000 at the equity close, 40,800 at the next open, 40,200 at the next close. Overnight is ln(40800/40000) = 0.0198. Trading-hour is ln(40200/40800) = -0.0148. Close-to-close is ln(40200/40000) = 0.0050, and 0.0198 plus -0.0148 equals 0.0050.
Over 1,512 days the mean overnight return is 0.093% and the mean trading-hour return is -0.029%. The standard-deviation row prints 0.036 on the overnight leg. That row is not in percent. A 0.036% daily standard deviation is nonsense for Bitcoin, and the footnote multiplies 0.036 by the regression slope as a decimal. Take the mean as 0.093 percent and the standard deviation as 0.036 in decimal units. The table labels only the mean row with a percent sign.
They call the overnight leg retail sentiment because the reversal against the trading-hour return widens with attention. Abnormal attention is the deviation of a proxy from its trailing monthly average, divided by that monthly average. Sorted on Google search volume for Bitcoin, the high-attention decile's overnight return beats the low-attention decile by 1.133% (t-statistic 2.07), and the overnight-minus-trading-hour spread is 1.247% (t-statistic 2.04). The trading-hour high-minus-low is -0.114% (t-statistic -0.36). The old article "Bitcoin's Overnight Returns Forecast the VIX" keeps the rest of the attention grid. The coordinate you store is the overnight log return.
That return is aimed at the trading-hour change in log VIX.
$$ \Delta \ln V^{TH}_t = \alpha + \beta_1 R^{ON}_{BTC,t} + \beta_2 R^{TH}_{BTC,t-1} + \text{controls} + e_t $$
The left side is the change in log VIX from the equity open to the equity close. Beta-one loads this morning's overnight Bitcoin return. Beta-two loads yesterday's trading-hour Bitcoin return. The controls, written out in their equation (4), are overnight and lagged trading-hour S&P 500 futures returns, the overnight log change in the VIX, holiday dummies, Federal Open Market Committee announcement dummies, and three lags of each VIX leg. They state beta-one as minus 0.262, with a t-statistic of minus 2.49 on Newey-West standard errors, which correct for autocorrelation in the residuals. With S&P futures and the holiday dummies it is minus 0.255, t-statistic minus 2.44. They say the loading holds once those announcement dummies are in, and that beta-two loses significance once the overnight leg is present. The printed table does not line up with those sentences: minus 0.262 sits in the first numeric column, not in the column the prose calls the overnight specification. I use the numbers in the text and the footnote. Adjusted R-squared on that table runs from 0.010 to 0.031. The slope is detectable. The fit is thin.
A one-standard-deviation overnight move scales by that slope.
$$ 0.036 \times 0.262 = 0.009432, \qquad \frac{0.009432}{0.072} = 0.131 $$
They round the product to 0.0094 and the ratio to 13%. The 0.072 is the standard deviation of the trading-hour log VIX change. Bitcoin up by one standard deviation of its overnight return lines up with a trading-hour VIX change 0.131 of a standard deviation lower. On the price example, 0.0198 times minus 0.262 is minus 0.0052, which is 7.2% of that 0.072.
The VIX already has an intraday pattern you are shifting. Mean overnight log change is +0.964%, mean trading-hour change is -0.955%, mean close-to-close is +0.016%. The two legs add to +0.009%. The printed close-to-close mean is +0.016%. The gap is a tenth of a percent on 1,508 observations, so it can be rounding or a sample mismatch, and the close-to-close mean stays as printed. The shape is the usable part: the fear gauge gaps up while equities are shut and gives premium back while they are open. Overnight Bitcoin moves the size of that giveback.
The level is a separate forecast. Their heterogeneous autoregression predicts the log VIX close from its own lag, the average of the last 5 log closes, and the average of the last 22, plus S&P futures returns. HAR-ON adds the overnight Bitcoin return. Out of sample, on a 500-day rolling window, the own-lag version already has an R-squared of 0.940 and HAR-ON has 0.941. Mean squared error, scaled by 100 in their table, goes from 0.644 to 0.633, a 1.7% cut in the loss. Tomorrow's VIX level is today's VIX level. The overnight return is a residual adjustment on top of that.
Good minus bad is the signed coordinate
Pham and coauthors estimate Engle and Campos-Martins common volatility on the 25 largest cryptocurrencies, 25 January 2015 to 23 April 2024. Excess return is the log return minus the one-year Treasury yield divided by 360. Each series gets an AR(1), the first principal component of the panel, and GARCH(1,1) errors: today's variance depends on yesterday's squared residual and yesterday's variance. The standardized residual has variance 1 in the model. COVOL is the latent factor those residuals share once you have removed the predictable variance, and each coin has a loading on it.
$$ g(s_i, x_t) = 1 + s_i (x_t - 1) $$
x is that day's common-vol factor, scaled so a normal day has x equal to 1. s is the coin's loading. g multiplies the coin's residual variance: on a normal day g is 1, and a day with x above 1 inflates every loaded coin together. Worked on 12 March 2020, a day they flag, when crypto COVOL printed 29.06 and the S&P 500 fell 10%. Bitcoin's pooled loading is 0.2311. Then g equals 1 plus 0.2311 times (29.06 minus 1), which is 7.48, and the square root is 2.74. The common shock that day multiplied Bitcoin's residual variance by about 7.5 relative to a normal day. This uses the pooled loading. The old article "Good vs Bad COVOL in Crypto: A Common-Volatility Tilt" runs the bad-only loading and the equicorrelation test, statistic 20.67 before the factor comes out and 0.64 after.
The signed split truncates returns. A positive day keeps its return in the "good" series and enters the "bad" series as a zero, and the reverse for a down day. The same factor machine is fit to each truncated series. About half the observations in each fit are exact zeros, so the residuals cannot be the independent standard normals the factor assumes. The old article already shows that distributional break. The difference is the signed object: the VIX is one unsigned level, and good and bad COVOL are two magnitudes.
$$ d_t = \hat\chi^{\sigma,+}_t - \hat\chi^{\sigma,-}_t, \qquad dma_{20,t} = \frac{1}{20}\sum_{k=0}^{19} d_{t-k}, \qquad RCI_t = 100 \times \frac{dma_{20,t} - \min(dma_{20})}{\max(dma_{20}) - \min(dma_{20})} $$
d is good COVOL minus bad COVOL. dma is the average of d over the last 20 days, including today. The index stretches that average onto 0 to 100 by where it sits between the minimum and the maximum of dma. Worked, with dma at +0.5, a minimum so far of -2, and a maximum so far of +4: the index is 100 times (0.5 minus -2) divided by (4 minus -2), which is 100 times 2.5/6, or 41.7. Their rule holds the crypto index at 100% between 30 and 70, so 41.7 is a full unlevered weight. If the sample minimum is -8 and you have not seen it yet, the same +0.5 becomes 100 times 8.5/12, or 70.8, and the rule holds 125%. Equation (12) takes the minimum and the maximum over the whole sample. An expanding window is the version you could have computed. The published scale uses extremes you did not have on the day.
Two counts do not need that scale. Good COVOL exceeded bad on 1,754 days and bad exceeded good on 1,588, which is 52.5% of days leaning to the positive shock. The largest good print is 58.93 on 15 September 2016. The largest bad print is 98.49 on 3 April 2017. Bad spikes harder, and the mild positive shock is the more common one.
Squared COVOL predicts the broad crypto index's variance shock with coefficient 0.42 and standard error 0.17. The change in the VIX, in its own regression, has coefficient 0.19 and standard error 0.06. With both in the regression, plus policy uncertainty and geopolitical risk, COVOL's coefficient is 0.38 and remains significant, and policy uncertainty drops out. The VIX change is a real covariate of crypto variance. The common-vol coefficient stays in the regression beside it. That factor, split by the sign of the return shock, is the third coordinate.
Three coordinates, and each one keeps its book
At the US cash close you can compute the two-day RSI of the S&P 500 from closes you already have. Before the next cash open you can compute Bitcoin's overnight log return from a price that printed while the pit was shut. The COVOL difference is a fit: 25 coins, two truncated GARCH passes, and a range.
$$ s_t = \big( RSI_2(SPX_t),\; R^{ON}_{BTC,t+1},\; d_t \big) $$
The first coordinate is known at the equity close on day t. The second is known at the next equity open, so it can shift today's trading-hour VIX forecast and it cannot rewrite yesterday's RSI. The third is known when you refit, and a full-sample minimum rewrites the history. A risk-on morning can light all three at once. No paper estimates the covariance between a two-day equity RSI, an overnight Bitcoin return, and a crypto common-vol spread, so a summed score counts one day three times. I am against that sum.
Each coordinate stays on the book it was measured on. The RSI sets the sign of one VIX future for one day, and the middle of the range is cash. The overnight return enters the trading-hour log-VIX forecast as minus 0.262 times itself, on top of lags that already contain the VIX. The COVOL difference, on an expanding range, tilts a crypto index between 75% and 125% at their 30 and 70 lines. That weight belongs on the crypto index. A crypto variance factor and a VIX future are different positions that both move when people are scared.
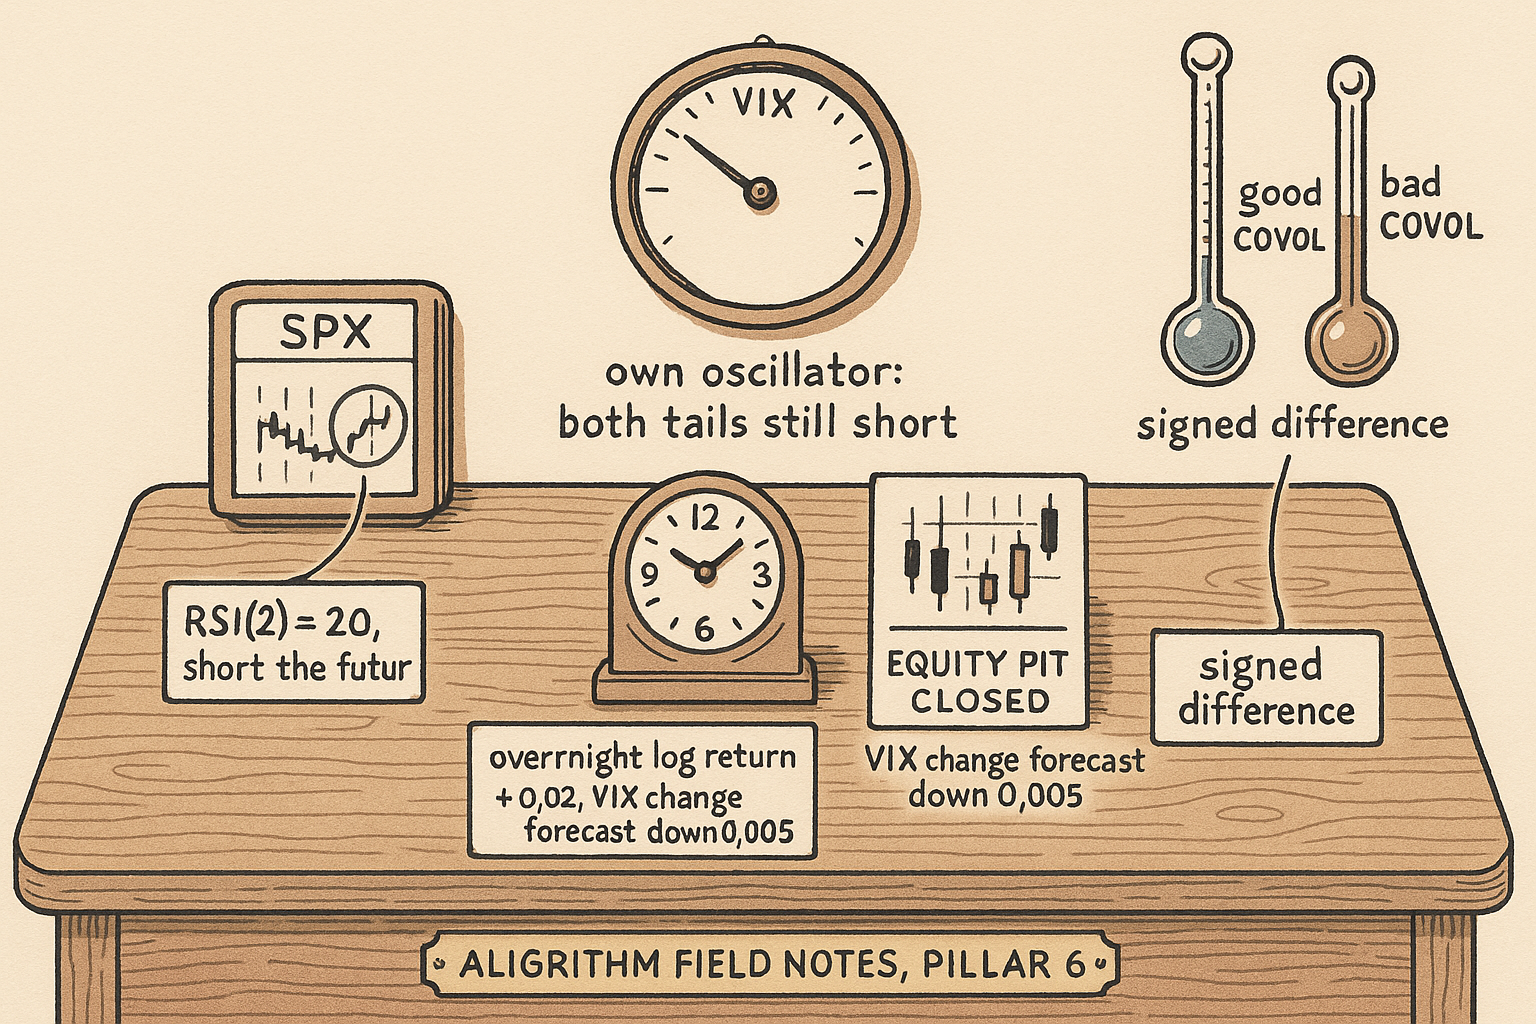
The VIX's own oscillator leaves both tails short
The first two bars are the S&P 500's two-day RSI. The last two are the VIX's own. The equity overbought bar is the one under zero.
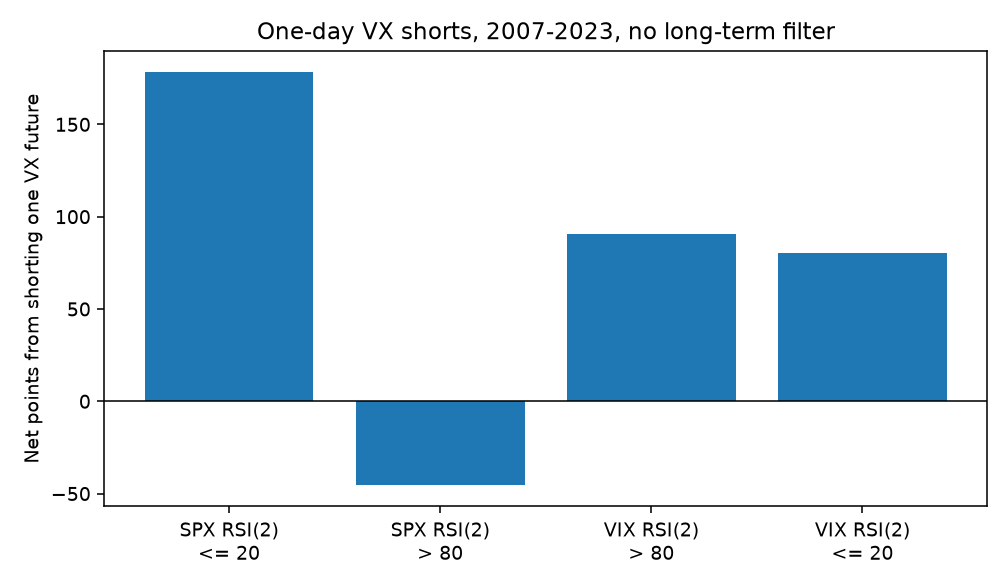
From 1 January 2007 to 31 December 2023, shorting one VX future for a day when the S&P's two-day RSI closed at or below 20 made 178.60 points over 822 days. The printed average is 0.22; 178.60 divided by 822 is 0.217, so the average is rounded. Max drawdown on that bucket is 21.04 points, and 178.60 / 21.04 is 8.49, matching the printed recovery factor. The same short when the S&P RSI closed above 80 lost 45.57 points over 1,367 days. The same short when the VIX's own two-day RSI closed above 80 made 90.81 points over 830 days, and 90.81 / 178.60 is 0.51, which is the "about half" in his text. The rest of the VIX grid is the same story in one line: the oversold VIX bucket, RSI at or below 20, still made 80.23 points for the short, so both tails of the fear gauge paid you to stay short.
A later reprint of the S&P filter flips the 60-to-80 bucket from +54.21 points on 851 days to -54.21 points on 651 days, and it leaves the recovery factor at 2.15. That recovery factor is 54.21 / 25.23, so it belongs to the positive net. I use the first table.
The one-signal model is the path under those buckets, with the 30 and 90 cuts and a long leg, still at zero commission.
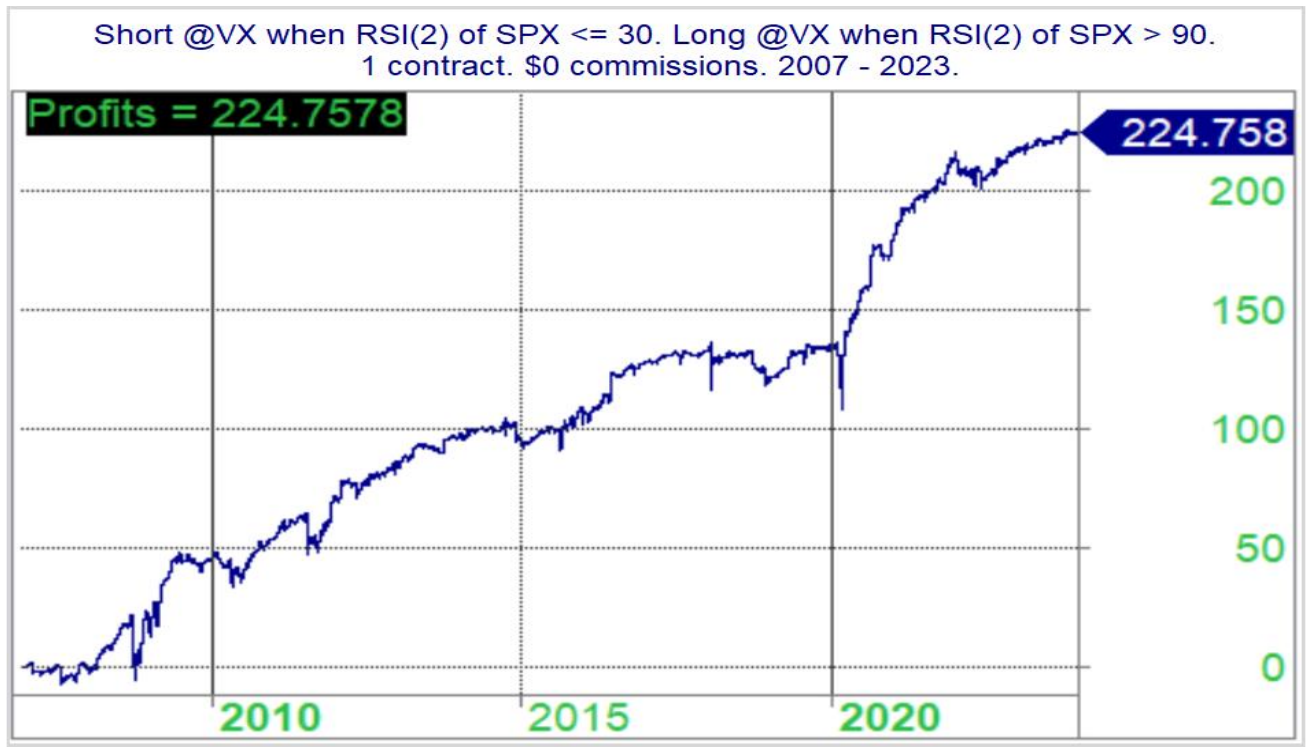
The curve ends at 224.76 points. Hanna rounds that to 225 and sets it against the 213.52 points a naked short of VX made on the same days, whose max drawdown was 68.86. The model's max drawdown is 28.06.
$$ 1 - \frac{28.06}{68.86} = 0.5925 $$
That is the 59.25% drawdown reduction he prints. He also says the model carried exposure 45% of the time. The quintile counts cannot confirm it, because the model uses 30 and 90 rather than the printed buckets, so 45% stays his figure. The chart header does confirm the rules and the zero commission.
Gu, Lin, and Liu grade a book in VIXY, the ProShares exchange-traded fund that holds short-dated VIX futures, long or short one dollar on the sign of the forecast, with 9.7 basis points per dollar traded. The annualized information ratio is the mean abnormal return over its standard deviation. HAR-ON prints 0.99. The own-lag HAR prints 0.46. Trading-hour Bitcoin prints 0.50. Under those ratios the mean-squared-error gap is the 1.7% above, and the Diebold-Mariano statistic of the own-lag HAR against HAR-ON is -1.51, short of 5%. Close-to-close Bitcoin against HAR-ON is -2.13, which does clear. The overnight leg beats the blended daily return. The doubled information ratio is a larger claim than the accuracy test supports. Annualizing the printed HAR-ON daily mean of 0.579% and daily standard deviation of 0.096 with the square root of 252 gives 0.96, against the printed 0.99. The own-lag row does the same, 0.45 computed against 0.46 printed. I keep 0.99. The paper's annualization sits a little above a 252-day scaling of the rounded daily moments.
The third coordinate's portfolio table does not describe one return series. The relative-COVOL rule with lines at 30 and 70, weights 125%, 75%, and 100%, prints a Sharpe ratio of 0.56 against 0.40 for buy-and-hold, and an accumulated return of 141.98 against 45.58, next to a monthly volatility of 10.89%. The old article shows the Sharpe column and the accumulated-return column cannot come from the same series. Gross of costs. I would size off the coefficient of 0.38. The Sharpe ratio comes from two columns that disagree with each other.
Stay flat in the middle, and keep the scores apart
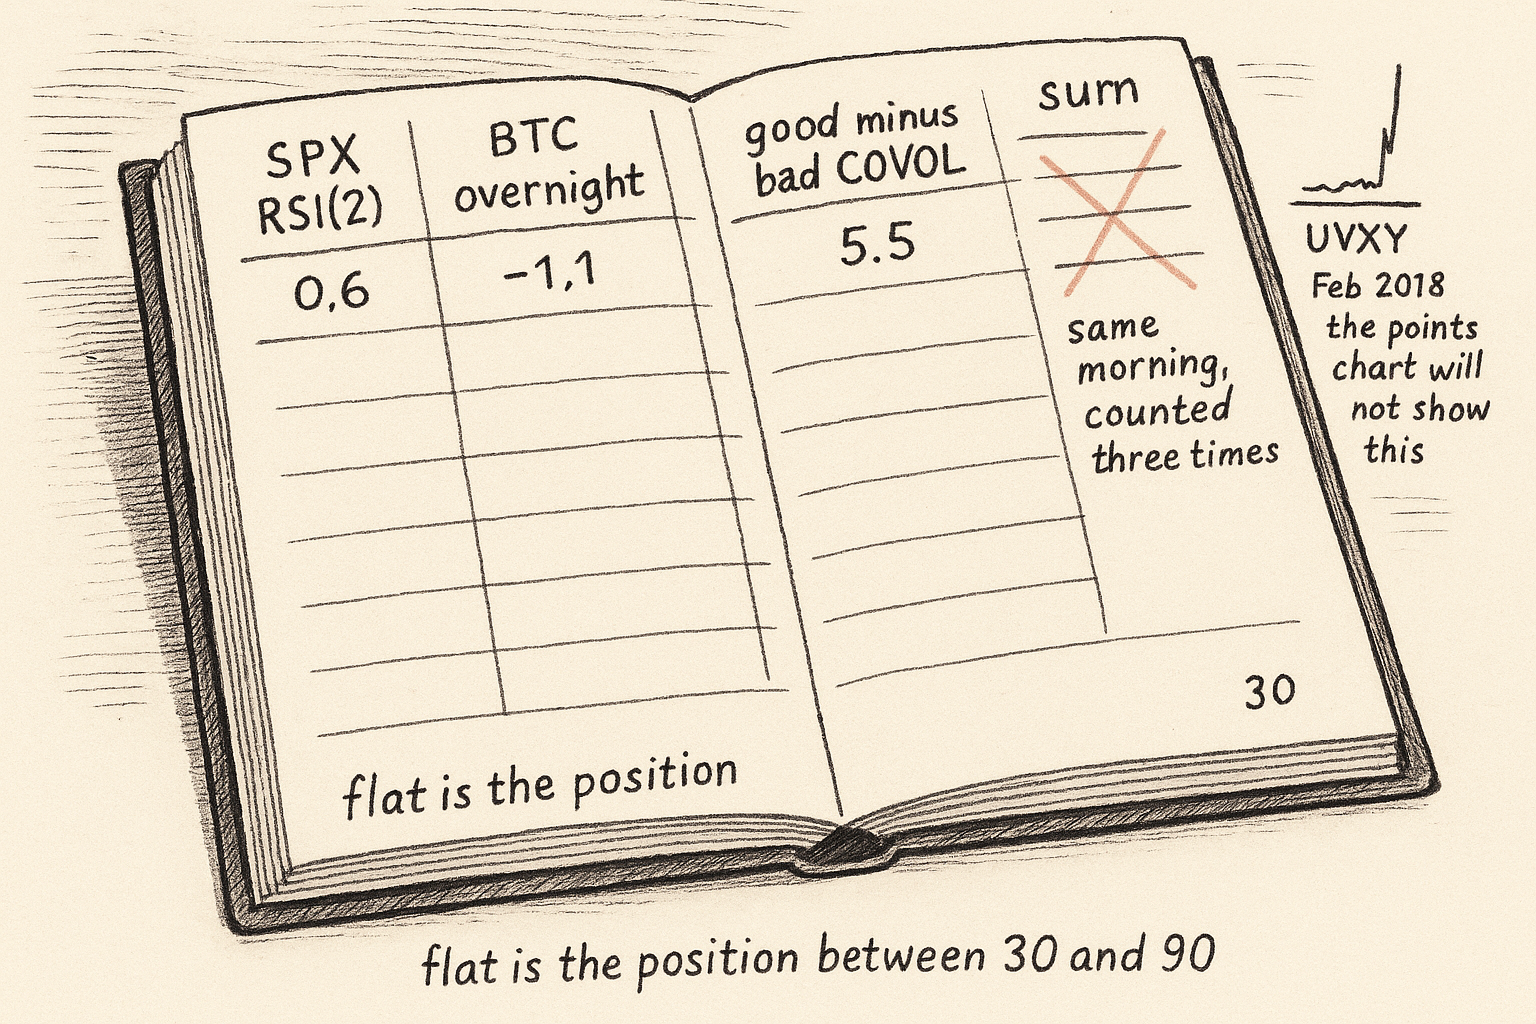
Hanna charges zero commissions on a future he rolls every week. The VIX future pays 1,000 dollars a point, so 224.76 points is 224,760 dollars a contract over seventeen years before the roll, about 13,200 dollars a year, and a 28.06-point drawdown is 28,060 dollars. That drawdown is an in-sample points path. The loss in a gap can exceed it. UVXY, the leveraged product whose long-run chart he uses to show the downhill drift, went from 4,260 to 15,090 in February 2018. He calls it a 354% gain. The ratio 15,090 / 4,260 is 3.54, so 354% is the ending level as a percent of the start, and the increase is 254%. Keep the sentence, and do not put 354 into a return calculation. He also prints a March 2020 spike of as much as 1,300% in that product. A rule that is flat on 55% of days can still be short the morning the gap hits, and the paper does not show the model's position through either spike.
The 30 and the 90 were chosen on the years they are scored on. There is no walk-forward cut. Treat 224.76 points as a gross upper bound.
On the Bitcoin book the 9.7 basis point cost is already inside the information ratio, and a daily sign flip on VIXY pays it on the way in and on the way out. VIXY holds short-dated VIX futures, so the short side collects the contango bleed and owes the gap. The rule trades the sign of the forecast. A one-standard-deviation overnight move and a tick of noise get the same one-dollar position. The 0.0094 magnitude is absent from the size. The out-of-sample window opens after 500 days, around the start of 2020. The non-pandemic slice they report, from 6 May 2023 to 31 December 2023, is eight months, and HAR-ON stays inside the model confidence set on that slice. Eight months is a check.
On the COVOL book the simulation borrows at the Treasury yield. A crypto funding rate in 2021 was a different number, and the paper does not charge it. The 30 and 70 lines are an RSI convention applied to a 0-to-100 scale whose endpoints use the full sample. The truncation zeros half the days before the GARCH fit. If you want the sign of common vol, refit on an expanding range and leave the weight on the crypto index.
At the desk the state is the vector and the trades stay separate. Compute the two-day RSI of the S&P at the cash close and let it set a one-day VX position, sized off a loss worse than 28 points, because the left tail is a gap and a points chart hides the multiplication. At the next open, compute the overnight Bitcoin log return and let it nudge the trading-hour VIX forecast inside a model that already has the VIX lags. Leave the level forecast to those lags. Leave the COVOL difference as a slow weight on a crypto index after the range is rebuilt so you could have known it. Leave the three results in three columns. The system dies when you promote the vector into one short of vol, sized as if the three coefficients were one signal, because three papers on three samples each found a coefficient outside the VIX.
KEY POINTS
- Short the VIX future from the S&P 500's two-day RSI. The bucket at or below 20 booked 178.60 points.
- Drop the VIX's own two-day RSI as a timing state. Its overbought tail booked 90.81 points for the same one-day short.
- Shift the trading-hour VIX forecast by the overnight Bitcoin return. A one-standard-deviation move shifts the predicted log change by 0.0094.
- Keep squared COVOL in the crypto variance regression after the VIX change is included. The full-specification coefficient is 0.38.
- Stay flat when the two-day RSI sits between 30 and 90. Hanna's model is exposed 45% of days, and those cuts were chosen on the sample they are scored on.
References
- Chicken and Egg: Use the SPX to Time the VIX, Not Vice Versa
- Bitcoin's Overnight Returns Forecast the VIX
- Good vs Bad COVOL in Crypto: A Common-Volatility Tilt
- Chicken and Egg: Should you use the VIX to time the SPX?
- Beyond Conventional Sentiment Indicators: Bitcoin's Hidden Potential in VIX Forecasting
- Good versus Bad COVOL in Cryptocurrency Markets: A Measure of Asymmetric Common Volatility
A note on AI. The ideas, research, analysis, and conclusions in this article are my own. I use AI tools to help with editing and wordsmithing, because English is not my first language, and I am not shy about that. AI-generated ideas and AI-assisted writing are not the same thing: the first is empty slop from a generic prompt, the second is a tool for communicating years of real research more clearly. Judge the work by its substance, not by whether software helped polish the prose.