6.53 Bitcoin's Overnight Returns Forecast the VIX
Cut Bitcoin's day at US market hours and only the overnight leg predicts anything. It forecasts the next VIX move (beta minus 0.262) while trading-hour Bitcoin is noise.
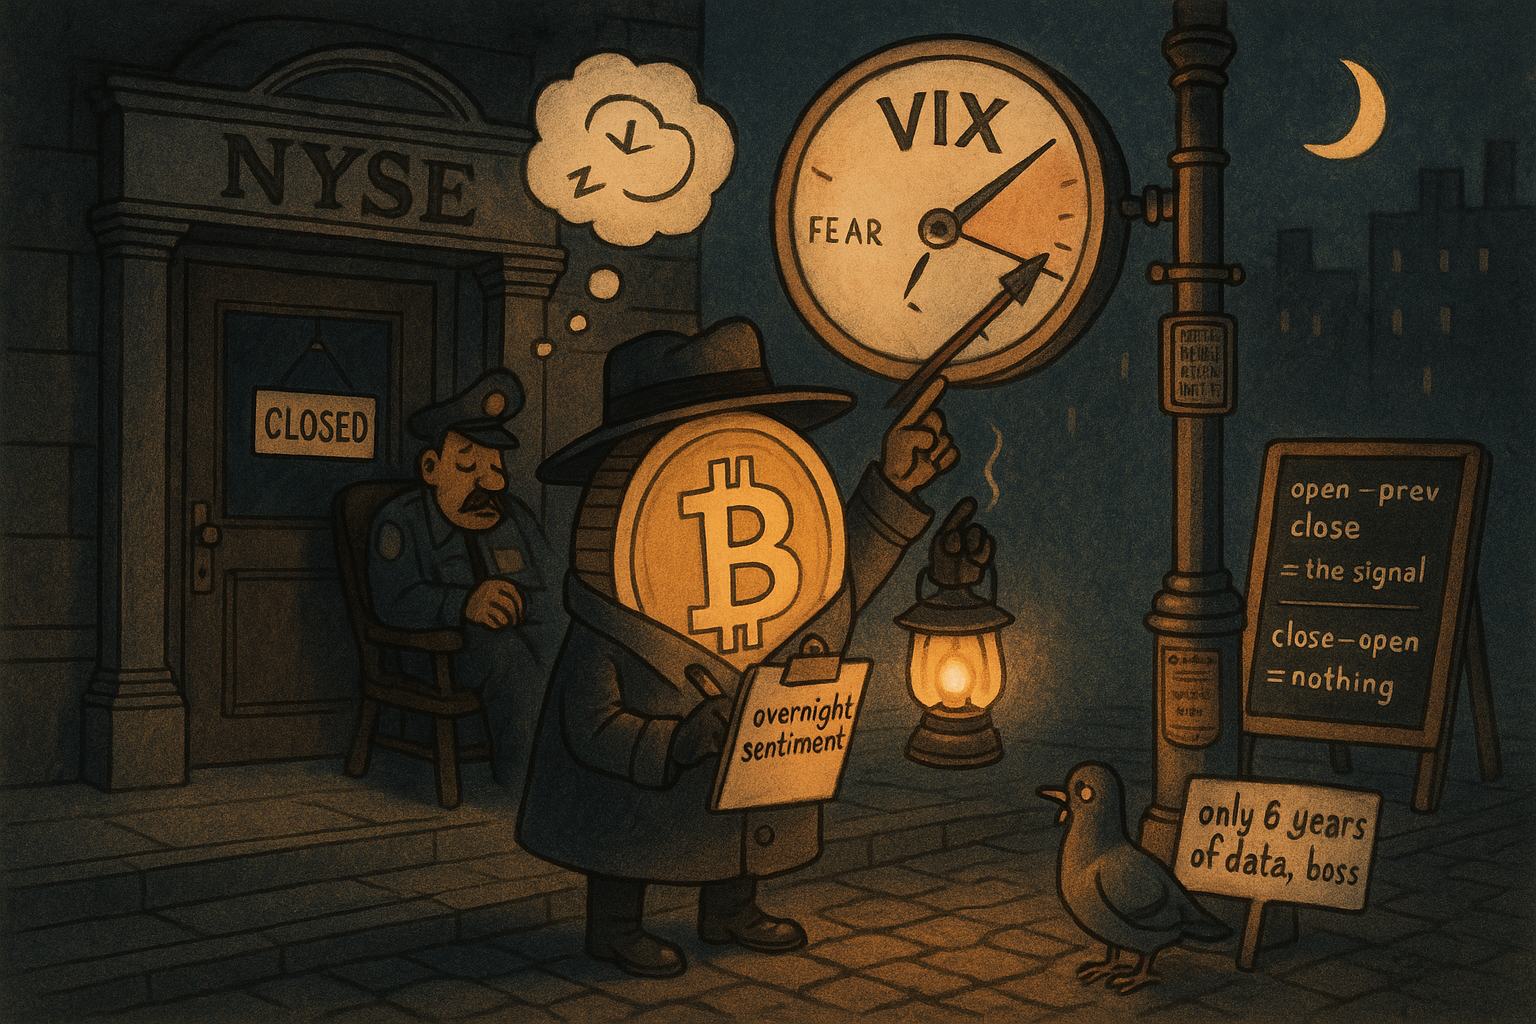
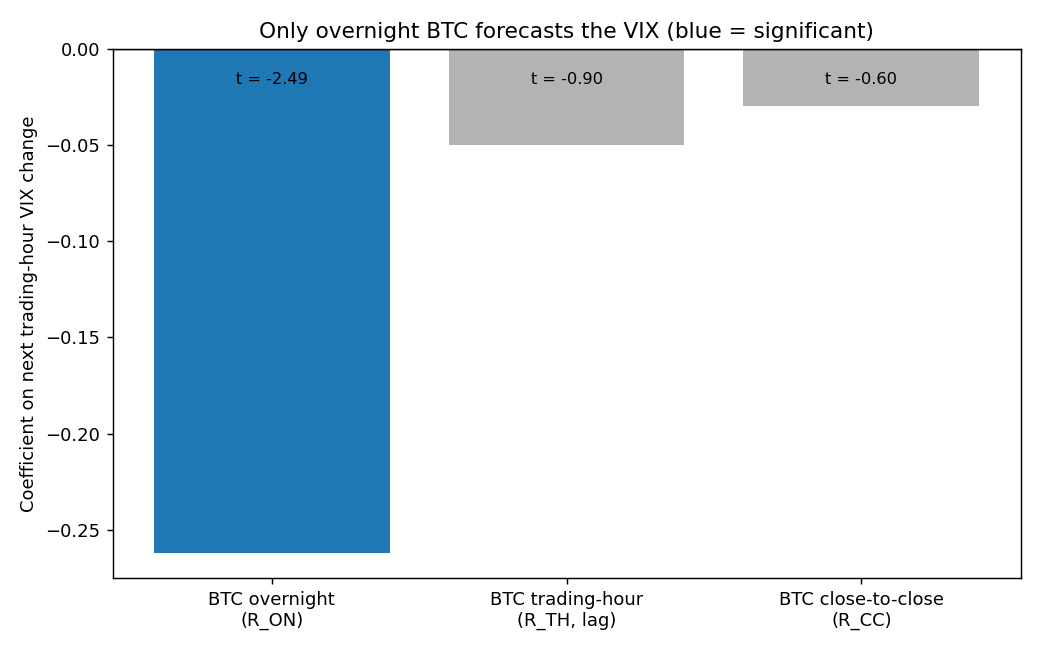
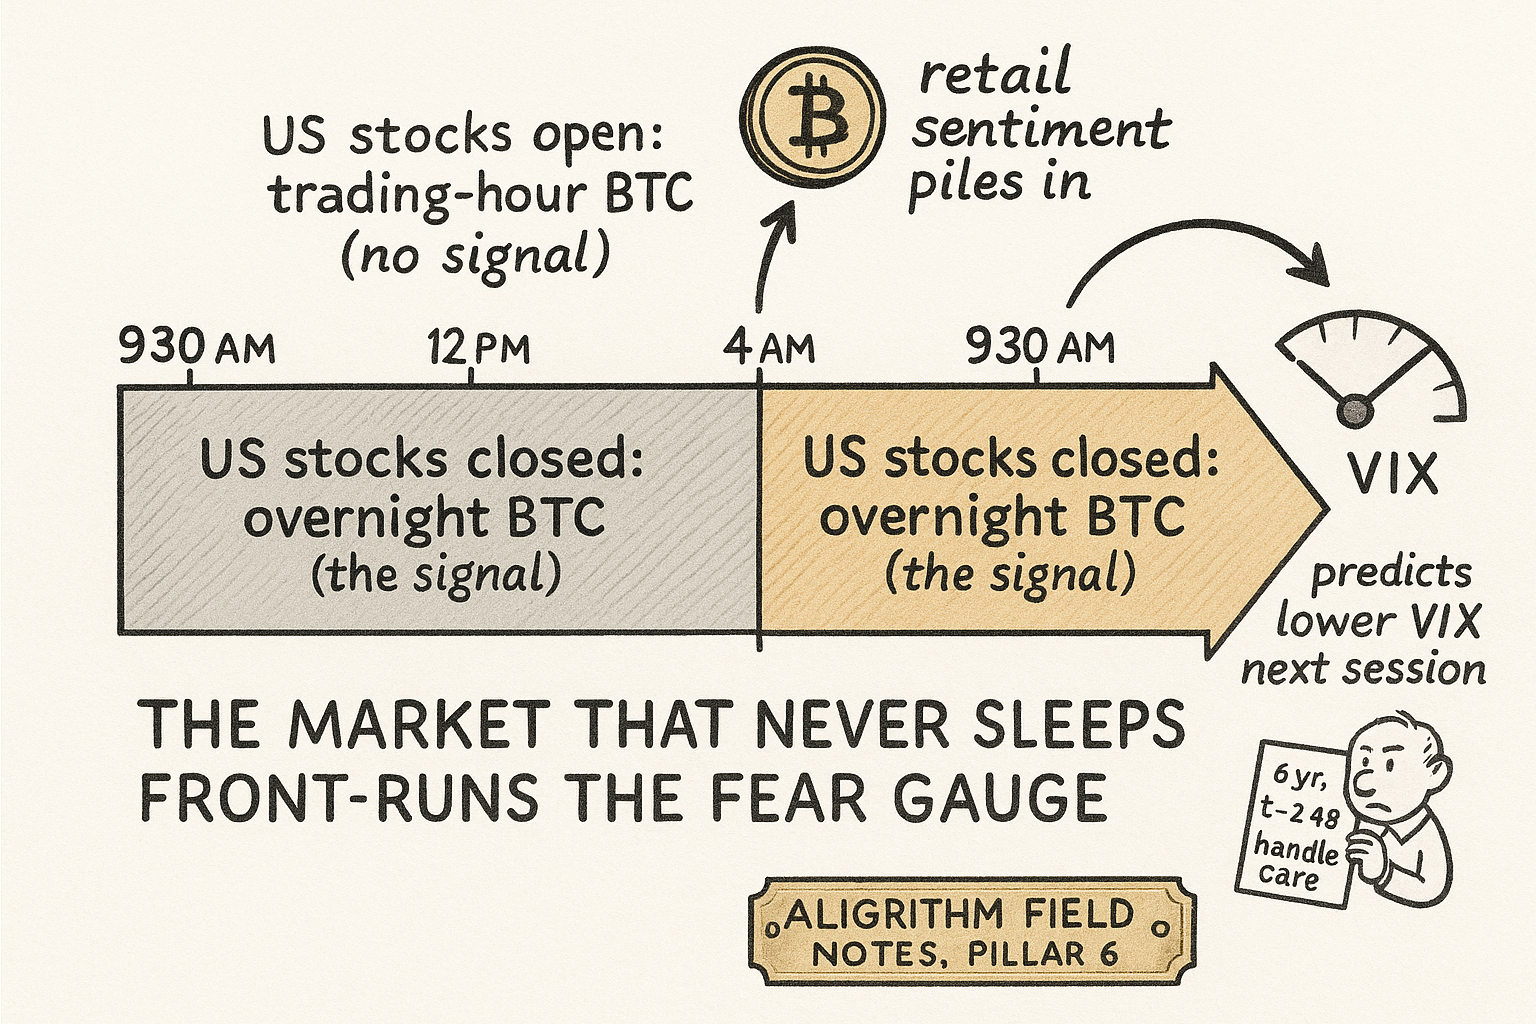
Split one Bitcoin day into two pieces and only one of them predicts anything. The piece that runs while US stock exchanges are closed, from yesterday's 4pm close to today's 9:30am open, carries a signal for tomorrow's VIX. The piece that runs while those exchanges are open carries nothing. Gu, Lin, and Liu ran five-minute Bitcoin data from 2018 to 2023 through that split and found the overnight leg forecasts next-session equity volatility with a coefficient of minus 0.262 (t-statistic minus 2.49), while the trading-hour leg dies the moment you put the overnight leg beside it.
The old article "Chicken and Egg: Use the SPX to Time the VIX, Not Vice Versa" established that the VIX is downstream, a reaction to what the market does rather than a leading gauge of it. This paper adds a second upstream driver from a market that never closes. Bitcoin trades 24/7, so while the S&P sleeps, retail sentiment keeps pricing itself into BTC, and that overnight move front-runs the fear gauge when Wall Street reopens.
The one decomposition that matters
The whole result rides on cutting the Bitcoin day at US-equity boundaries. Take BTC prices, convert from UTC to Eastern Time, and split each day into an overnight session (4pm close to 9:30am open) and a trading-hour session (9:30am to 4pm). Three returns fall out.
$$ R^{CC}_{BTC,t} = \ln BTC^{Close}_t - \ln BTC^{Close}_{t-1} $$ $$ R^{ON}_{BTC,t} = \ln BTC^{Open}_t - \ln BTC^{Close}_{t-1} $$ $$ R^{TH}_{BTC,t} = \ln BTC^{Close}_t - \ln BTC^{Open}_t $$
Close-to-close is the full day. Overnight is open minus yesterday's close, the window while equities are shut. Trading-hour is close minus open, the window while they trade. The three tie together: overnight plus trading-hour equals close-to-close, so the decomposition just partitions the day, it does not throw anything away.
Work a number. Bitcoin closes at 40,000 on day t-1. It opens at 40,400 on day t, so the overnight return is the log of 40,400 over 40,000, which is 0.00995, about plus 1.00%. It then closes day t at 40,100, so the trading-hour return is the log of 40,100 over 40,400, which is minus 0.00746, about minus 0.74%. The close-to-close return is the log of 40,100 over 40,000, about plus 0.25%, and it equals the overnight plus the trading-hour, 1.00 minus 0.74. That specific shape, a positive overnight move that partly reverses during the day, is the sentiment fingerprint the paper hunts for.
Why the overnight leg is sentiment
Across the full sample, overnight Bitcoin returns average plus 0.093% and trading-hour returns average minus 0.029%, a gap of 0.122% that repeats day after day. Positive overnight, negative during the day. That is the same pattern Berkman and Aboody documented in stocks, where retail traders pile in at the open and pay for it, and the paper imports it to Bitcoin as a sentiment test.
The clean test sorts days by retail attention and watches what happens to each leg. Attention is measured two ways, Google search volume for "Bitcoin" and the count of unique active Bitcoin addresses, each taken as a deviation from its own trailing monthly average. Sort into deciles, compare the top attention decile to the bottom, and the overnight leg lights up while the trading-hour leg stays dark.
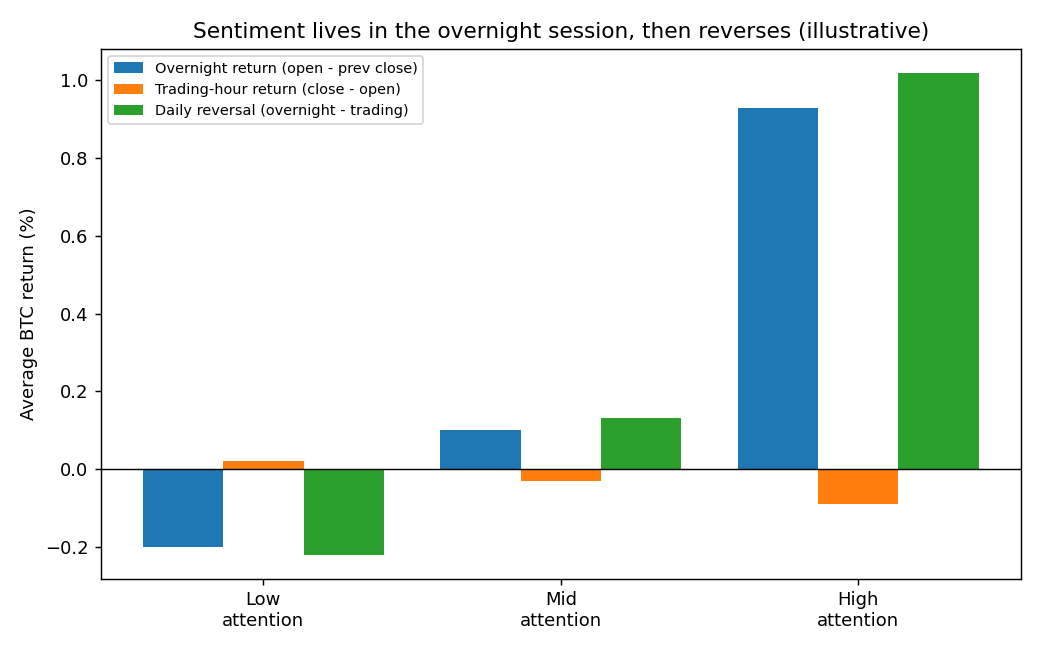
The high-minus-low spread in overnight returns is 1.133% (t-statistic 2.072) using Google search and 0.987% (t-statistic 2.033) using active addresses. Both clear significance. The trading-hour spread is the opposite: minus 0.114% (t-statistic minus 0.361) and minus 0.288% (t-statistic minus 0.880), neither distinguishable from zero. The daily reversal spread, overnight minus trading-hour, comes in at 1.247% and 1.275%, both significant. Read plainly: when retail piles into Bitcoin overnight, the overnight return jumps and then gives part of it back during the day, and the jump-and-reverse grows with how much attention the crowd is paying. That is overreaction, and overreaction is sentiment.
Hold the skepticism for a second. Those t-statistics sit around 2.0 to 2.3, which is barely across the conventional line, on six years of data. The pattern is real in this sample, but it is not the kind of overwhelming signal that survives every subperiod without a scratch.
Overnight Bitcoin predicts the VIX, trading-hour Bitcoin does not
Now point the overnight leg at the fear gauge. The paper regresses the next trading-hour change in log VIX on contemporaneous overnight Bitcoin returns, controlling for S&P 500 futures returns (both overnight and lagged trading-hour), contemporaneous overnight VIX changes, three lags of VIX changes, holiday dummies for the first day after a market closure, and FOMC announcement dummies.
$$ \Delta \ln V^{TH}_t = \alpha + \beta_1 R^{ON}_{BTC,t} + \beta_2 R^{TH}_{BTC,t-1} + \text{(SPX futures, VIX lags, holiday, FOMC)} + e_t $$
The left side is the trading-hour change in log VIX, how much the fear gauge moves once equities reopen. Beta-one is the payload: the loading on Bitcoin's overnight return. Beta-two is the loading on lagged trading-hour Bitcoin, the leg that turns out to be noise. Everything in the parenthetical is a control, there to make sure the Bitcoin signal is not just repackaged S&P futures movement, a holiday effect, or a Fed-day effect.
Beta-one comes out at minus 0.262 with a t-statistic of minus 2.49. Negative and significant: a stronger overnight Bitcoin move (more sentiment) predicts a lower VIX in the next session. Add the S&P futures controls and holiday effects and it barely budges, minus 0.255 (t-statistic minus 2.44). Add FOMC effects and it holds. And once the overnight leg is in the regression, the lagged trading-hour Bitcoin coefficient goes insignificant. The predictive information sits entirely in the hours when US equities are closed.
The economic size is modest, and the paper is honest about it.
$$ \text{effect of } 1\sigma = \frac{0.036 \times 0.262}{0.072} = \frac{0.0094}{0.072} \approx 13\% $$
Bitcoin overnight returns have a standard deviation of about 0.036. Multiply by the coefficient 0.262 and a one-standard-deviation move shifts the predicted VIX change by 0.0094. The standard deviation of the trading-hour VIX change is 0.072, so 0.0094 is 13% of it. One big overnight swing in Bitcoin shaves 13% off the typical size of the next VIX move. That is a real dent, not a market-mover. This forecasts the change in the VIX, not its level, and the fraction of variance explained is small.
Out of sample, and the workhorse model
In-sample coefficients are cheap. The paper runs a proper out-of-sample horse race with a 500-day rolling window (a third of the sample), producing one-day-ahead forecasts. Two model families compete: vector autoregressions (VAR) that model the overnight and trading-hour VIX legs jointly, and a heterogeneous autoregressive model (HAR) that predicts the VIX level from its own recent history at three horizons.
$$ \ln V^C_t = \alpha + \beta_1 \ln V^C_{t-1} + \beta_2 \ln V^{C(5)}_{t-1} + \beta_3 \ln V^{C(22)}_{t-1} + \delta_1 R^{ON}_{SPF,t} + \delta_2 R^{TH}_{SPF,t-1} + Z_t + e_t $$
The HAR predicts today's log VIX from yesterday's log VIX, its 5-day average, and its 22-day average, the daily/weekly/monthly memory horizons, plus S&P futures returns. The Z term is where the Bitcoin signal plugs in. Set Z to the overnight Bitcoin return and you get HAR-ON; set it to trading-hour or close-to-close Bitcoin and you get the alternatives. HAR-ON wins. It posts the lowest forecast errors, and in the Model Confidence Set test it reaches a p-value of 1.000 across all four loss metrics, meaning you cannot statistically exclude it from the set of best models under any of them. The Diebold-Mariano tests add the kicker: close-to-close Bitcoin returns are significantly worse than their overnight counterparts. Blending the useful overnight leg with the useless trading-hour leg into a single daily number destroys the signal.
Does it make money?
The VIX is not tradable, so the paper trades VIXY, the short-term VIX futures ETF, with a plain directional rule. At each close, go one dollar long if the model predicts the VIX rises, one dollar short if it predicts a fall, and unwind before the next close. Costs are charged at 9.7 basis points per dollar traded. Performance is graded against buy-and-hold on two metrics.
$$ IR = \frac{\text{mean(strategy return} - \text{buy-and-hold)}}{\text{sd(strategy return} - \text{buy-and-hold)}}, \qquad CER = \mu - \tfrac{1}{2}\gamma\sigma^2 $$
The information ratio is the average return above buy-and-hold divided by the standard deviation of that excess, a Sharpe-style score for the timing skill. The certainty-equivalent return is the return a risk-averse investor would accept for certain instead of the risky strategy, with gamma the risk aversion; the CER gain is the strategy's CER minus the benchmark's. Worked out, HAR-ON with daily rebalancing lands an annualized information ratio of 0.986, with CER gains of 1.20 for a low-risk-aversion investor (gamma equals 1) and 0.519 for a high-risk-aversion one (gamma equals 3). Swap VIXY for the VXX ETN and HAR-ON still posts 0.894. The semi-daily VAR versions trail, VAR3-ON at 0.406 on VIXY and VAR2-ON at 0.322 on VXX.
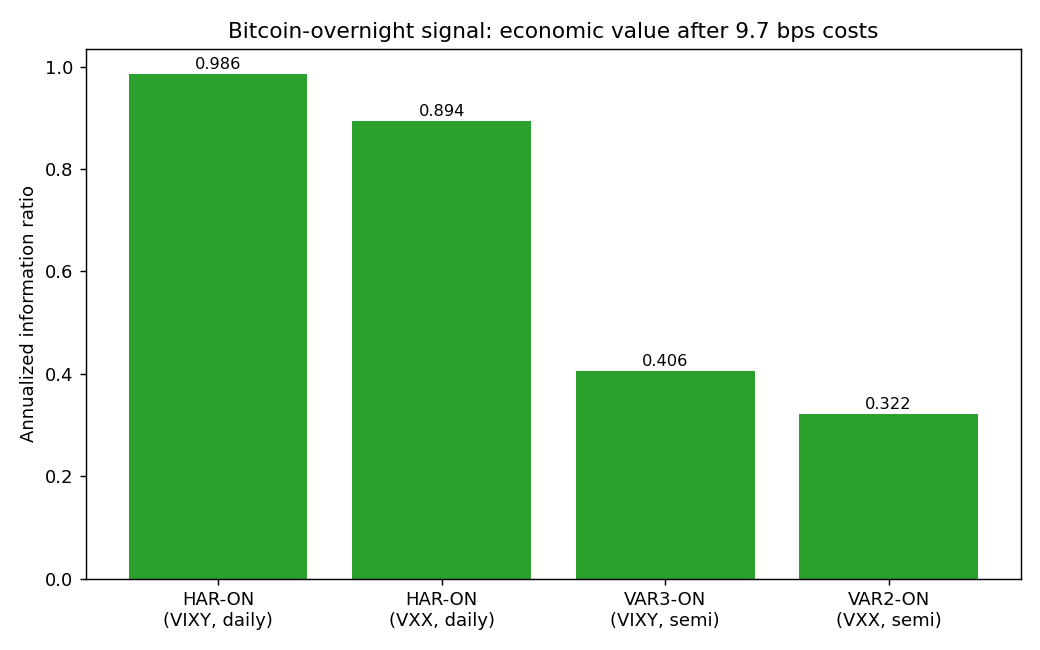
An information ratio near one after costs is a strong number. Read what it is measured against before you get excited: excess return over buy-and-hold VIXY. Buy-and-hold VIXY is a structural bleeder, the same downhill-forever instrument the old article "Chicken and Egg: Use the SPX to Time the VIX, Not Vice Versa" built its whole short-VX case around. A directional timer that goes short more often than long will beat a guaranteed loser, and part of this information ratio is that tailwind rather than pure VIX-direction skill.
What to distrust
The signal is real in this window and thin everywhere it counts, so price it before you believe it.
Six years, one of them COVID. The sample runs January 2018 to December 2023, and the out-of-sample period opens in 2020, right into the largest volatility shock in the series. The paper splits pandemic (through May 2023) from post-pandemic and reports the edge holds in both, which helps, but the post-pandemic slice is barely seven months. The sentiment sorts carry t-statistics around 2.0 and the headline regression a t-statistic of 2.49. Cross the multiple-testing bar the old article "What a Market Price Actually Is: Capital-Weighted Consensus and the Brier Skill Score Gate" insists on, and a t of 2.49 on a single hand-chosen predictor is suggestive, not settled.
The overnight window is a construction, not a law. Bitcoin trades continuously, so "overnight" is defined by a market Bitcoin has nothing to do with, the US equity session. The choice is motivated (retail sentiment leaks in when stocks are closed) but it is still a researcher's cut of a 24/7 series, and the result depends on that cut lining up the way it does over these particular years.
The trade is timing a decaying instrument. VIXY and VXX bleed by design, so the strategy's real job is deciding when to be short the bleed and when to duck a spike, exactly the short-volatility problem with the fat left tail. The paper charges 9.7 basis points and rebalances daily, but a directional short-vol book is one gap away from a very bad day, and an information ratio computed on daily returns understates that. Sizing and a hard stop are the difference between collecting the premium and getting run over, and this paper models neither.
Where this connects
This sits directly on top of the old article "Chicken and Egg: Use the SPX to Time the VIX, Not Vice Versa." That piece said the VIX is an effect, best predicted by reading its causes, and the tradable form is timing a short-vol book. This paper hands you a second cause, Bitcoin's overnight sentiment, that fires before the S&P even opens, and it trades the same kind of VIX ETP with the same directional logic. Two assets, one message: the fear gauge is downstream of everything.
It also extends the belief-pricing thesis of the old article "What a Market Price Actually Is: Capital-Weighted Consensus and the Brier Skill Score Gate." A Bitcoin overnight print is a capital-weighted vote by whoever is awake and trading while the US sleeps, and the paper's whole claim is that this vote carries sentiment information not yet in equity prices. And it rhymes with the cross-market logic of the old article "Why FX Traders Must Watch Gold, Rates, and Equities," where the driver of an instrument lives outside it. The VIX has no life of its own; its next move is written partly in an asset that trades while its own market is dark. Watch the market that never closes, and read the fear gauge before it opens.
KEY POINTS
- Split the Bitcoin day at US-equity hours: overnight is open minus prior close, trading-hour is close minus open. Overnight plus trading-hour equals the full close-to-close day, so the cut partitions the day without discarding data.
- The overnight leg is a retail-sentiment measure. Overnight returns average plus 0.093% against minus 0.029% for trading-hour, and the overnight return rises with retail attention (high-minus-low spread 1.133% by Google search, 0.987% by active addresses) while the trading-hour leg shows no attention pattern.
- Overnight Bitcoin predicts the next-session VIX change with a coefficient of minus 0.262 (t-statistic minus 2.49); more overnight sentiment forecasts a lower VIX. Once overnight is included, lagged trading-hour Bitcoin goes insignificant.
- The economic size is modest: a one-standard-deviation overnight move cuts the standard deviation of the next VIX change by about 13%, and it forecasts the change, not the level.
- Out of sample, the HAR model augmented with overnight Bitcoin (HAR-ON) wins, reaching a Model Confidence Set p-value of 1.000 on all four loss metrics. Close-to-close Bitcoin is significantly worse, so mixing the useful overnight leg with the useless day leg destroys the signal.
- Trading VIXY directionally on the forecast, HAR-ON posts an annualized information ratio of 0.986 after 9.7 bps costs (0.894 on VXX), with the semi-daily VAR versions trailing at 0.32 to 0.41.
- Distrust the magnitude. Six years with COVID in the out-of-sample window, marginal t-statistics near 2, an overnight window defined by a market Bitcoin does not trade in, and an information ratio measured against a structurally bleeding ETF that flatters any short-biased timer.
A note on AI. The ideas, research, analysis, and conclusions in this article are my own. I use AI tools to help with editing and wordsmithing, because English is not my first language, and I am not shy about that. AI-generated ideas and AI-assisted writing are not the same thing: the first is empty slop from a generic prompt, the second is a tool for communicating years of real research more clearly. Judge the work by its substance, not by whether software helped polish the prose.