6.52 Chicken and Egg: Use the SPX to Time the VIX, Not Vice Versa
Everyone reads the VIX to time the S&P. Rob Hanna ran it both ways: SPX oversold readings predict VIX futures far better than the reverse, and the real trade is a filtered short-VX book.
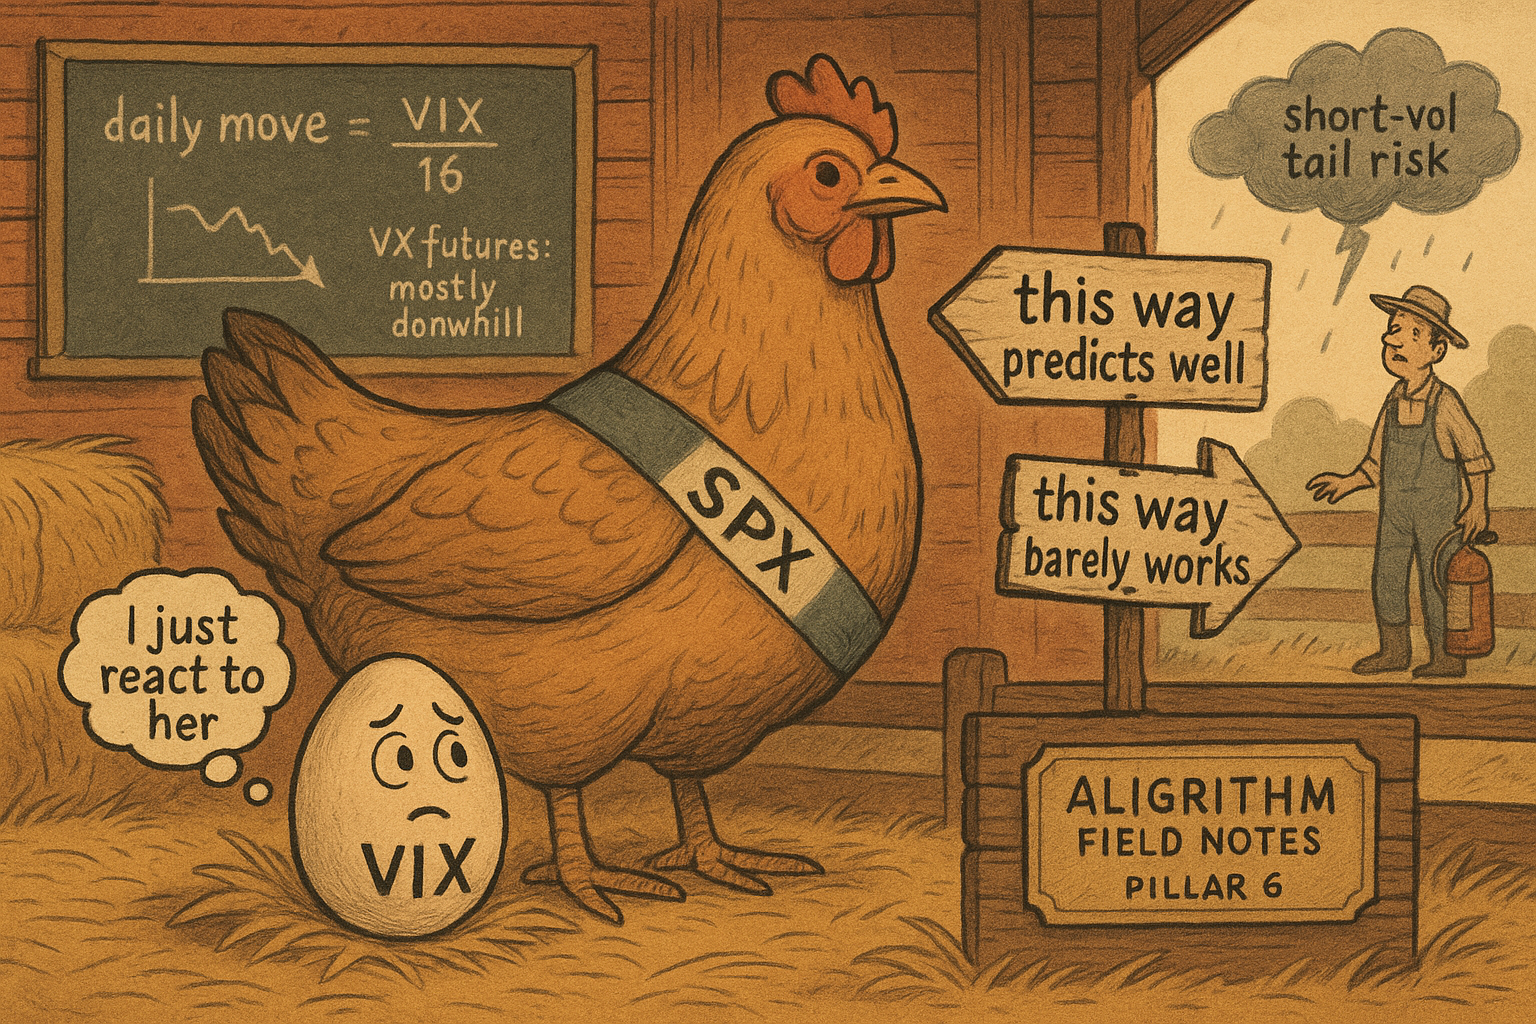
Twenty years of retail research points the arrow one way. You read the VIX, and the VIX tells you where the S&P 500 is going. Oversold VIX means complacency, sell stocks; spiked VIX means panic, buy the dip. Connors built a cottage industry on it, and every trading forum still runs some version of the "VIX says buy" screenshot. Rob Hanna ran the tests both directions and found the arrow points the other way. SPX action predicts the VIX better than the VIX predicts the SPX. And the tradable version of that is not a stock-timing signal at all, it is a filter for shorting VIX futures.
The old article "Volatility-Regime Filter for Any Strategy" already made the softer version of this point: volatility is the thing you can measure with a small sample and trust, while direction needs hundreds of trades before the number means anything. This piece takes it further. It says the predictable object in the SPX/VIX pair is the volatility instrument itself, and the best signal for it is an overbought/oversold reading on the index, not on the fear gauge.
The direction everyone runs backward
The VIX exists because the SPX moves, not the other way around. It measures 30-day implied volatility priced into SPX options, pulling from contracts in the 23-to-37-day window. When the market falls, traders bid up portfolio protection and option premiums rise, so the VIX rises. When the market drifts up quietly, nobody pays up for puts and the VIX sags. From 1990 to 2023 the closing VIX ranged from 9.14 to 82.69, and every spike lined up with an SPX drawdown: 1998, 2000-2003, 2008, 2020.
That causal order matters. The VIX is a reaction to SPX price action, and option traders react rather than anticipate. If the VIX is downstream of the SPX, then reading the VIX to forecast the SPX is reading the effect to predict the cause. Reading the SPX to forecast the VIX is reading the cause to predict the effect. Hanna tests exactly that, and the data agrees with the plumbing.
What a VIX reading actually says
Before testing anything, get literal about what a VIX number means, because most people misread it. The VIX is annualized implied volatility. To turn it into an expected daily move you divide by the square root of trading days in a year.
$$ \sigma_{\text{daily}} \approx \frac{\text{VIX}}{\sqrt{252}} = \frac{\text{VIX}}{15.875} \approx \frac{\text{VIX}}{16} $$
This is the "Rule of 16." The square root of 252 trading days is 15.875, near enough to 16. A VIX of 16 prices in daily SPX moves of about 1%, meaning roughly two thirds of days stay under 1% and a third exceed it. Work the rest: a VIX of 32 implies 2% daily moves, 48 implies 3%, and for the VIX to sit at 80 the options market has to be pricing 5% daily moves. Realized 2% days in a row are rare, and stringing them together is rarer still, which is why a VIX above 30 or 40 does not last. High readings require high realized volatility to sustain them, and realized volatility mean-reverts fast. That single fact, that the VIX cannot stay elevated unless the SPX keeps thrashing, is the engine behind everything below.
RSI(2), and why two periods instead of fourteen
Hanna measures overbought/oversold with Wilder's RSI, but at a 2-day lookback, not the textbook 14.
$$ \text{RSI} = 100 - \frac{100}{1 + RS}, \qquad RS = \frac{\text{average gain over } n \text{ bars}}{\text{average loss over } n \text{ bars}} $$
RSI runs 0 to 100. When recent bars are mostly up, average loss shrinks, RS blows up, and RSI pushes toward 100 (overbought). When recent bars are mostly down, RSI collapses toward 0 (oversold). Work a 2-day example on the SPX. Say the last two daily changes were +0.2% and minus 1.8%. Average gain is 0.2 divided by 2, so 0.1; average loss is 1.8 divided by 2, so 0.9. Then RS is 0.1 over 0.9, about 0.111, and RSI is 100 minus 100 divided by 1.111, which is 100 minus 90, so RSI(2) equals 10. Deeply oversold after one ugly day.
The short lookback is deliberate, and Hanna is honest that it is a choice rather than a law. A 14-period RSI parks almost everything between 30 and 70, so the oversold and overbought tails barely fire. A 2-period RSI spends real time below 20 and above 80, which gives cleaner delineation between buckets. It also makes the signal a mean-reversion detector, not a trend gauge. Treat the 2 as tuned to short-horizon reversion, and hold the thought when the overfitting question comes up later.
Test one: the VIX is no better than the SPX at timing the SPX
Start with the long horizon. Hanna runs three simple SPX trend filters (price above where it closed a year ago, price above the 200-day average, and the 50-day above the 200-day golden cross), goes to cash in Fed funds otherwise, and compares to buy-and-hold. Then he builds the mirror image on the VIX (long SPX when VIX is below its year-ago level, below its 200-day, or its 50-day below its 200-day) since the VIX runs inverse.
Buy-and-hold returned 7.91% a year with a brutal 56.78% max drawdown, a CAR/MDD of 0.14. Two of the three SPX filters beat that total return, and all three cut drawdown hard; the "SPX up year" filter posted 7.97% at a 25.04% drawdown, CAR/MDD 0.32, more than double the return-per-unit-of-pain. The VIX filters did nothing useful. Every one lagged buy-and-hold on net profit and matched or beat it on CAR/MDD only by accident, all landing at 0.11 to 0.13. Long-term VIX levels do not filter the SPX.
The short horizon tells the same story with the RSI(2) readings, 2007 to 2023. An SPX RSI(2) at or below 20 (no long-term filter) led to a next-day win rate of 57.66% and a profit factor of 1.41; an SPX RSI(2) above 80 dropped to 51.5% wins and a profit factor of 0.91. The overbought/oversold split is sharp, and it gets more extreme in downtrends, where oversold below the 200-day averaged +0.32% next day (profit factor 1.53) and overbought averaged minus 0.19% (profit factor 0.71). Now swap in RSI(2) of the VIX to time the SPX. An oversold VIX (RSI at or below 20) produced a 55.51% win rate and a 1.14 profit factor, against a no-filter baseline of 54.79% and 1.11. That is noise. An overbought VIX carried a little edge, but the marquee "VIX oversold, buy stocks" trade barely clears doing nothing.
The easier question: where is VX headed
Here is the move most traders miss. You do not have to forecast the SPX at all. Ask the easier question, where are VIX futures going, because they have a structural downhill tilt that the SPX does not.
VIX itself is not tradable. VIX futures (ticker VX) are, and they bleed. Hanna builds a continuous VX contract rolled the Tuesday before each Wednesday expiry, and it falls from a roll-adjusted 229.9 on October 31, 2006 to 13.05 at the end of 2023. Counter-trend spikes are violent, but the recovery to new lows is fast, and that asymmetry is the whole edge.
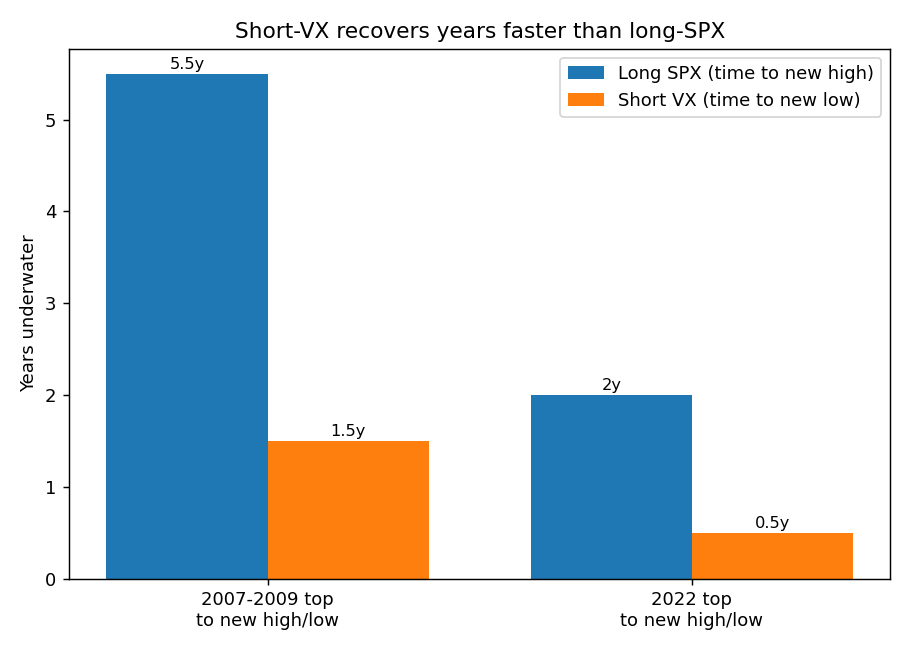
Look at the two bear markets. In 2007, the SPX topped in October and did not make a new high until May 2013, roughly five and a half years underwater. VX bottomed in May 2008, seven months after the SPX top, then made a new low in February 2010, about a year and a half. In 2022, the SPX spent two years getting back to a new high; VX barely went six months without a new low and was printing fresh lows in July 2022 before the SPX had even bottomed. A short-vol position does not need a rally to recover. It just needs the market to calm down, and markets calm down faster than they climb back. That is the same "downside persistency" the abstract leans on, and it is why a short-VX book spends far less time in drawdown than a long-SPX book.
Filtering the short-VX trade: SPX RSI beats VIX RSI
Shorting VX and holding is profitable but ugly. Over 2007-2023, a naked short of one VX contract captured 213.52 points with a 68.86-point max drawdown, profit factor 1.13. The question is whether an overbought/oversold filter improves it, and whether the filter should read the SPX or the VIX. Since VX trends down, a positive number below means VX fell (good for the short).
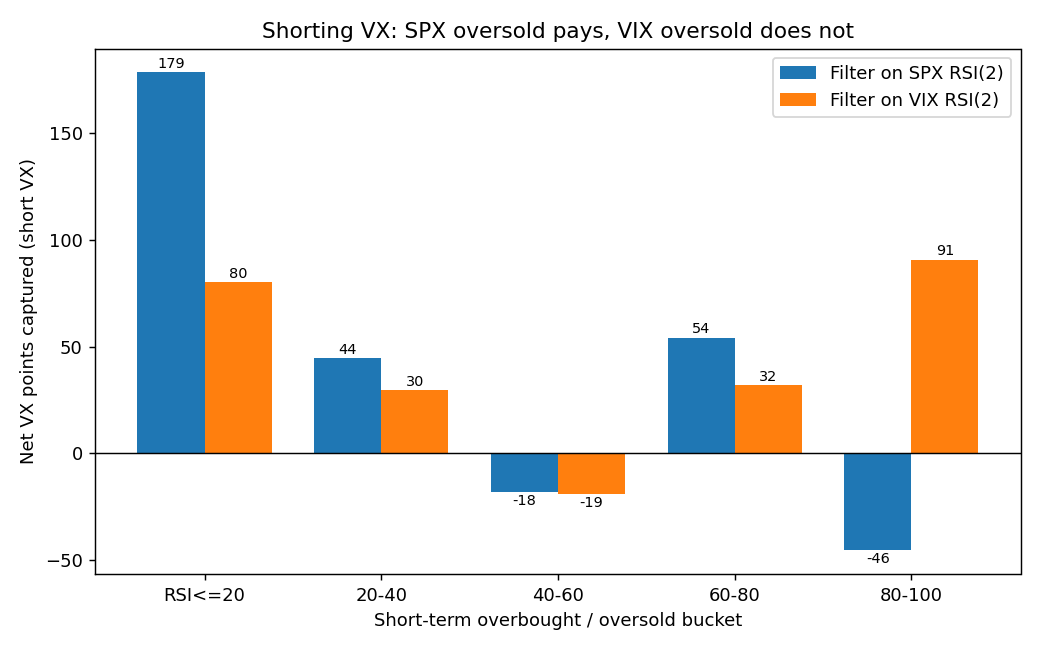
Filtering on SPX RSI(2), an oversold SPX (RSI at or below 20) let the short capture 178.6 points with a max drawdown of only 21.04, a 62.9% win rate, and a recovery factor of 8.49. Shorting VX whenever SPX RSI(2) was at or below 40 and sitting out otherwise captured more than the full 213.52 downside points while being in the market only 34% of the time. And an overbought SPX (RSI above 80) flipped the sign: VX rose 45.57 points, meaning short-term SPX strength is a dangerous time to be short vol and a candidate for going long VX.
Now filter on VIX RSI(2) instead. The oversold-VIX short captured 80.23 points and the overbought-VIX short 90.81, both roughly half the SPX oversold result, and the muddle is obvious in the chart: the VIX filter's biggest bar sits in the overbought bucket, the opposite end from where the SPX filter pays. Reading the SPX gives you a clean, monotonic edge and a usable long-VX signal on the other tail. Reading the VIX gives you a weaker, scrambled one.
$$ \text{Profit Factor} = \frac{\text{gross gains}}{\text{gross losses}}, \qquad \text{Recovery Factor} = \frac{\text{net profit}}{\text{max drawdown}} $$
Both metrics grade reward against risk. Profit factor above 1 means the strategy made money; the SPX-oversold short scored 1.47 against the naked short's 1.13. Recovery factor is net profit divided by the worst peak-to-trough loss, so the SPX-oversold short's 178.6 points over a 21.04-point drawdown gives 8.49, against 3.1 for the naked short. Higher on both means you earned more per unit of pain and dug a shallower hole to do it.