4.47 Building a COT Index System
A raw commercial net of -60,000 contracts is meaningless until you scale it against its own range. The COT index maps it to 0-100, turning the hedgers' lead into a bounded contrarian signal.
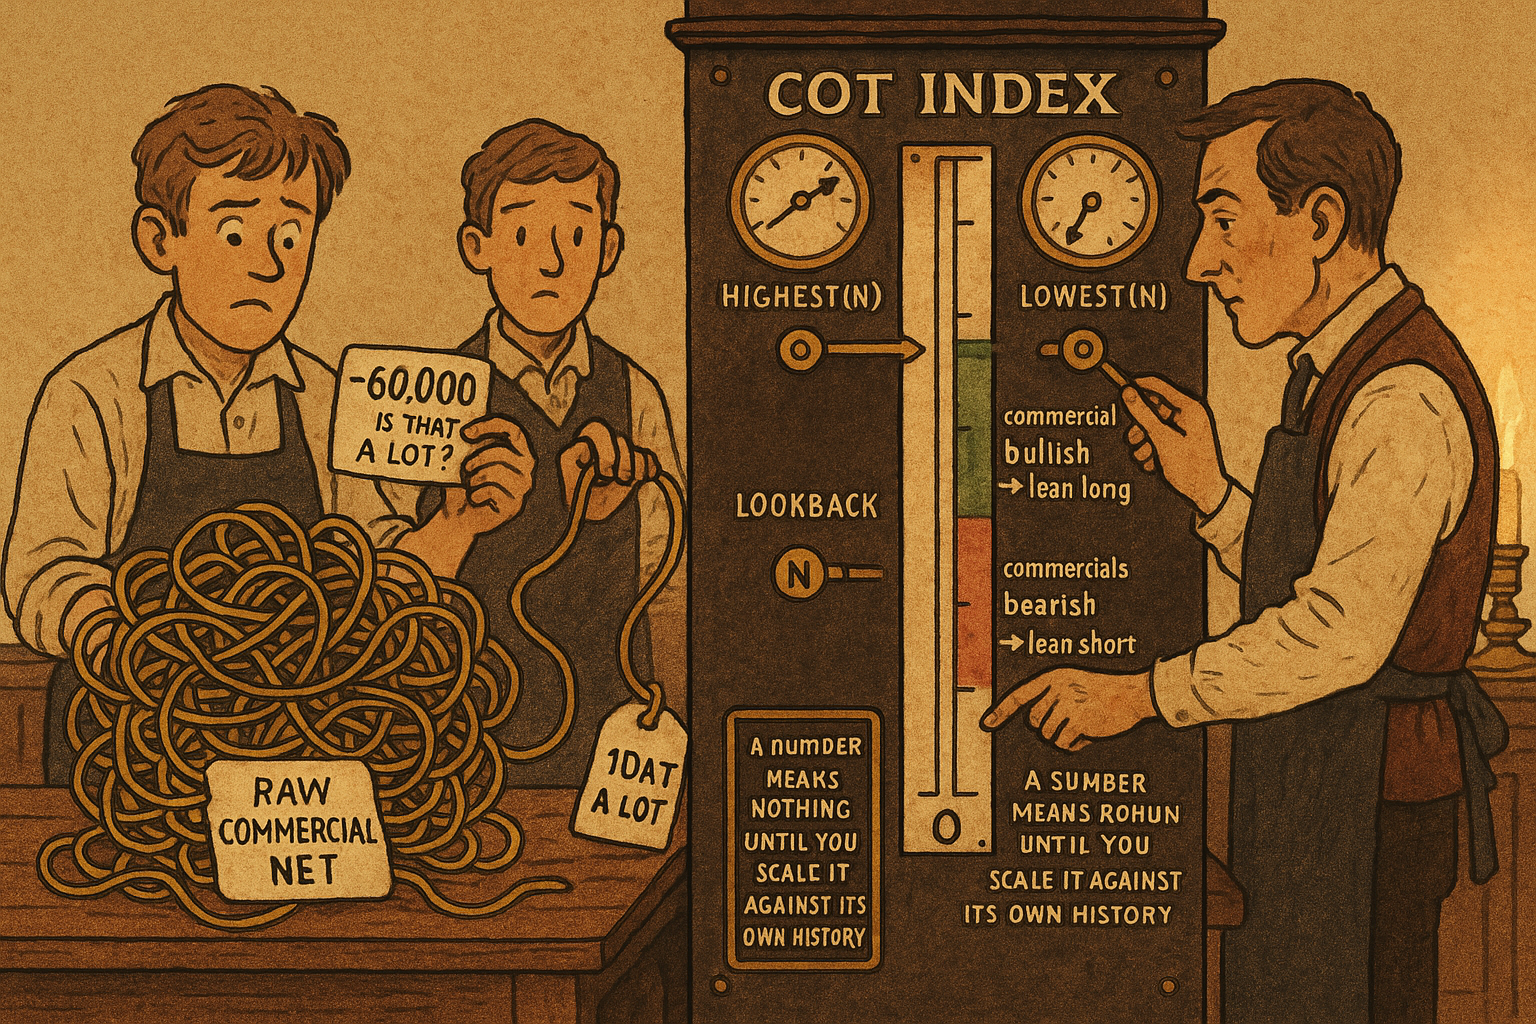
The raw commercial net position is unusable as a signal, and the reason is the one that kills most positioning data. "Commercials are net short 60,000 contracts" means nothing on its own. Is 60,000 a lot? In a market that routinely runs net short 200,000, it is nothing. In a market that has never been more short than 50,000, it is an off-the-charts extreme. The number only has meaning against the market's own history, and that is exactly the problem normalization solves. To trade commercial positioning you stop trading the level and start trading where the level sits inside its own historical range.
This is the stationarity problem from "How to Build Stationary Indicators from Non-Stationary Prices," applied to positioning instead of price. The raw net wanders with the size of the market, the number of participants, and the era. A bounded oscillator that rescales the net against its recent extremes gives you a number that means the same thing in every market and every decade, which is the only kind of number you can put a threshold on.
The COT index
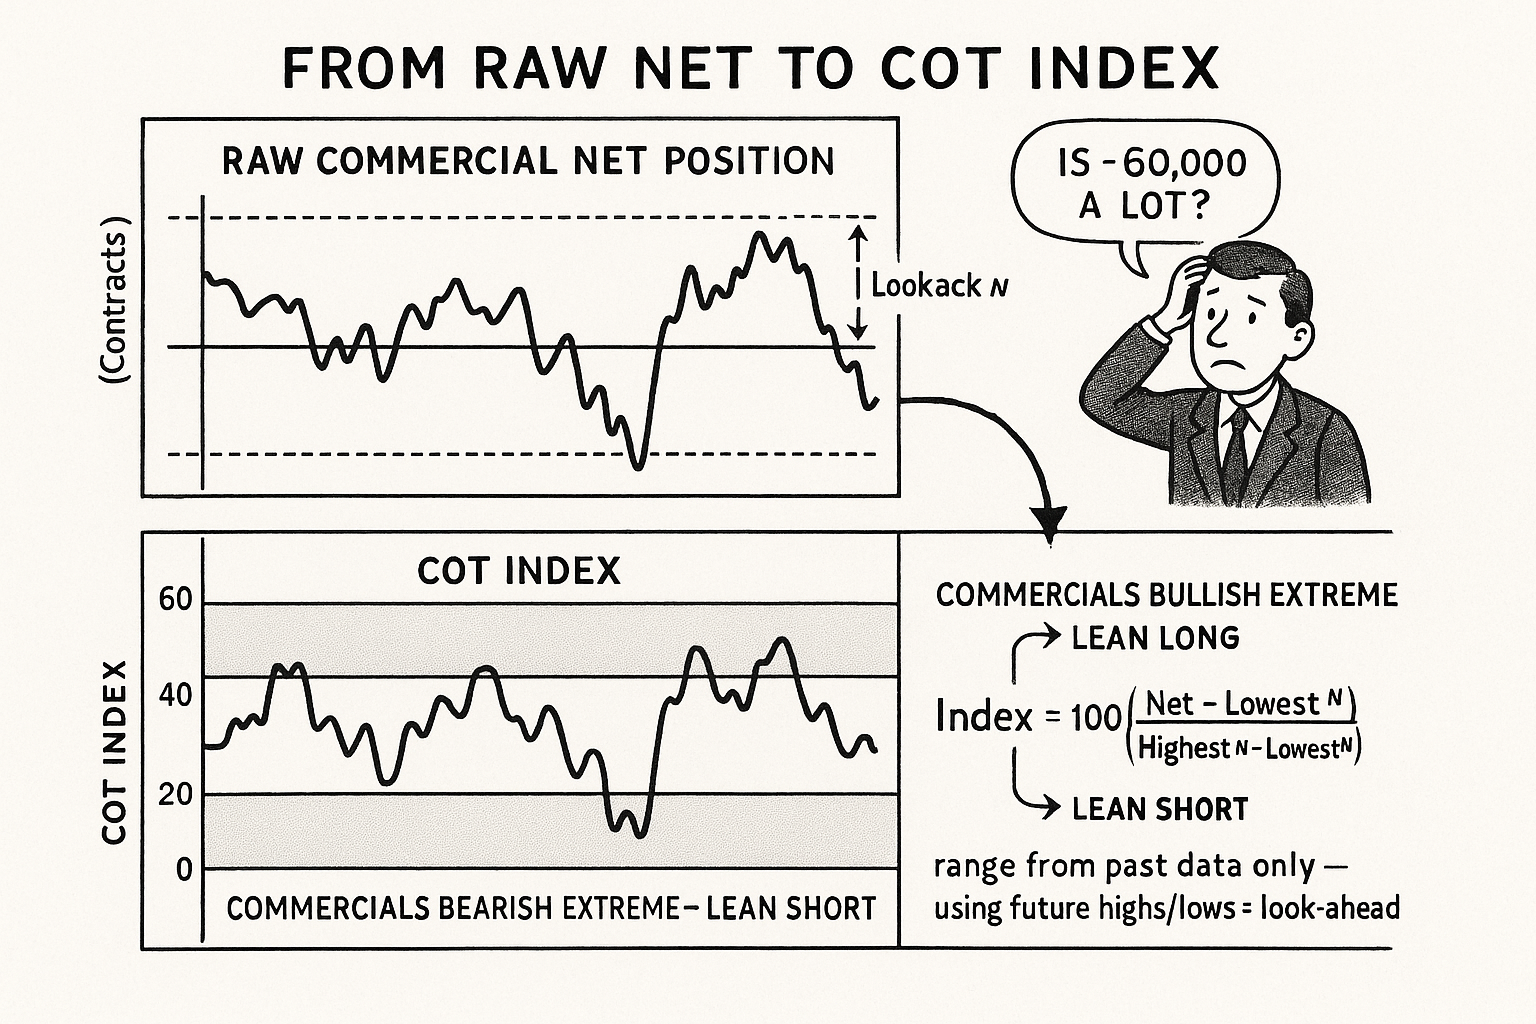
The standard fix is a range-normalization that maps the current net position onto a 0-to-100 scale defined by its own highest and lowest values over a lookback window.
$$ \text{COT Index} \;=\; 100 \times \frac{\text{Net} - \text{Lowest}(\text{Net},\, N)}{\text{Highest}(\text{Net},\, N) - \text{Lowest}(\text{Net},\, N)} $$
Take the current net position, subtract the lowest net seen over the last N periods, and divide by the full range between the highest and lowest net over that window. Multiply by 100. The result sits between 0 and 100 by construction: it reads 100 when the current net is the most net long it has been in N periods, 0 when it is the most net short, and 50 at the midpoint of its recent range. A reading near 100 for the commercials means they are as bullishly positioned as they get; near 0 means as bearish as they get. The wandering, market-specific net becomes a clean contrarian oscillator you can compare across silver, corn, and crude on the same axis.
This is a min-max rescaling, the same family as the standardized seasonal and a cousin of the z-score ranking in "Why Z-Scoring Makes Ranking Cleaner." The difference from a z-score is that this uses the observed high and low of the range rather than the mean and standard deviation, which makes it bounded and sensitive to the extremes, exactly what you want when the whole signal is about reaching an extreme. The lookback N is the one real parameter, and it is a genuine tradeoff: a short N makes the index reach 0 and 100 constantly and cry wolf, a long N makes extremes rare but meaningful. Pick it and then test it honestly, because it is as overfittable as any threshold.
Run it on the hedgers
The index works best on the commercial hedgers, and that is not arbitrary. The previous article, "Why Commercials Are Counter-Trend (and Lead by 2 Weeks)," established that commercials are the group with the causal lead, so their normalized extreme is the one that means something. Build the index on the commercial net and the most predictive signals come out of it. You can compute the same index on the large speculators or small traders, but those groups follow the trend, so their extremes confirm the move rather than anticipating the turn.
The signal is contrarian and you take it with the commercials. A high COT index, commercials at a bullish extreme, says lean long, because the smart money has been accumulating into weakness and the turn up tends to follow. A low COT index, commercials at a bearish extreme, says lean short, because they have been distributing into strength. You are fading the speculators and the retail crowd who sit on the other side of the zero-sum book.
$$ \text{COT Index}_{\text{commercial}} > 80 \;\Rightarrow\; \text{bullish lean} $$ $$ \text{COT Index}_{\text{commercial}} < 20 \;\Rightarrow\; \text{bearish lean} $$
Above 80, commercials are near the top of their historical net-long range and you favor long setups; below 20, near the bottom and you favor short setups. The 80 and 20 are conventional and arbitrary, the same kind of threshold "How to Build Stationary Indicators from Non-Stationary Prices" insisted you test out-of-sample rather than eyeball. Some markets need 90/10 to mean anything; some give plenty of signal at 75/25. The bands are a starting point, not a law.
Where it works and how to use it
The COT index earns its keep in commodities and falls apart elsewhere, a limitation important enough that the next article, "Why COT Fails in Currencies", is devoted to it. In the physical commodity markets, the futures market is where the real hedging happens, so the commercial position genuinely reflects the smart money. That is the precondition for the whole index to mean anything.
Two practical cautions before you trade it. First, this is a slow gauge with a multi-week reporting lag and a multi-week signal horizon, so the COT index is a positioning filter and a bias-setter, not an entry trigger. It tells you which direction to favor over the coming weeks; it does not tell you the bar to buy. Used the way "Seasonality as a Filter, Not a Standalone System" used a weak seasonal, the COT index belongs as a gate or a tilt on a faster system that handles timing, not as a standalone signal generator.
Second, normalize honestly. The Highest and Lowest in the index look back over N periods, and if you compute them over the whole sample including future data you have built look-ahead straight into the index, the current reading scaled against a range it could not have known. Use only data available up to the current bar to define the range, or your backtest is reading a ruler from the future. With that discipline, the COT index turns the commercials' causal lead into a bounded, comparable, tradable contrarian signal, and the only question left is which markets it survives in.
Visualizing the COT index
KEY POINTS
- Raw commercial net position is unusable as a signal because its meaning depends entirely on the market's own history. The same contract count is nothing in one market and an extreme in another.
- The COT index normalizes the net onto a 0-to-100 scale using the highest and lowest net over a lookback N: 100 at the most net long in N periods, 0 at the most net short, 50 at the midpoint.
- This is a bounded min-max rescaling, a cousin of z-score ranking but built on observed extremes rather than mean and standard deviation, which is what you want when the signal is about reaching an extreme.
- The lookback N is the key parameter and a real tradeoff: short N cries wolf, long N makes extremes rare but meaningful. Test it out-of-sample; it overfits like any threshold.
- Run the index on the commercial hedgers, the group with the causal lead. Their normalized extreme anticipates turns; speculator and small-trader extremes only confirm the existing trend.
- Trade it contrarian with the commercials: a high index (commercials bullish, conventionally above 80) leans long, a low index (below 20) leans short. The 80/20 bands are arbitrary starting points to be tested.
- It works in commodities, where the futures market is where real hedging happens, and fails elsewhere. It is a slow positioning filter and bias-setter with a multi-week lag, not an entry trigger, and the lookback range must use past data only to avoid look-ahead.
References
- Trading Systems and Methods - Perry Kaufman (Amazon)
- Cybernetic Trading Strategies - Murray Ruggiero (Amazon)
- The Art of Currency Trading - Brent Donnelly (Amazon)
- The Role of Hedgers and Speculators in Commodity Futures Markets
- The Role of Hedgers and Speculators in Commodity Futures Markets (working paper version)
- Convective Risk Flows in Commodity Futures Markets
- The Role of Hedgers and Speculators in Liquidity Provision to Commodity Futures Markets
- Time Series Momentum
- Tracking Speculative Trading
- Financialization and the Drivers of Commodity Futures Returns
- The Influence of Uncertainty on Commodity Futures Returns and Traders’ Positions