2.61 The Detrended RSI: Predicting RSI(2) from RSI(20)
A two-bar RSI screams on every shock. Regress it on a slow 20-bar RSI, inverse-logistic its U-shaped distribution first, and trade the residual: how far price strayed from where the trend says it belongs.
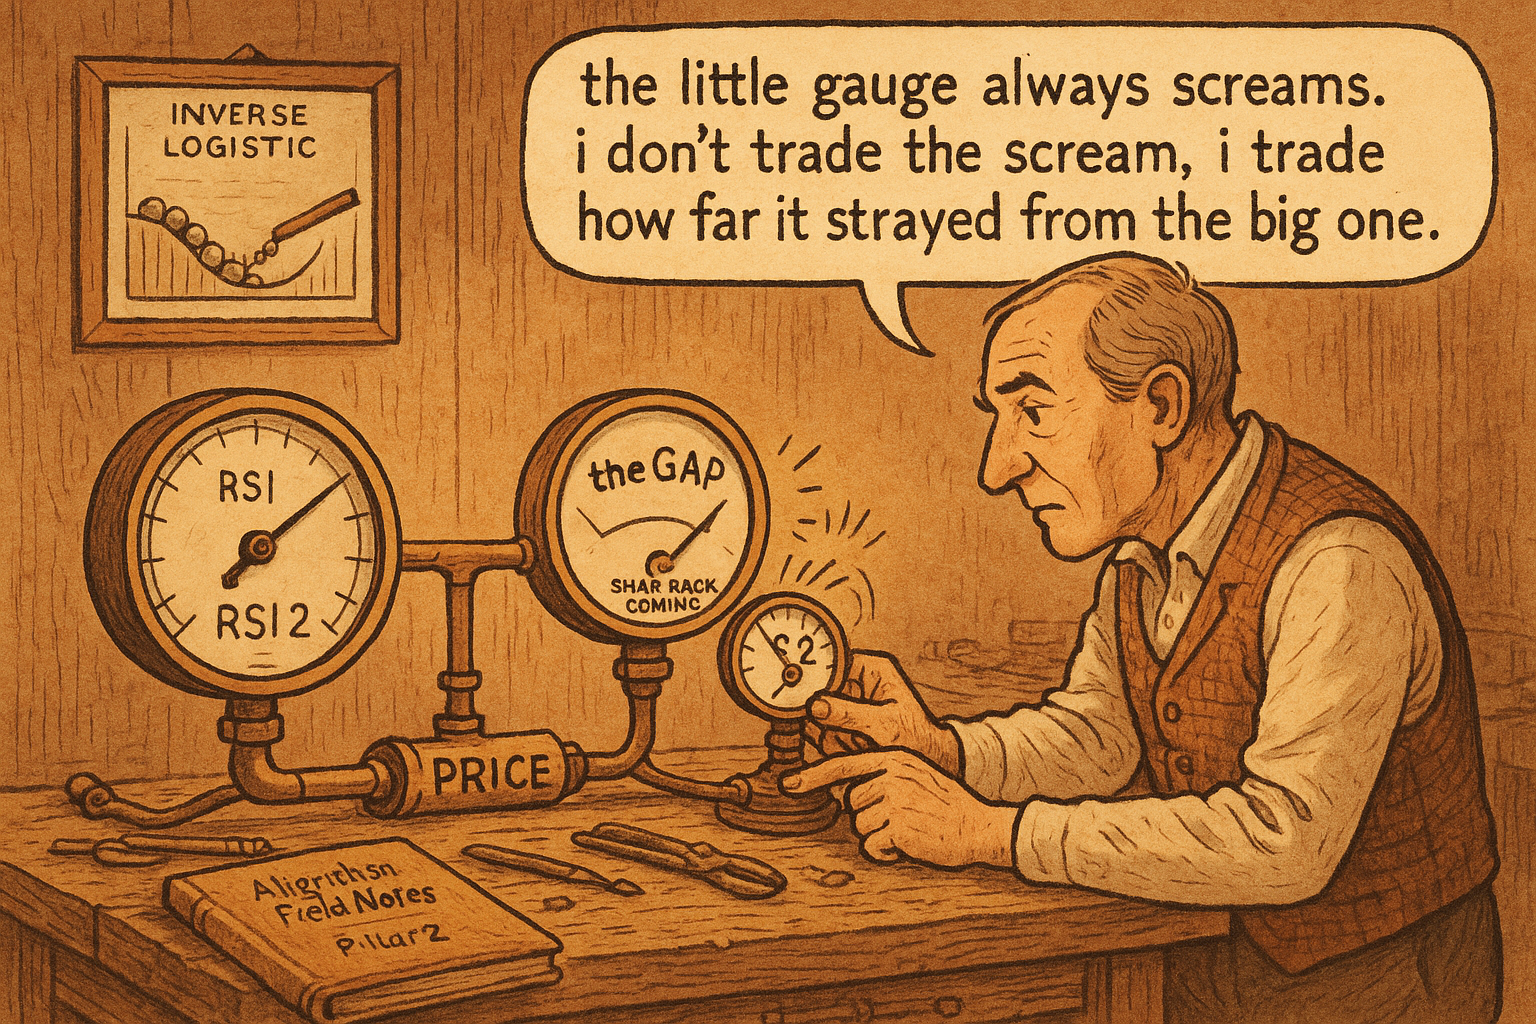
A two-bar RSI is one of the sharpest sudden-move detectors on a chart, and on its own it is close to useless for a model. It fires on every shock, swings to its extremes constantly, and piles its mass at 0 and 100 instead of spreading out like a well-behaved feature. The old article "CMMA: A Better Momentum Primitive Than Price-minus-MA Alone" made the case that the fix for a noisy primitive is not to abandon it but to measure it against the right expectation and keep the residual. The detrended RSI does exactly that to the RSI family: it asks what the fast RSI should be given the slow one, and trades the gap.
Why two RSIs at different lengths carry different information
Start with the indicator itself. The RSI compares the average size of recent up-closes against recent down-closes, smoothed with an EMA-style recursion rather than a flat average.
$$ S_t = \frac{(L - 1)\,S_{t-1} + \text{Value}_t}{L} \qquad \text{RSI} = 100 \cdot \frac{\text{UpSum}}{\text{UpSum} + \text{DnSum}} $$
The term L is the lookback, S is the smoothed up- or down-move average, UpSum and DnSum are those smoothed averages of gains and losses, and the ratio lands in 0 to 100. If you plan to feed RSI into a predictive model, subtract 50 first so it centers at zero. None of that is new. What matters is the lookback.
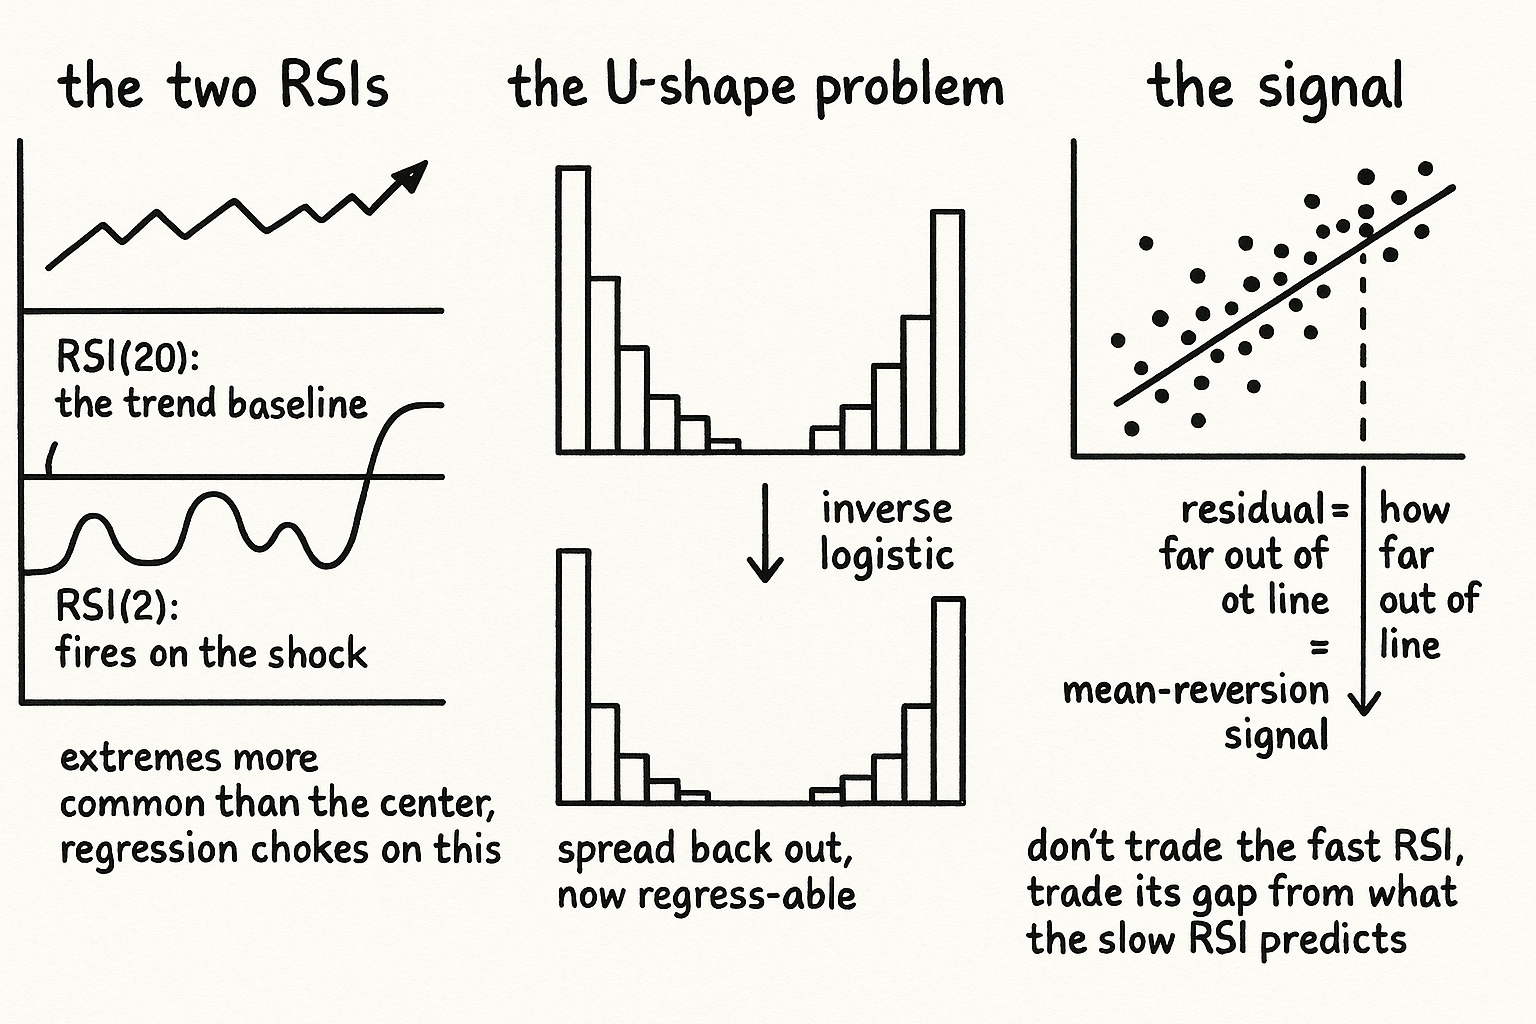
A long RSI, say 20 bars, is a slow gauge of where the market has been leaning over the last month. A short RSI, two bars, reacts to the last two closes and almost nothing else, so it spikes the instant price jumps out of line. The two are correlated because they read the same price stream, and that correlation is the opening the indicator exploits. When a market is marching along a trend and a shock knocks price out of line, the short RSI lurches while the long RSI barely moves. That divergence is the imbalance, and imbalances of this kind tend to revert: price snaps back toward where the slower measure says it belongs. Quantify how far out of line the fast RSI is relative to what the slow RSI predicts, and you have an indicator that runs negatively correlated with short-term returns.
Regress the fast RSI on the slow one, keep the residual
The mechanism is a rolling linear regression. Over an extended window you fit the short RSI as a linear function of the long RSI, then use that fitted line to predict what the short RSI should be on the current bar given the current long RSI. The detrended RSI is the gap between the prediction and reality.
$$ \widehat{\text{RSI}}_{2,t} = a + b\,\text{RSI}_{20,t} \qquad \text{DetrendedRSI}_t = \widehat{\text{RSI}}_{2,t} - \text{RSI}_{2,t} $$
Here a and b are the intercept and slope fit by ordinary least squares over the rolling window, the hatted term is the short RSI the slow trend implies, and the indicator is prediction minus actual. Read the sign directly. When the actual fast RSI sits far above its prediction, price has jumped up harder than the slow lean justifies, the residual goes negative, and you lean for a reversion down. When the fast RSI is far below prediction, price has been knocked down out of line and the residual goes positive. This is the same move as the old CMMA article: do not trade the raw quantity, trade its departure from a baseline expectation, because the departure is where the conditional edge lives.
The U-shape problem, and the inverse-logistic fix
There is a distributional trap that wrecks the regression if you ignore it, and the old article "Why Most Indicators Should Be Transformed Before Modeling" named the exact defect. For a lookback of three or more, RSI has a pleasant bell-ish distribution, a central peak tailing off at both ends. At a lookback of two the shape inverts into a U: the extreme values near 0 and 100 are more common than the middle. Regressing a U-shaped variable on a roughly bell-shaped one is a broken setup, because least squares assumes the response spreads symmetrically around its conditional mean, and a U-shaped response violates that on every bar.
The fix is to reshape the two-bar RSI before it enters the regression. The inverse-logistic transform stretches the crowded extremes back out toward the middle so the variable behaves more like the normal target the regression wants.
$$ \text{IL}(x) = \log\!\left(\frac{x}{1-x}\right) \qquad \text{ILRSI}_2 = -\log\!\left(\frac{2}{\,1 + 0.00049\,(2\,\text{RSI}_2 - 100)\,}\right) $$
The first expression is the plain inverse logistic, the inverse of the squashing sigmoid, which pushes values near the 0 and 1 boundaries outward. The second is that transform shifted and scaled so the 0-to-100 RSI lands in the transform's usable domain. The full recipe is short: compute RSI(2) and RSI(20), run the two-bar RSI through the inverse logistic, regress the transformed fast RSI on the slow RSI over the rolling window, and keep predicted minus actual as the signal.
What it is good for, and what it is not
Keep the indicator inside its lane. The detrended RSI is a short-horizon mean-reversion feature, built to flag when price has shocked away from its own recent trend and to bet on the snap back. It says nothing about the direction of the underlying trend, which is the long RSI's job and not this construction's. The regression window is a real parameter with real risk: too short and the fit is noise, too long and it drags stale relationships into the current bar, and like every rolling fit it must be computed from data strictly before the current bar or you have manufactured a lookahead that will not survive live. The inverse logistic is the right transform here only because the two-bar RSI is U-shaped; copy it onto a bell-shaped indicator and you would do harm, which is the whole point of diagnosing distribution shape before transforming rather than reaching for a default.
KEY POINTS
- The RSI compares smoothed average up-moves against down-moves; subtract 50 before modeling. A long RSI (20) is a slow trend baseline, a short RSI (2) reacts to the last two closes and spikes on any shock.
- The two are correlated. When a shock knocks the fast RSI far off what the slow RSI implies, that gap tends to revert, giving an indicator negatively correlated with short-term returns.
- Build it by rolling-regressing the fast RSI on the slow RSI and keeping predicted minus actual. This is the old CMMA move: trade the departure from a baseline expectation, not the raw quantity.
- The two-bar RSI has a U-shaped distribution (extremes more common than the center), which breaks linear regression. Fix it with an inverse-logistic transform that spreads the crowded extremes back toward a bell, exactly the diagnose-then-transform logic from the old article on transforming indicators.
- It is a short-horizon mean-reversion feature only; it carries no trend direction. The regression window is a tunable parameter and must be fit causally to avoid lookahead.