5.25 The 24-Hour Rolling-Return Artifact
The exchange 24h change rolls, so the headline jumps when an old crash drops out of the window, not when price moves. Uninformed traders chase the mirage; front-run them by reading the hour about to exit.
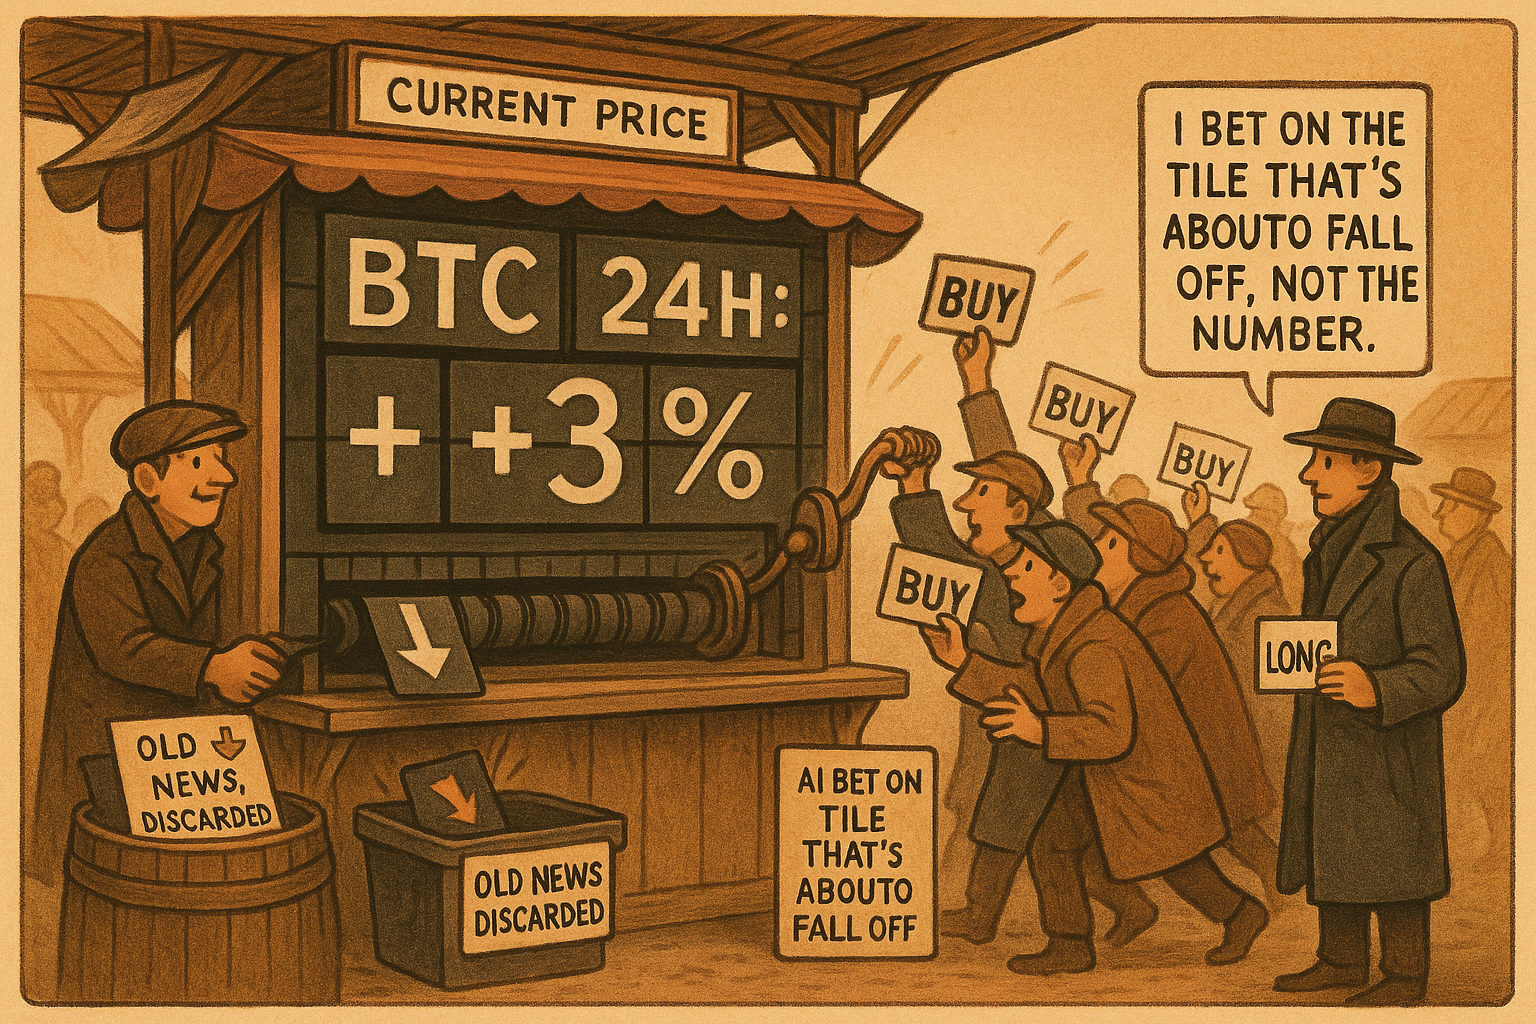
Look at the "24h change" number on any crypto exchange ticker. It says plus 3 percent, and a retail trader reads that as momentum and buys. Half the time that number moved without the price moving at all. The window is rolling, not anchored to midnight, so every hour the oldest hour falls out of the trailing 24, and when a big move drops off the back the headline number jumps even though the current price sat still. The display is reacting to old information leaving, not new information arriving, and that mechanical jump is something you can front-run.
This is the same lesson as the old article "Predictive Power vs Long Bias: The Hidden Trap in Backtests," moved from the backtest to the ticker. There a positive return looked like edge but decomposed into exposure the trader never chose. Here a positive 24h change looks like momentum but decomposes into an arithmetic artifact of the rolling window. The trader chasing it owns a signal with no predictive content.
The mechanism
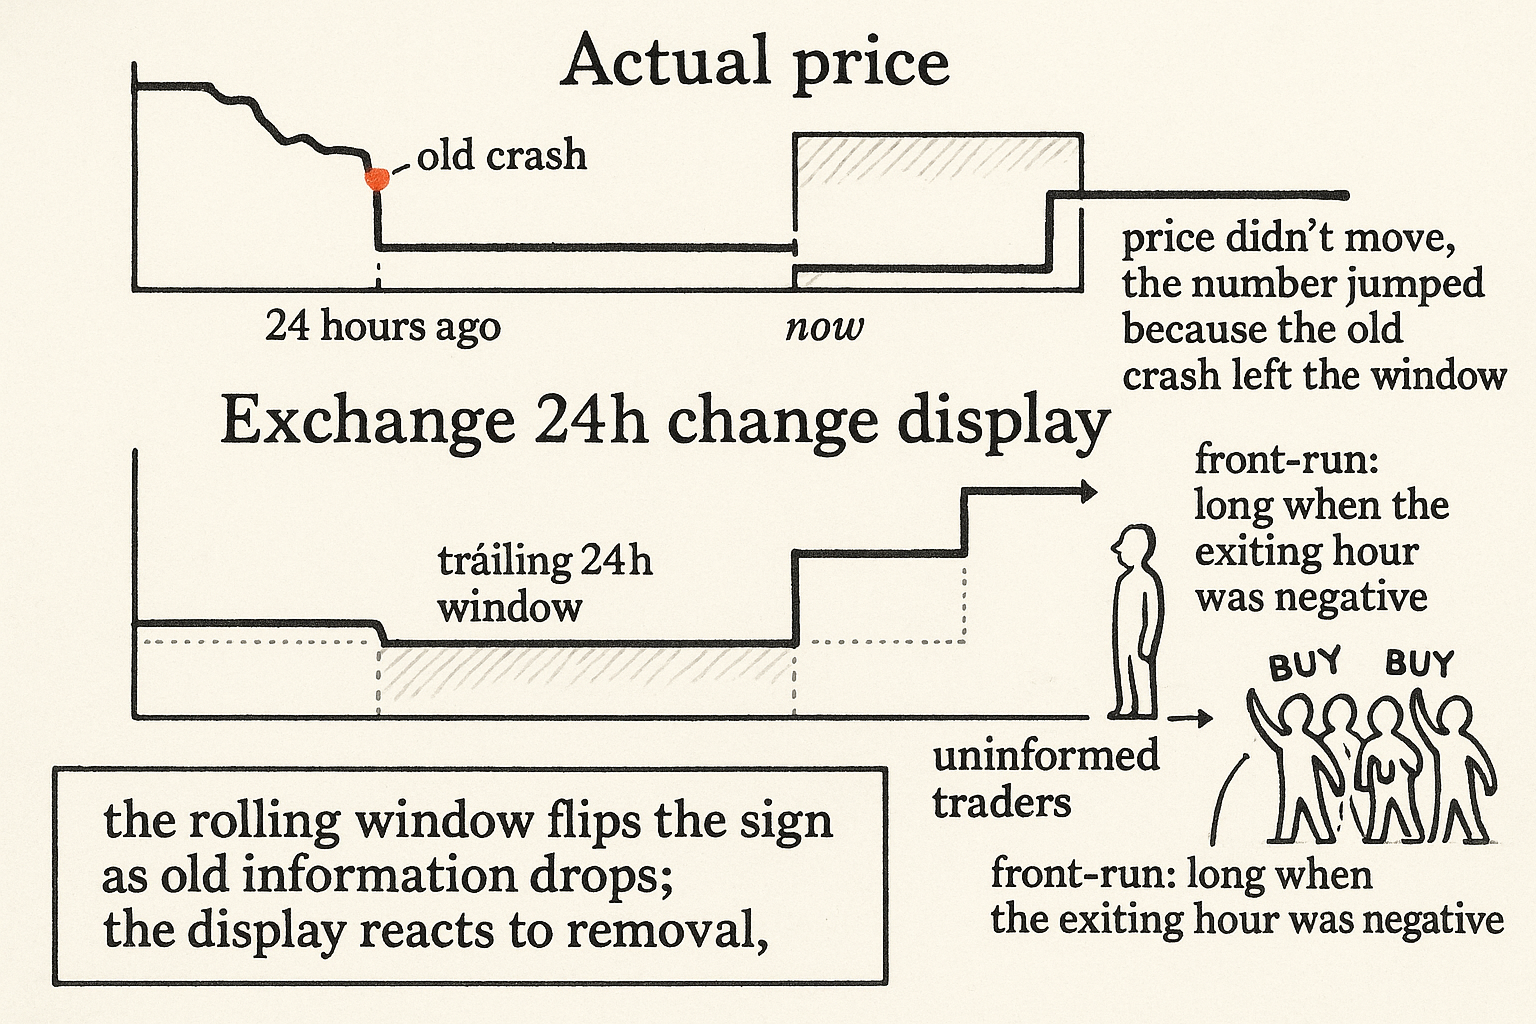
The exchange shows the return from now back to 24 hours ago. That window slides forward continuously. The newest point is the current price, which may be flat; the oldest point is whatever traded 24 hours ago, which is about to be discarded as the clock ticks one more hour.
Walk the case where price has been flat for the last hour but moved hard down 24 hours ago. The return measured from the about-to-drop oldest bar up to now is negative, that old crash is still inside the window dragging the headline down. One hour later that crash falls out of the trailing 24. The window now starts an hour later, after the crash, so the same flat current price now sits above the new window start, and the displayed 24h return jumps up. Price did nothing. The number rose because a negative print left the calculation.
$$ R^{24h}_t = \frac{P_t - P_{t-24}}{P_{t-24}} \qquad \Delta R^{24h} \approx -\,r_{t-24} $$
The R-24h is the displayed rolling return: current price P_t over the price 24 hours ago P_{t-24}, minus one. The change in that headline as the window rolls one hour, with current price flat, is approximately the negative of r_{t-24}, the single hour's return that just dropped off the back. A negative hour leaving (a crash rolling off) pushes the headline up; a positive hour leaving pushes it down. The sign flip is the whole story: the display moves opposite to the return that exits the window.
Who chases it and how you front-run
Uninformed traders read the rising 24h number as positive momentum and buy, hoping the trend continues. They are reacting to a quantity with no forward information, the removal of a stale crash. That predictable buying is order flow you can see coming, which connects straight to the old article "Using Trade Flow to Predict Short-Term Price Movement": uninformed takers about to hit the book are exactly the flow a maker wants to anticipate and lean into. Here you know the flow is coming because you know which old return is about to roll off.
So position ahead of the crowd. When the return 24 hours ago was negative, that print is about to leave the window, the headline is about to rise, the uninformed are about to buy, so go long before them. When the return 24 hours ago was positive, the headline is about to fall, the uninformed are about to sell, so go short. You are front-running a mechanical display, not predicting fundamentals.
$$ \text{Long if } r_{t-24} < 0, \qquad \text{Short if } r_{t-24} > 0 $$
Read it plainly: r_{t-24} is the return over the hour that is about to exit the trailing window. Negative means a down-print is leaving, the headline will rise, so be long. Positive means an up-print is leaving, the headline will fall, so be short. The signal is the sign of the oldest hour, nothing more.
Confirming the spike before you trade it
Do not trust the story without the regression. Test whether returns at lag 24 actually predict the next return by regressing the one-hour return that happened x hours ago against the next one-hour return, sweeping x across a hundred lags, and looking for a spike at x equals 24.
slopes = []
for lag in range(1, 100):
    slope, intercept = np.polyfit(rets[:-lag], rets[lag:], 1)
    slopes.append(slope)
# inspect slopes[24]: a clear spike there is the rolling-window artifact
A clean strategy shows a noticeable bump at lag 24 and noise everywhere else. That bump is the artifact leaking into realized returns, the uninformed buying lifting price as the headline rises. If the bump is not there in your data and your fee schedule, you do not have the trade, you have a plausible story, and the old article "Predictive Power vs Long Bias: The Hidden Trap in Backtests" is the standing warning that a plausible story plus a flattering line is how good narratives become live losses. Size it small: the edge is a few uninformed traders chasing a number, which is thin, regime-dependent, and competed away the moment it is widely known.
Visualizing the artifact
KEY POINTS
- Exchange "24h change" is a rolling trailing-window return, not anchored 00:00 to 00:00. Every hour the oldest hour drops out, so the headline can move while price sits still.
- The change in the headline as the window rolls (with price flat) is approximately the negative of the hour's return that just exited. A crash rolling off pushes the number up; a rally rolling off pushes it down.
- Uninformed traders read the rising number as momentum and buy. That predictable flow is what a maker leans into, the same trade-flow logic from "Using Trade Flow to Predict Short-Term Price Movement," except here you know the flow is coming.
- Rule: long when the return 24 hours ago was negative (headline about to rise, crowd about to buy), short when it was positive. The signal is the sign of the oldest exiting hour.
- Confirm with a lag sweep: regress the return x hours ago against the next return for x up to 100 and look for a clean spike at x equals 24. No spike, no trade.
- This is a momentum mirage, not predictive power, the live version of the bias trap in "Predictive Power vs Long Bias." Size it small; it is thin, regime-dependent, and competed away once known.
References
- Predictive Power vs Long Bias: The Hidden Trap in Backtests (old article)
- Overlapping Returns and Spurious Autocorrelation
- Attention-Induced Trading and Retail Investor Behavior
- Front-Running Predictable Order Flow in Limit Order Markets
- The Art of Currency Trading - Brent Donnelly (Amazon)
- Optimal High-Frequency Trading in a Pro-Rata Microstructure with Predictive Information
- High Frequency Market Making: The Role of Speed
- Deep Limit Order Book Forecasting: A Microstructural Guide
- Limit Order Book Shape and Return Distribution
- Predicting Adverse Selection in High-Frequency Cryptocurrency Markets
- Adverse Selection in Cryptocurrency Markets
- Short-Horizon Excess Returns in Liquid Equities
- Backtesting Strategies Based on Multiple Signals