5.24 Harvesting the Volatility Risk Premium by Hour
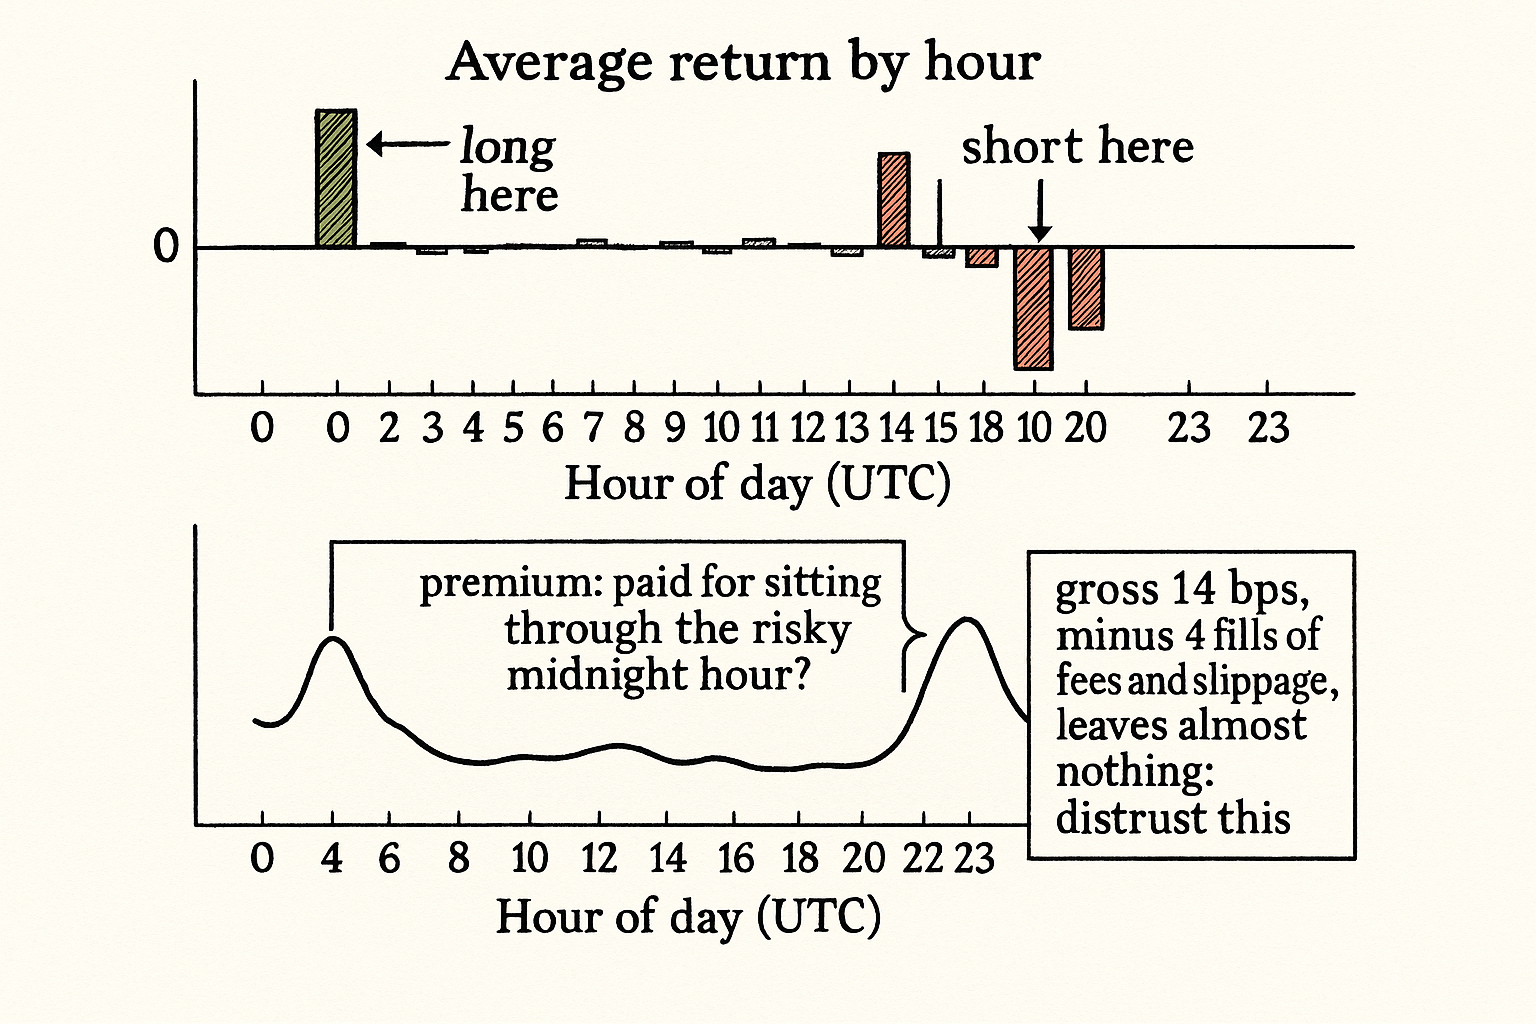
Slice average return and risk by UTC hour and a time-of-day premium appears: long BTC at midnight, short into the early hours. Then four fills of fees eat the 14 bps gross, which is why you treat it as a tilt, not a strategy.

The old article "Crypto Volatility Seasonality" established that vol runs on a 24-hour clock. The same group-by that gave you the variance profile also gives you the average return profile, and the two together suggest a trade: if certain UTC hours reliably carry more risk and certain hours reliably pay for it, hold the coin during the paid hours and step out, or short, during the hours that bleed. That is the volatility risk premium sliced by time of day.
The logic behind a risk premium is old and not crypto-specific: bearing risk should pay, so a high-volatility window that investors want to avoid should offer extra expected return to whoever sits through it. Whether crypto actually pays that premium cleanly, hour by hour, is an empirical question, and the honest answer is "sometimes, weakly, and not stably." This is a real effect worth measuring and a fragile one worth distrusting in equal measure.
Build the two profiles
Same machinery as the seasonality article, run twice. Bucket every hourly bar by its UTC hour, then within each bucket compute two averages: the mean return and the standard deviation of returns. The first tells you which hours tend to drift up or down. The second tells you which hours are risky.
$$ \bar{r}_h = \frac{1}{N_h} \sum_{t \,:\, \text{hour}(t)=h} r_t \qquad \sigma_h = \sqrt{\frac{1}{N_h} \sum_{t \,:\, \text{hour}(t)=h} (r_t - \bar{r}_h)^2} $$
The r-bar_h is the average return for clock hour h, the simple mean of every hourly return that landed in that hour. The sigma_h is the standard deviation within the same bucket, the spread of those returns around their mean. N_h is the count of bars in the bucket. Twenty-four pairs of numbers, return and risk for each hour, and the trade reads straight off them: be long during hours whose average return is reliably positive, be flat or short during hours whose average return is reliably negative, and weight your conviction by how clean the signal is relative to sigma_h.
A concrete rule
The source profile points at a specific pattern: BTC tends to drift up over the 00:00 to 01:00 UTC hour and tends to drift down over the 01:00 to 03:00 window. So the toy rule is two trades. Buy BTC at 00:00 UTC and sell at 01:00. Short BTC at 01:00 and cover at 03:00.
Put a number on it. Suppose the 00:00 to 01:00 bucket averages plus 8 basis points and the 01:00 to 03:00 window averages minus 6 basis points per the two hours combined. A round trip that captures both legs nets roughly 14 basis points gross per day, before costs. Now subtract costs honestly. Two entries and two exits is four taker fills; at even 1.5 basis points per side that is 6 basis points of fees, plus spread paid and slippage on each. The 14 bps gross can become 4 to 6 bps net on a good day and negative on a normal one. A 14 bps edge that survives as a few bps after costs is exactly the kind of thin, fragile alpha that looks great in a frictionless backtest and dies on contact with a real fee schedule.
Why to distrust it
Three things will eat this faster than you expect. First, the per-hour averages are estimated on a small slice of your data, the same 24-way split as the seasonality article, so a couple of violent days can manufacture an entire "premium" that is not there. Confirm the hourly returns survive dropping the largest moves, and look at the distribution, not just the mean: an 8 bps average built from one 400 bps day and a row of small negatives is not a premium, it is a single event.
Second, this is a directional bet, and the old article "Why Volatility Is More Non-Stationary Than Trend" is blunt about why that is hard: returns are near-random-walk with tiny autocorrelation, so a directional edge this small needs a large, stable sample to even confirm, and crypto does not give you a stable directional process. Vol seasonality is robust; return seasonality is far flimsier, and you should size accordingly.
Third, anything this mechanical and well-known gets arbitraged. If a clean "long BTC at midnight" effect existed and persisted, the funding and rebalancing flows that cause the 00:00 vol bump would be front-run until the return edge flattened. The vol seasonality persists because it comes from real recurring plumbing; the return premium is the part most likely to already be competed away.
Where it fits
Treat the hourly return profile as a tilt, not a standalone strategy. The cleaner use is to let it nudge a position you already hold for another reason: skip adding risk in the hours that historically bled, lean in slightly during the hours that historically paid. The old article "Volatility Regimes and Strategy Survival" framed the general move of conditioning exposure on regime; time of day is just the cheapest regime axis to compute. And the old article "Spread Widening During Volatility Expansion" is the cousin trade on the maker side: the same 00:00 and 14:00 windows that carry the premium are the ones where you widen quotes, so the time-of-day map serves both the taker tilt and the maker spread.
Visualizing the two profiles
KEY POINTS
- The same hourly group-by from the seasonality work, run for mean return and for standard deviation, gives a 24-hour return profile and a 24-hour risk profile. The trade reads off them: long the paid hours, flat or short the bleeding hours.
- Source pattern: long BTC 00:00 to 01:00 UTC, short BTC 01:00 to 03:00. The midnight hour that carries the vol spike is also the one that tends to pay.
- Worked costs: a ~14 bps gross round trip is four taker fills. At 1.5 bps per side plus spread and slippage, it nets a few bps on a good day and negative on a normal one. Thin, fragile alpha.
- Distrust it on three counts: tiny per-bucket samples let a few violent days fake a premium; directional edges are hard to confirm because returns are near-random-walk; and a mechanical, well-known effect gets arbitraged.
- The vol seasonality is robust because it comes from real recurring plumbing. The return premium is the flimsier sibling and the part most likely already competed away.
- Use it as a tilt, not a standalone strategy: skip risk in historically bleeding hours, lean in during historically paid ones, and let the same time map drive maker spread widening.
References
- The Variance Risk Premium and Expected Returns
- Intraday Patterns in Cryptocurrency Returns and the Time-of-Day Effect
- Overnight Returns and Risk Premia in Equity Markets
- Transaction Costs and the Profitability of High-Frequency Trading Strategies
- The Art of Currency Trading - Brent Donnelly (Amazon)
- Risk Premia in the Bitcoin Market
- Option-Implied Risk Premia and Cryptocurrency Market Regimes
- What Do Crypto Options Tell Us? Risk Premia Implied by BTC Volatility
- Optimal Strike Distance for Daily Crypto Strangles
- Testing for Tradable Alpha in Short-term Bitcoin Market Data
- High Frequency Market Making: The Role of Speed
- Deep Limit Order Book Forecasting: A Microstructural Guide
- Short-term Trading Skill: An Analysis of Investor Heterogeneity and Execution Quality