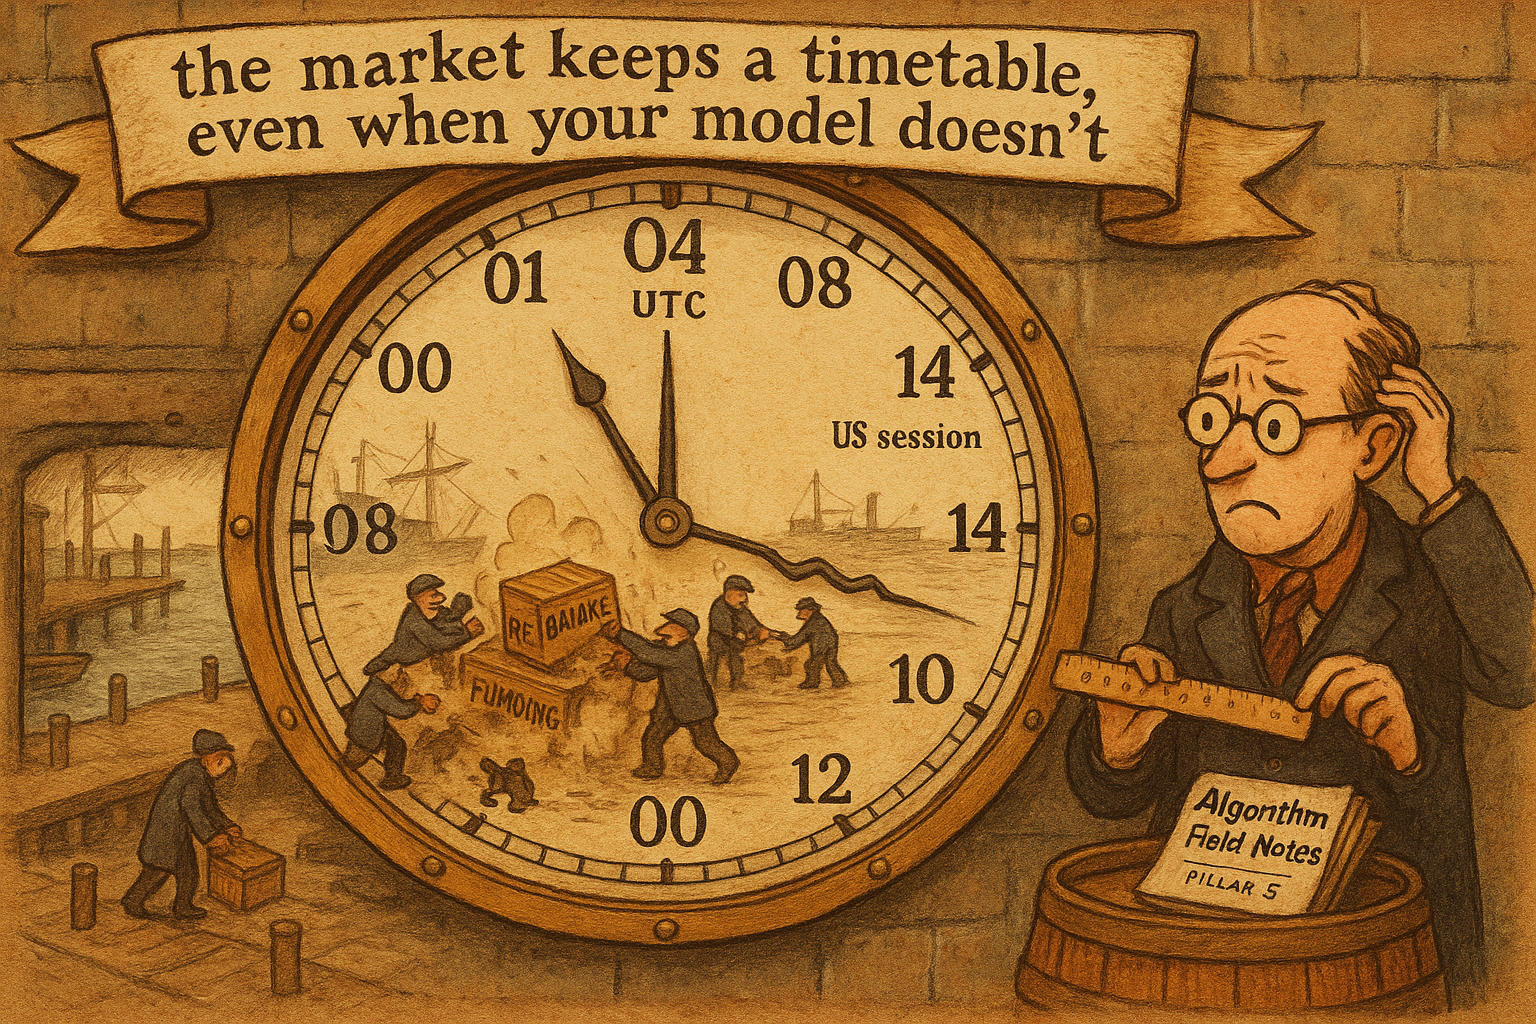
5.22 Crypto Volatility Seasonality
Crypto vol runs on a 24-hour clock, spiking at 14:00 and 00:00 UTC from session opens and midnight rebalancing. GARCH and HAR have no clock term, so they quote too tight into the predictable bursts.
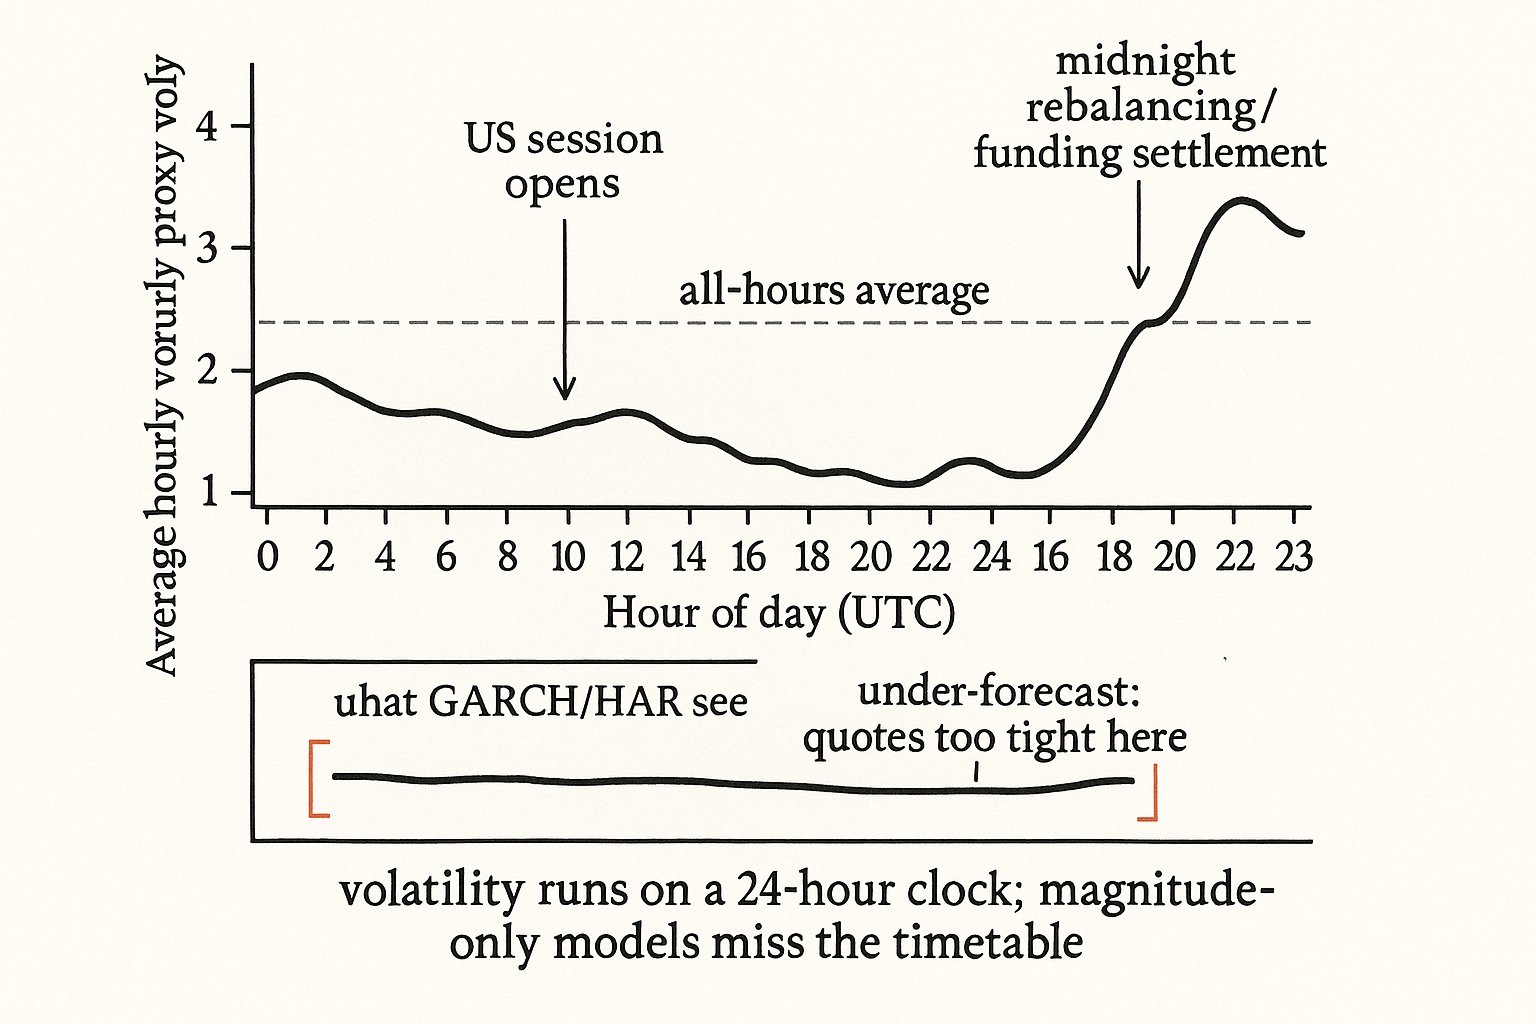
Pull up an hourly chart of realized BTC volatility, average each UTC hour over a few months, and the line is not flat. Two bumps stick out: one around 14:00 UTC and a bigger one at 00:00 UTC. Volatility is not arriving at random through the day. It clusters at specific clock times, and the clock is doing work your model probably throws away.
This matters to anyone quoting a spread or sizing a position by volatility, because the standard tools, GARCH and HAR, are built to miss exactly this. They treat the volatility process as a function of its own recent magnitude and nothing else. They have no slot for "it is midnight UTC, so expect a spike." So they under-forecast vol right before the predictable bursts and over-forecast it right after, and a market maker running on that forecast quotes too tight into the 00:00 burst and too wide in the dead hours after.
Where the bumps come from
The 00:00 UTC spike is the loud one, and the mechanism is plumbing, not sentiment. A lot of crypto activity is pinned to midnight UTC: funding-rate settlements on perps, daily mark and rebalancing flows from funds and structured products, accounting cutoffs that force end-of-day trades. When a pile of mechanical orders lands in the same minute every day, you get a repeatable jump in traded volume and a repeatable jump in price variance around it. The 14:00 UTC bump lines up with the US session waking up, roughly the cash-equity and macro-data window in the morning New York hours, when discretionary flow and news reactions stack on top of the always-on crypto book.
The point is not the exact story behind each bump. The point is that the bumps repeat on a 24-hour cycle, which means they are forecastable, which means a model that ignores the cycle is leaving information on the floor.
Why GARCH and HAR are blind to it
GARCH forecasts tomorrow's variance from a constant, yesterday's squared shock, and yesterday's variance. HAR does something similar with daily, weekly, and monthly realized-vol averages. Both are autoregressive on magnitude alone. Neither has a term that says "this observation happened at hour h of the day," so neither can lift its forecast for the 00:00 bar and lower it for the 04:00 bar. The structure that would let it do that simply is not in the equation.
You can see the failure as a residual pattern. Fit a plain GARCH to hourly crypto returns, then average the model's squared forecast error by hour of day. The errors are not flat. They are large and positive (model under-predicted) around 00:00 and 14:00, and negative in the quiet hours. A residual that is predictable from the clock is a feature you forgot to add. The old article "Why Volatility Is More Non-Stationary Than Trend" made the general case that vol carries long memory and structure worth modeling; seasonality is a slice of that structure sitting in plain sight on the time axis.
Measuring it before you trust it
The estimate is a simple group-by. Take a long run of hourly returns, square them as your variance proxy, tag each by its UTC hour 0 through 23, and average within each bucket. That gives you a 24-point seasonal profile: average variance at each hour. Plot it, and the two bumps appear if your sample is honest.
$$ \bar{v}_h = \frac{1}{N_h} \sum_{t \,:\, \text{hour}(t) = h} \epsilon_t^2 \qquad h = 0, 1, \dots, 23 $$
Read this as: for each clock hour h, collect every hourly squared return whose timestamp falls in that hour, and average them. The epsilon-squared is the squared hourly return standing in for realized variance, N_h is the count of bars in bucket h, and v-bar_h is the seasonal variance estimate for that hour. Twenty-four numbers, one per hour, and the shape of those numbers is the seasonality.
A worked number makes the size concrete. Say average hourly variance across all hours corresponds to a typical hourly move of 40 basis points. If the 00:00 bucket averages roughly twice the variance, that hour's typical move is about 40 times the square root of 2, near 57 basis points. A spread or stop calibrated to the 40 bps all-day average is roughly 30 percent too tight in the one hour that reliably moves most. That is the cost of treating the clock as noise.
Two cautions before you lean on the profile. First, it is non-stationary like everything else in this market: the 00:00 mechanism is tied to current funding schedules and product flows, and those drift, so re-estimate the profile on a rolling window rather than freezing a year-old shape. Second, watch your sample size per bucket. Twenty-four buckets split your data 24 ways, and a noisy bump from a handful of violent days is not a seasonal effect, it is a small sample. Confirm the bumps survive when you drop the largest few days.
What to do with it
The direct use is to make any volatility input clock-aware. Wherever you feed a volatility estimate, scale it by the seasonal factor for the current hour: multiply your base vol forecast by v-bar_h divided by the all-hours average. The old article "Spread Widening During Volatility Expansion" set the rule that quote width should track volatility; seasonality says part of that volatility is on a timetable, so widen ahead of 00:00 and 14:00 by the clock, not after the burst has already picked you off. The next step, folding the lagged seasonal term straight into the forecast model, is the SAR build in the old article "SAR: Seasonal Autoregressive Volatility Forecasting."
Visualizing the seasonal profile
KEY POINTS
- Crypto realized volatility has a repeatable 24-hour shape: a medium bump near 14:00 UTC (US session) and the largest at 00:00 UTC (midnight rebalancing, funding settlement, accounting cutoffs).
- GARCH and HAR forecast vol from its own recent magnitude only. They have no clock term, so they under-forecast the predictable bursts and over-forecast the quiet hours.
- Measure the profile with a group-by: square hourly returns, bucket by UTC hour, average within each bucket. The result is 24 numbers whose shape is the seasonality.
- Worked size: if the 00:00 bucket runs roughly double the average variance, that hour's typical move is about 40 percent larger, so an all-day-average spread is roughly 30 percent too tight at midnight.
- Re-estimate on a rolling window (the mechanism drifts with funding schedules) and confirm bumps survive dropping the largest few days, or you are fitting a small sample, not a season.
- Use it by scaling any volatility input by the current hour's seasonal factor, which lets you widen ahead of 00:00 and 14:00 by the clock instead of after the burst.
References
- Intraday Periodicity and Volatility Persistence in Financial Markets (Andersen & Bollerslev)
- Periodic Volatility and Seasonality in Cryptocurrency Markets
- Funding Rates and Intraday Price Dynamics in Perpetual Futures
- Modeling and Forecasting Realized Volatility (Andersen, Bollerslev, Diebold, Labys)
- The Art of Currency Trading - Brent Donnelly (Amazon)
- Arbitrage, contract design, and market structure in Bitcoin futures markets
- Bitcoin spot and futures market microstructure
- Seasonality in cryptocurrencies
- A generalised seasonality test and applications for cryptocurrency and stock market seasonality
- Adverse selection in cryptocurrency markets
- Forecasting volatility of Bitcoin
- Predicting Adverse Selection in High-Frequency Cryptocurrency Markets
- Liquidity commonality in cryptocurrencies - ScienceDirect.com