5.13 Order Book Imbalance: The First Microstructure Feature to Test
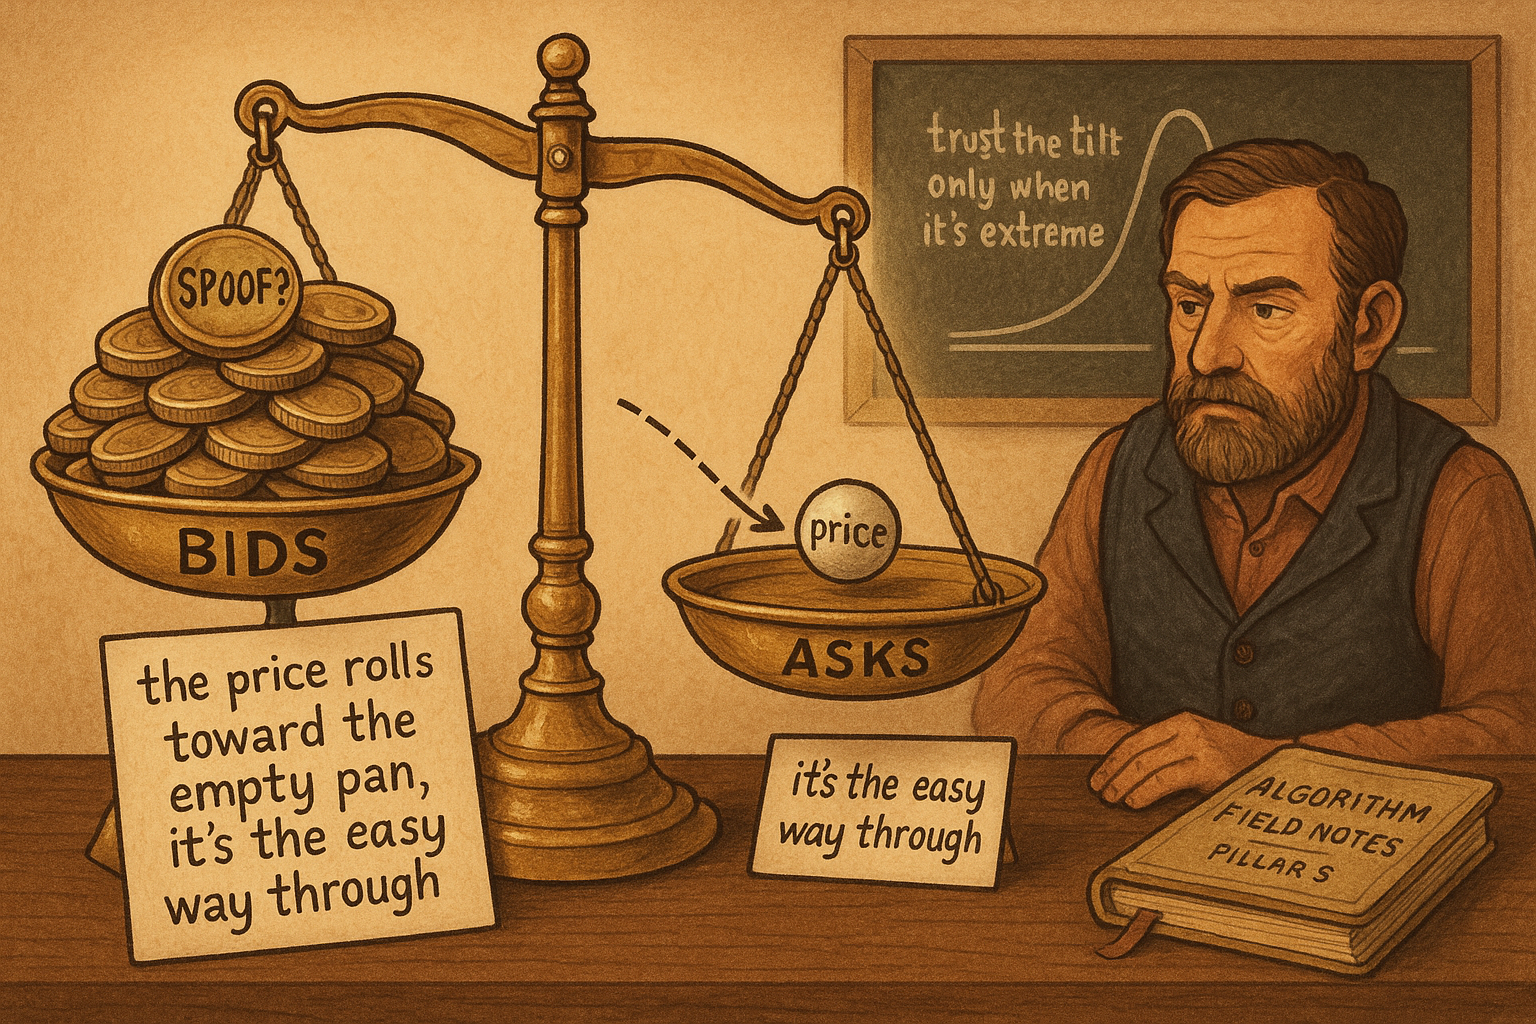
Order book imbalance, bid size minus ask size over their sum, is the strongest simple microstructure feature. Price rolls toward the thin side, and the signal lives in the tails, so fit a spline.
If you build one microstructure feature, build this one. Order book imbalance compares the size resting on the bid against the size resting on the ask and turns it into a single number between minus one and plus one. It is the strongest simple predictor of the next short-horizon price move, the first feature any market making forecast should include, and the one that does most of the work in centering fair value. Top-of-book imbalance is by far the strongest of the basic features, ahead of trade-volume imbalance and volatility.
This article builds the feature that "Why Fair Value Is the Core of Market Making" named as the workhorse of the forecast. It is the cleanest entry point into microstructure alpha.
The formula
Order book imbalance at time t compares bid liquidity against ask liquidity, normalized by their sum.
$$ I(t) = \frac{B(t) - A(t)}{B(t) + A(t)} $$
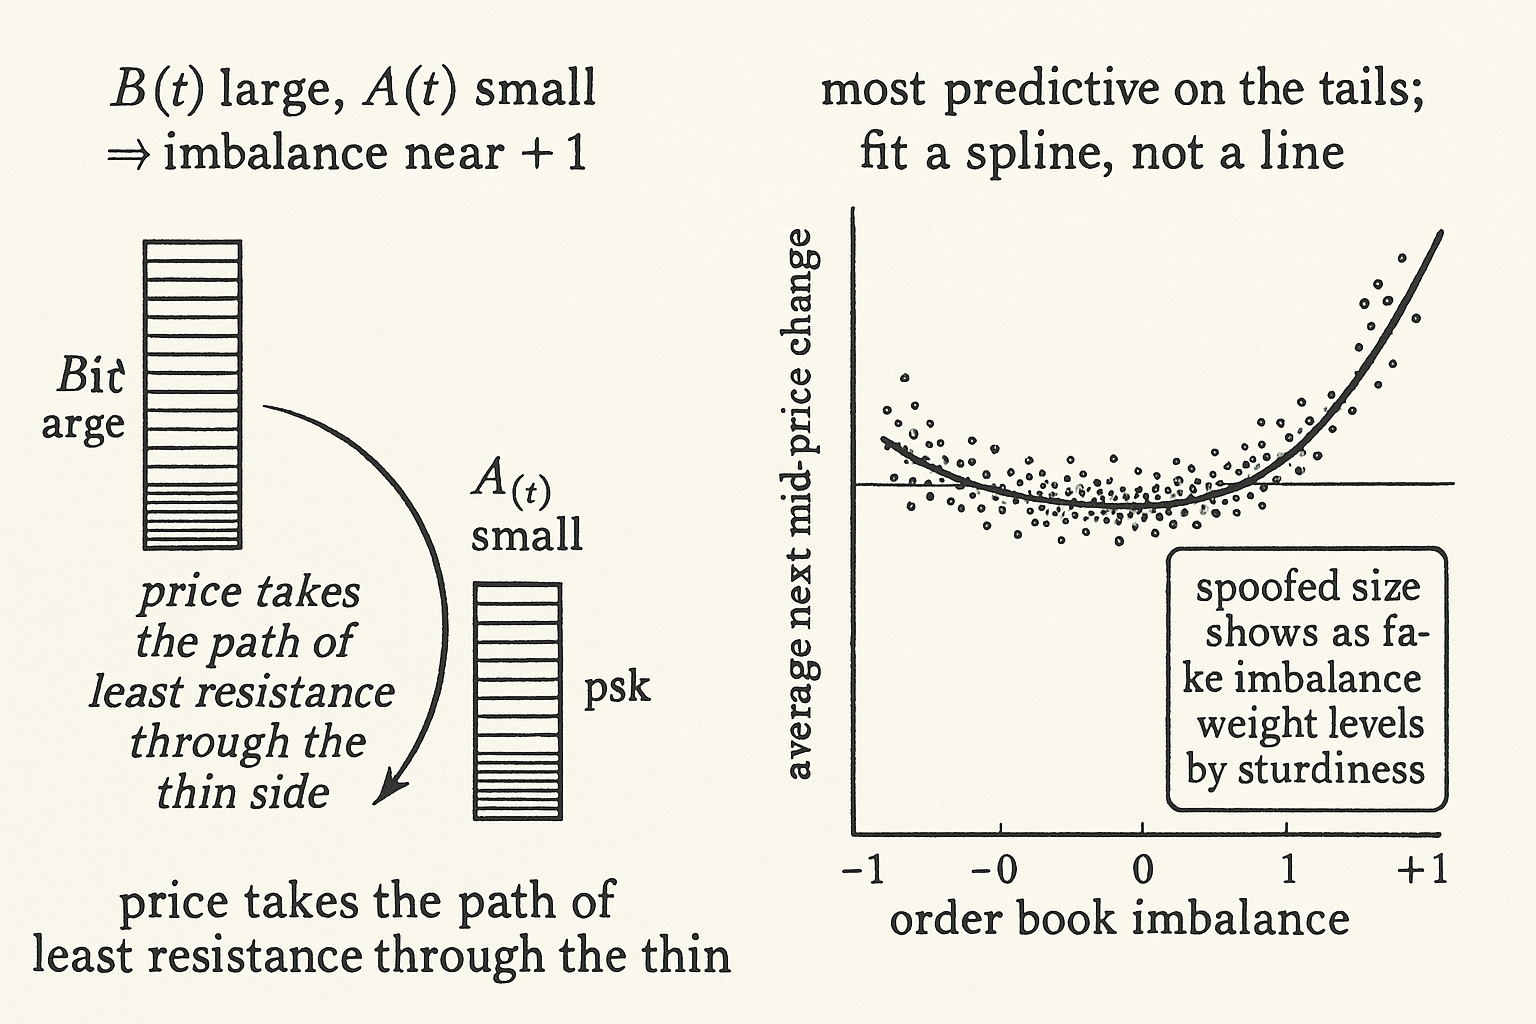
Here B(t) is the liquidity resting on the bid and A(t) the liquidity resting on the ask, at time t. The numerator is the raw excess of bid over ask; the denominator normalizes it so the result always lands between minus one and plus one regardless of the absolute size in the book. A value near plus one means the bid is stacked relative to the ask, near minus one means the ask is stacked, and zero means balanced.
A worked value makes it concrete. Suppose three units rest on one side and four on the other across the levels you measure, so the difference is one unit and the total is seven. The imbalance is one over seven, roughly 0.14, a mild lean toward the heavier side. The sign tells you the direction of the pressure, the magnitude tells you how lopsided the book is.
Why it predicts
The intuition is mechanical. A heavily stacked bid against a thin ask means the ask side is easier to clear, so the price is more likely to move up toward the ask, because it takes less volume to push through the thin side than the thick one. Imbalance measures which side is the path of least resistance, and price tends to take that path over the next short interval.
The relationship shows up cleanly in the data. Plot imbalance against the average mid-price change that follows, binning by imbalance level, and you get a steadily increasing curve: more positive imbalance, more positive expected next move. The feature also has autocorrelation, the imbalance now predicts the imbalance shortly ahead, which means it persists long enough to act on rather than vanishing the instant you measure it.
Use it on the tails, fit a spline
The predictive content is not uniform across the range. Imbalance is most predictive on the tails, when the book is heavily lopsided, and weakest in the middle, when it is roughly balanced. A book at 0.05 imbalance tells you almost nothing; a book at 0.85 imbalance is leaning hard and carries real signal. So the relationship between imbalance and the next move is not a straight line, and forcing a linear fit wastes the information sitting in the extremes.
The fix is to fit a spline to imbalance versus mid-price change rather than a single slope. The spline captures the flat middle and the steep tails, giving a continuous prediction of the next move for any imbalance value. That continuous prediction feeds straight into fair value: skew the center toward the predicted move, which "Microprice: Better Than Mid Price?" formalizes as a specific weighting of the mid, and which "Adverse Selection Explained for Traders" needs to shade quotes away from the informed side.
The honest limits
Imbalance is the strongest simple feature, and it is still a weak signal on any single read, with the usual microstructure caveats. It can be gamed: a stacked bid that is a spoof, from "Spoofing, Sturdy Liquidity, and Book Pressure", shows as positive imbalance and then vanishes, so raw imbalance counts spoofed size as real pressure and a careful version weights levels by their sturdiness. It is short-lived: the autocorrelation that makes it tradable also decays fast, so the feature is for short-horizon forecasts, not multi-minute views. And how many levels you include in B and A changes the feature, top-of-book versus several levels deep behave differently, so the depth is a choice you have to make and test rather than a given. None of this disqualifies it. It remains the first feature to build and the one that earns the most per line of code.
Imbalance is also a factor, not just a feature
There is a second way to think about imbalance that changes how you test everything built after it. At HFT horizons, order book imbalance does not earn risk-adjusted return on its own, it is too short-lived and too well known for that. What it is, in the language of the old article "What Is a Factor, Really," is a factor: an effect that explains a large chunk of the next-move variance and that you will keep accidentally re-finding inside your other alphas. Build a trade-flow signal, a microprice tilt, a queue-position model, and run their correlations, and you will find imbalance hiding inside all of them, the same way three value signals turn out to be one value factor wearing different clothes.
The consequence is procedural. Before you get excited that a new microstructure alpha predicts the next move, regress imbalance out of returns and test the candidate against the residual, the part imbalance does not already explain. A signal that only scored because it was imbalance in disguise flatlines against the residual; a signal with genuine independent content still slopes up. Skip this and a backtest against raw next-move returns will happily reward you for re-discovering imbalance under a new name, the curve will look real because the moves are real, they are just not new. Imbalance is the first feature to build and the first factor to subtract.
Visualizing imbalance
KEY POINTS
- Order book imbalance is the strongest simple microstructure feature and the first one to build, ahead of trade-volume imbalance and volatility. It does most of the work in centering fair value.
- It is the bid liquidity minus the ask liquidity over their sum, always between minus one and plus one. Near plus one the bid is stacked, near minus one the ask is stacked, zero is balanced.
- It predicts because a stacked bid against a thin ask makes the ask the path of least resistance, so price tends to move that way. Binned plots show a steadily increasing curve of next move versus imbalance.
- Imbalance has autocorrelation, so it persists long enough to act on instead of vanishing the instant you measure it.
- The signal lives in the tails: heavily lopsided books predict, balanced books do not. Fit a spline to imbalance versus next move to capture the flat middle and steep tails, and feed the continuous prediction into fair value.
- Limits: spoofed size shows as fake imbalance, so weight levels by sturdiness; the signal decays fast and suits short horizons; and the number of levels included changes the feature, a choice to test rather than assume.
- Imbalance is also a factor, not just a feature. At HFT horizons it does not earn risk-adjusted return on its own, but it explains a lot of next-move variance and you keep re-finding it inside other alphas. Regress it out of returns and test new microstructure signals against the residual, the move from the old article "What Is a Factor, Really," so you do not reward yourself for re-discovering imbalance under a new name.
References
- The Art of Currency Trading - Brent Donnelly (Amazon)
- Limit Order Book Liquidity and Liquidity Imbalance
- Mid-Price Prediction in a Limit Order Book
- Enhancing Trading Strategies with Order Book Signals
- Deep Order Flow Imbalance: Extracting Alpha at Multiple Horizons from the Limit Order Book
- Information content of order imbalance in an order-driven market: Indian Evidence
- Order-Flow Filtration and Directional Association with Short-Horizon Returns
- Stochastic Price Dynamics in Response to Order Flow Imbalance
- The short-term predictability of returns in order book markets: A deep learning perspective
A note on AI. The ideas, research, analysis, and conclusions in this article are my own. I use AI tools to help with editing and wordsmithing, because English is not my first language, and I am not shy about that. AI-generated ideas and AI-assisted writing are not the same thing: the first is empty slop from a generic prompt, the second is a tool for communicating years of real research more clearly. Judge the work by its substance, not by whether software helped polish the prose.