2.52 Noise Colors: White, Pink, and Brownian Markets
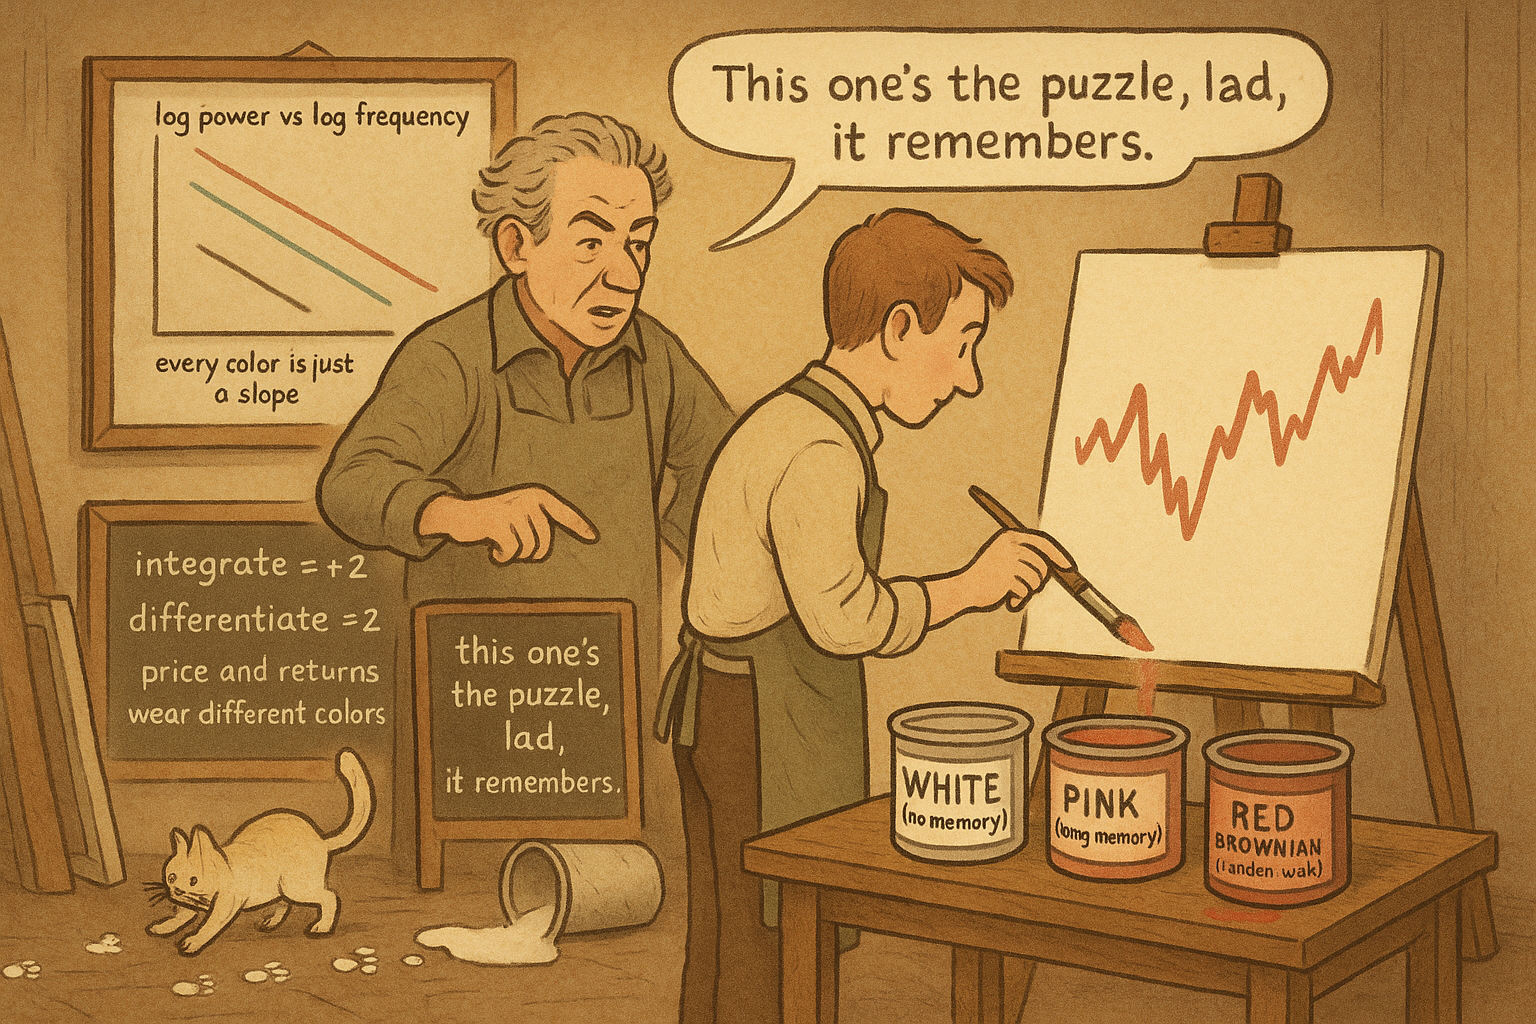
Markets have a color: the slope of their log power spectrum. White means no memory, brownian means random walk, pink means long memory. One number tells you whether price remembers its past.
The old article "Noise Is Not Volatility" split two quantities traders constantly confuse: how far price travels versus how much of that travel cancels. The old article "Efficiency Ratio Explained for Traders" turned the second one into a single number between zero and one. Both measure the same underlying thing from the time side. There is a second way to look at it, from the frequency side, and it comes with a vocabulary borrowed from physics: noise has a color, and the color tells you whether a market remembers its own past.
One slope describes the whole spectrum
Take any series, compute its power spectrum (how much energy sits at each cycle speed), and most natural signals show power falling off as a simple power of frequency.
$$ S(f) \;\propto\; \frac{1}{f^{\alpha}} $$
Read it plainly: S(f) is the power at frequency f, and alpha is the exponent that sets how fast power drops as you move from slow cycles to fast ones. A single number, alpha, fixes the shape. The reason this is useful is that the relationship turns into a straight line the moment you take logs of both sides, so you never have to fit a curve, you fit a slope.
$$ \log S(f) \;=\; -\alpha \,\log f \;+\; \text{constant} $$
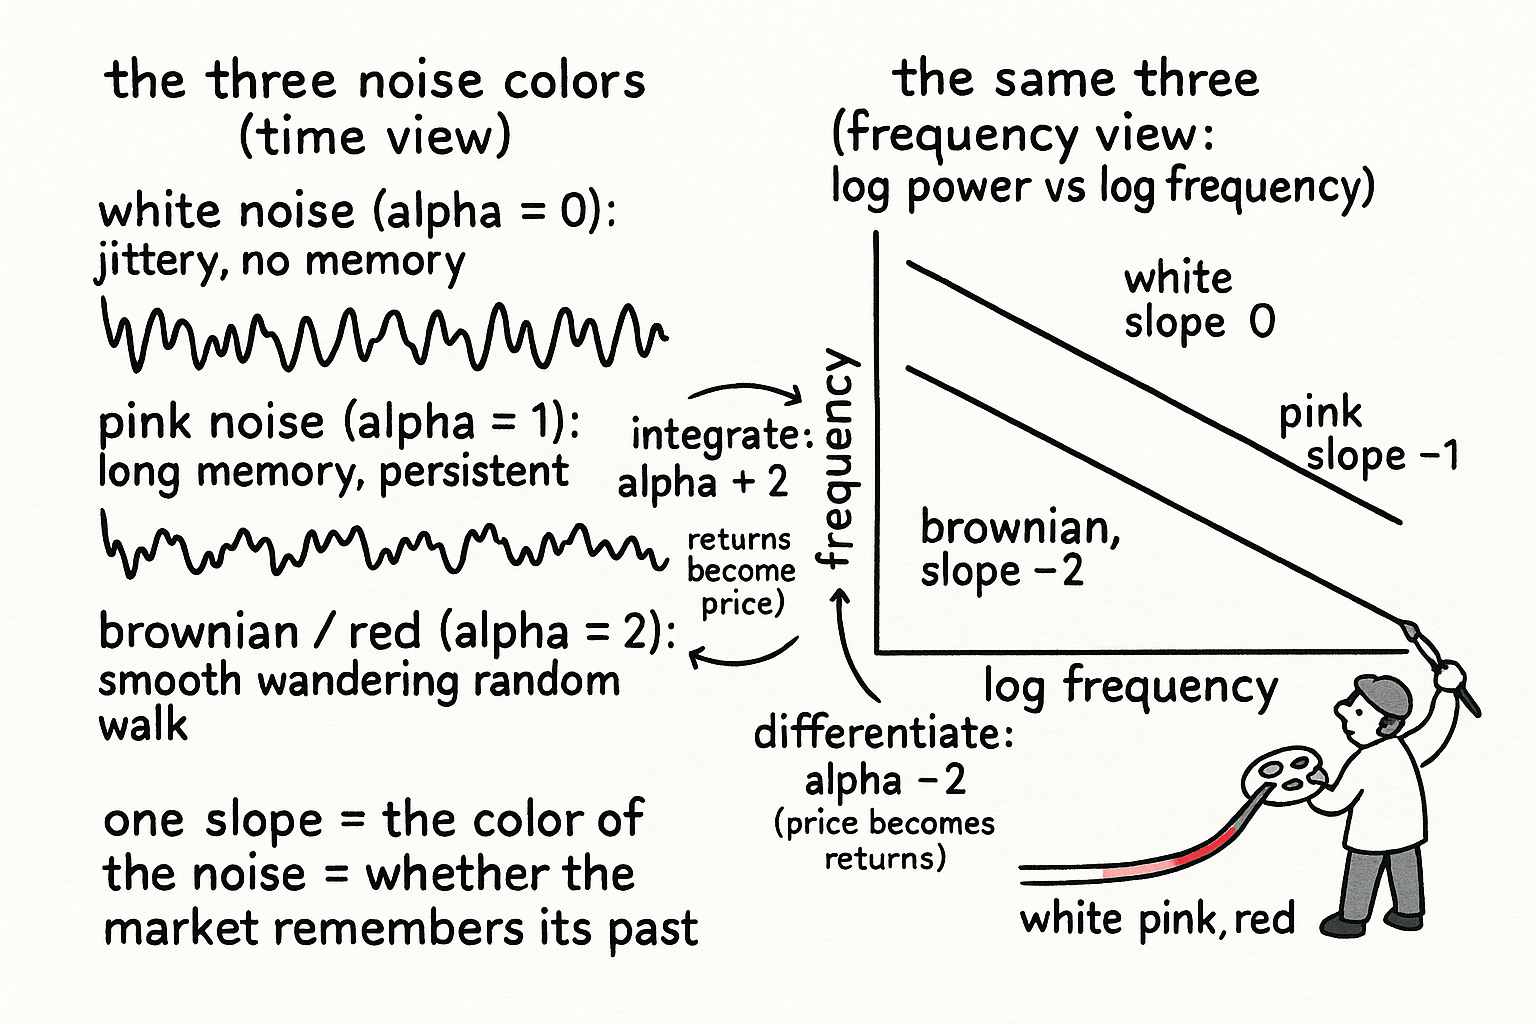
Plot log power against log frequency, draw the best straight line through it, and the slope is minus alpha. That slope is the color of the noise.
Three colors, three market personalities
White noise has alpha equal to zero. The spectrum is flat, every cycle speed carries the same power, and there is zero correlation in time. Each sample is independent of the last. A market that were pure white noise at your trading horizon would have no exploitable memory at all.
Brownian noise (also called red noise) has alpha equal to two. Power piles up at the slow end and collapses at the fast end. This is the spectrum of a random walk, which is what you get when you add up independent white-noise increments. Price itself usually lives near here, because price is the running sum of its returns, and summing is integration.
Pink noise sits between them at alpha equal to one. This is the interesting one. Pink noise is synonymous with long memory, what physicists call long-range dependence: the series is neither a fresh coin flip each bar nor a pure random walk, but something with persistent structure that decays slowly. The ubiquity of pink noise across physics, biology, and economics is one of the genuinely unsolved puzzles in science, and markets show it at many horizons.
Why returns and prices have different colors
Calculus moves the color, and the rule is clean: integrating a signal raises alpha by two, differentiating it lowers alpha by two.
$$ \text{integrate:}\;\; \alpha \rightarrow \alpha + 2 \qquad\qquad \text{differentiate:}\;\; \alpha \rightarrow \alpha - 2 $$
This explains a fact every quant half-knows. Returns are the difference (the derivative) of log price; price is the running sum (the integral) of returns. If returns were close to white (alpha near zero), integrating them gives price an alpha near two, which is the brownian spectrum of a random walk. Difference the price back into returns and you drop alpha back toward zero. So the same market wears different colors depending on whether you look at price or at returns, and the gap between the two slopes is pinned near two by construction. The corollary matters: you cannot turn brownian into pink with simple differencing, because differencing moves alpha in jumps of two, never by one. Genuine pink behavior, alpha near one, is a property of the data, not an artifact you can manufacture by transforming it.
What the slope buys a trader
The slope is a regime classifier that lives on the same axis as the efficiency ratio, approached from the frequency side instead of the time side. A return series whose slope sits near zero is close to white, motion cancels, and the old article's efficiency-ratio reading would be low, the fade environment. A return series with a slope pushed toward one carries long memory, moves reinforce across many lags, and the efficiency ratio would read higher, the trend environment. The two diagnostics agree because they are measuring the same persistence, one by net-distance-over-path, the other by where energy sits in the spectrum.
Two cautions before you build on it. The slope is a sample estimate, not a constant of the market, and it drifts as participants and volatility regimes change, the same non-stationarity that haunts every other indicator. And a slope estimate is only as honest as your frequency range: fit it over too few octaves of cycle period and the line you draw is mostly noise about the noise. Measure it over a wide span of periods, report it at the horizon you actually trade, and treat a shift in color as a regime change worth respecting rather than a number to optimize.
KEY POINTS
- Any series' power spectrum tends to fall off as one over frequency to a power, S(f) proportional to 1/f^alpha, so a single slope describes the whole spectrum once you plot log power against log frequency.
- White noise has slope alpha = 0 (flat spectrum, no time memory), brownian/red noise has alpha = 2 (the random-walk spectrum, power piled at slow cycles), and pink noise has alpha = 1, the long-memory case between them.
- Pink noise means long-range dependence: the series is neither independent each bar nor a pure random walk, but carries slowly decaying persistent structure.
- Integrating a signal raises alpha by 2, differentiating lowers it by 2. Price is the integral of returns, so price reads near brownian (alpha 2) while returns read near white (alpha 0); the two-step jump means you cannot manufacture genuine pink behavior by differencing.
- The slope is a regime classifier on the same axis as the efficiency ratio from the old article "Efficiency Ratio Explained for Traders," approached from frequency instead of time: slope near zero is the fade environment, slope pushed toward one is the trend environment.
- The estimate is non-stationary and only as good as the frequency range you fit it over. Measure across many octaves of cycle period, report it at your trading horizon, and treat a color change as a regime shift, not a parameter to optimize.