3.34 The Trade-Frequency Floor: Choosing a Threshold Honestly
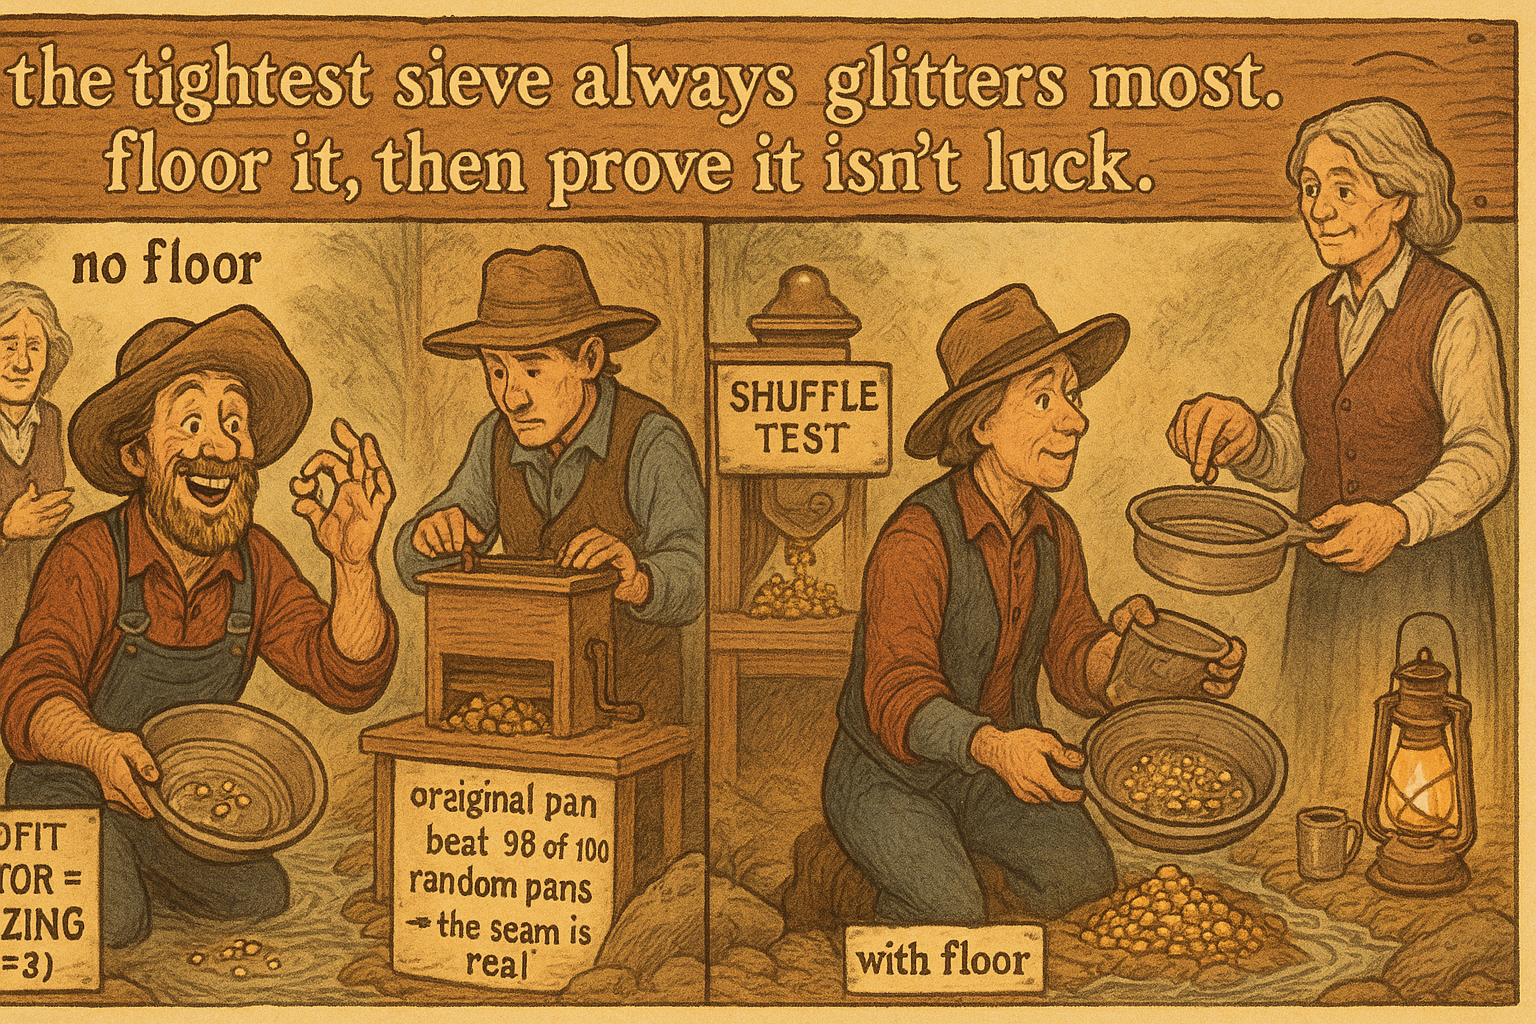
A threshold optimizer always loves the tightest setting, because a few lucky bars beat thousands of honest ones in-sample. Floor the trade frequency, then permute the returns to prove the edge isn't the search.
You have an indicator that correlates with next-bar returns. The old article "How to Test Indicator Thresholds Without Fooling Yourself" argued that finding such an indicator is most of the battle. The rest of the battle is picking the threshold that turns it into a rule, and that step quietly destroys more strategies than the indicator selection ever does. Set the threshold too loose and you take a flood of marginal trades that drown the edge in costs. Set it too tight and you take a handful of trades with a gorgeous profit factor that is pure luck. The optimizer, left alone, walks straight into the tight trap, because the tightest thresholds always look best in-sample. The defense is a floor on how often the rule fires.
The two traps a threshold optimizer faces
Sort your indicator values ascending and keep each one paired with the return that followed it. Now slide a candidate threshold up through the sorted values. For each candidate, everything above is the long region and everything below is the flat or short region, and you can read off the win count, loss count, and profit factor on each side.
$$ \text{Frac}_{>} = \frac{\#\{\text{cases with indicator} \ge \text{threshold}\}}{N}, \qquad \text{Frac}_{<} = 1 - \text{Frac}_{>} $$
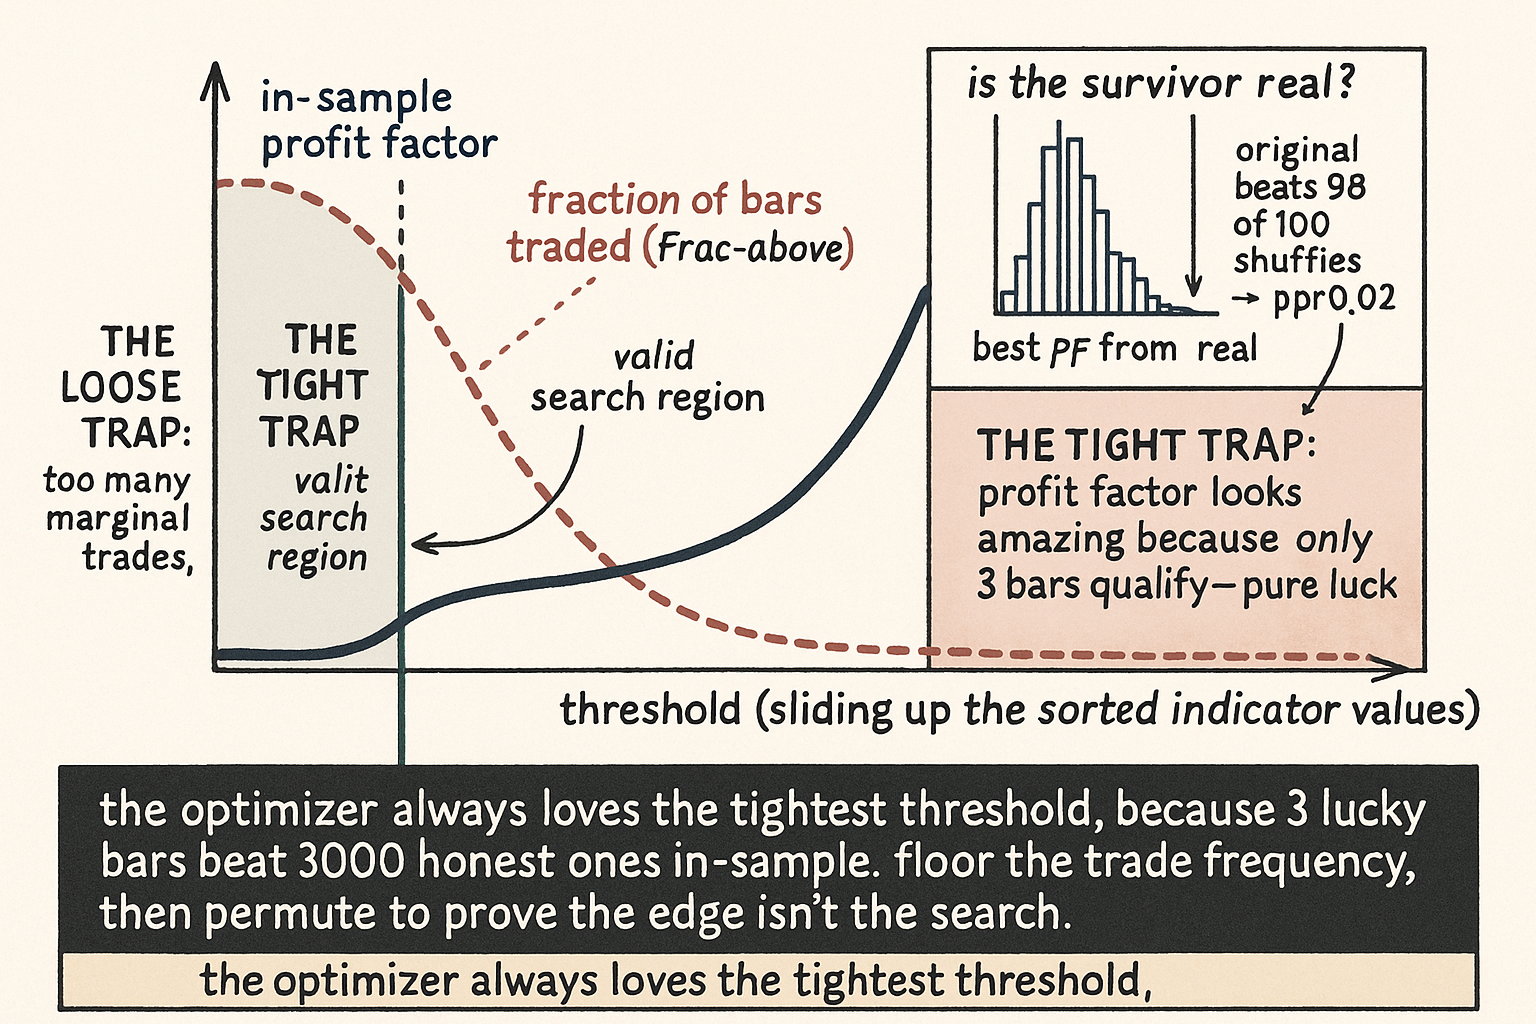
Frac-above is the fraction of all bars that clear the threshold, and Frac-below is the rest. Push the threshold to the very top of the sorted values and Frac-above shrinks toward zero: you are now selecting the two or three most extreme indicator readings in the whole sample. Those few bars almost always show a spectacular profit factor, because with three observations you can get any number you like by chance. That is the tight trap. Pull the threshold down toward the median and Frac-above grows, the profit factor regresses toward the indicator's true thin edge, and transaction costs start eating the trades that barely cleared the line. That is the loose trap.
An unconstrained optimizer maximizing profit factor will pick the tight end almost every time, because a sample of three lucky bars beats a sample of three thousand honest ones on any in-sample metric. The result is a threshold tuned to noise, and it has the same disease the old article "Why 30 Trades Is Not a Strategy" diagnosed: a performance number computed from too few events to mean anything.
The floor
Place a minimum on Frac-above before you let the optimizer choose. Require that any acceptable threshold trades on at least some fraction of the bars, say five or ten percent, and search for the best profit factor only among thresholds that clear the floor. The floor walls off the region where the optimizer manufactures fantasy results from a handful of observations, and forces it to find an edge that survives across a statistically meaningful slice of the data.
Two accounting details keep the search honest. When several bars share the same indicator value, a trial threshold can land on a run of ties, so the wins and losses for that trial are valid only at the first occurrence of the value; evaluate each distinct threshold once and do not let duplicates inflate your count. And keep "trades" and "bars" straight: a trade is one open-and-close of a position, while the bars are the individual returns inside it. The frequency floor is a floor on bars that satisfy the threshold, which is the unit that actually carries your statistical power, not on the smaller number of round trips.
Proving the floor is not enough on its own
A frequency floor stops you from overfitting to three bars, but it does not prove the surviving threshold has real predictive power. The optimizer is still searching, and a powerful enough search can split returns into wins and losses well even when the indicator carries no information at all. The test for that is permutation. Shuffle the returns to break their pairing with the indicator, re-run the full threshold optimization on the shuffled data, and record the best profit factor it finds. Repeat many times. If the indicator's edge is real, the original pairing should beat the shuffled ones; if the optimizer gets comparable profit factors from randomly paired returns, your threshold was an artifact of the search, not a property of the indicator.
$$ p \approx \frac{k + 1}{m + 1} $$
Here m is the number of shuffles you ran and k is how many of them produced a profit factor at least as good as the original, unshuffled result. The plus-ones keep the estimate honest by counting the original arrangement as one of the possible outcomes. A small p means the optimizer rarely matched your result by chance, so the indicator-return pairing did the work. A p near a half means correct pairing bought you nothing over random pairing, and the threshold, floor or no floor, is worthless. Run as many shuffles as you can afford, because the p-value is itself a noisy estimate, and one shuffle proves nothing on a coin that lands the right way half the time.
The honest workflow is both steps together: a frequency floor so the optimizer cannot hide in a corner of three lucky bars, and a permutation test so you can see whether the threshold that cleared the floor reflects the indicator or reflects the search. Skip the floor and you overfit to extremes; skip the permutation and you trust a search that can fool you on noise.
Visualizing the threshold sweep
KEY POINTS
- Finding an indicator that correlates with returns is most of the battle; choosing the threshold that turns it into a rule is the step that quietly kills strategies.
- Sort indicator values ascending, keep each paired with its following return, and slide a candidate threshold up through them, reading win count, loss count, and profit factor on each side.
- The loose trap (threshold near the median) floods you with marginal trades that costs eat. The tight trap (extreme threshold) selects a handful of bars whose spectacular profit factor is luck.
- An unconstrained optimizer maximizing profit factor walks into the tight trap, because three lucky bars beat thousands of honest ones on any in-sample metric, the same too-few-events disease from the old article "Why 30 Trades Is Not a Strategy."
- The defense is a trade-frequency floor: require any acceptable threshold to fire on at least some fraction of the bars (say 5-10%), and search for the best profit factor only above the floor.
- Evaluate each distinct threshold once so tied indicator values do not inflate counts, and floor the bars that satisfy the threshold, not the smaller number of round-trip trades, because bars carry the statistical power.
- The floor stops overfitting to extremes but does not prove predictive power. Permute: shuffle returns to break the pairing, re-optimize, and compute p as (k+1)/(m+1) where k of m shuffles matched the original. A small p means the indicator did the work; p near a half means the threshold is an artifact of the search.
References
- Permutation test (Wikipedia)
- Monte Carlo permutation methods for trading systems
- Overfitting and in-sample optimization bias
- Developing & Backtesting Systematic Trading Strategies
- Testing and Tuning Market Trading Systems - Timothy Masters (Amazon)
- Data Mining Algorithms in C++ - Timothy Masters (Amazon)
- Backtesting
- Walk Forward Correlation: A Diagnostic for Over-Fitting and Structural Edge in Trading Strategies
- An Explainable Walk-Forward and Bootstrap Backtesting Framework for SPY Equity Strategy Development
- A Rigorous Walk-Forward Validation Framework for Market Regimes in Algorithmic Trading
- The GT-Score: A Robust Objective Function for Reducing Overfitting in Data-Driven Trading Strategies
- TradeBot: Bandit Learning for Hyper-Parameters Optimization of High Frequency Trading Strategy
- A Novel Approach to Trading Strategy Parameter Optimization, Using Walk-Forward Analysis
- Trading Strategies and Financial Performances: A Simulation Approach