3.33 Why You Compute Profit Factor Per Bar, Not Per Trade
Hold a position while an indicator stays above a threshold and there is no natural "trade." Group bars into holds and profit factor can hit infinity. Count bars with log returns and it stays honest.
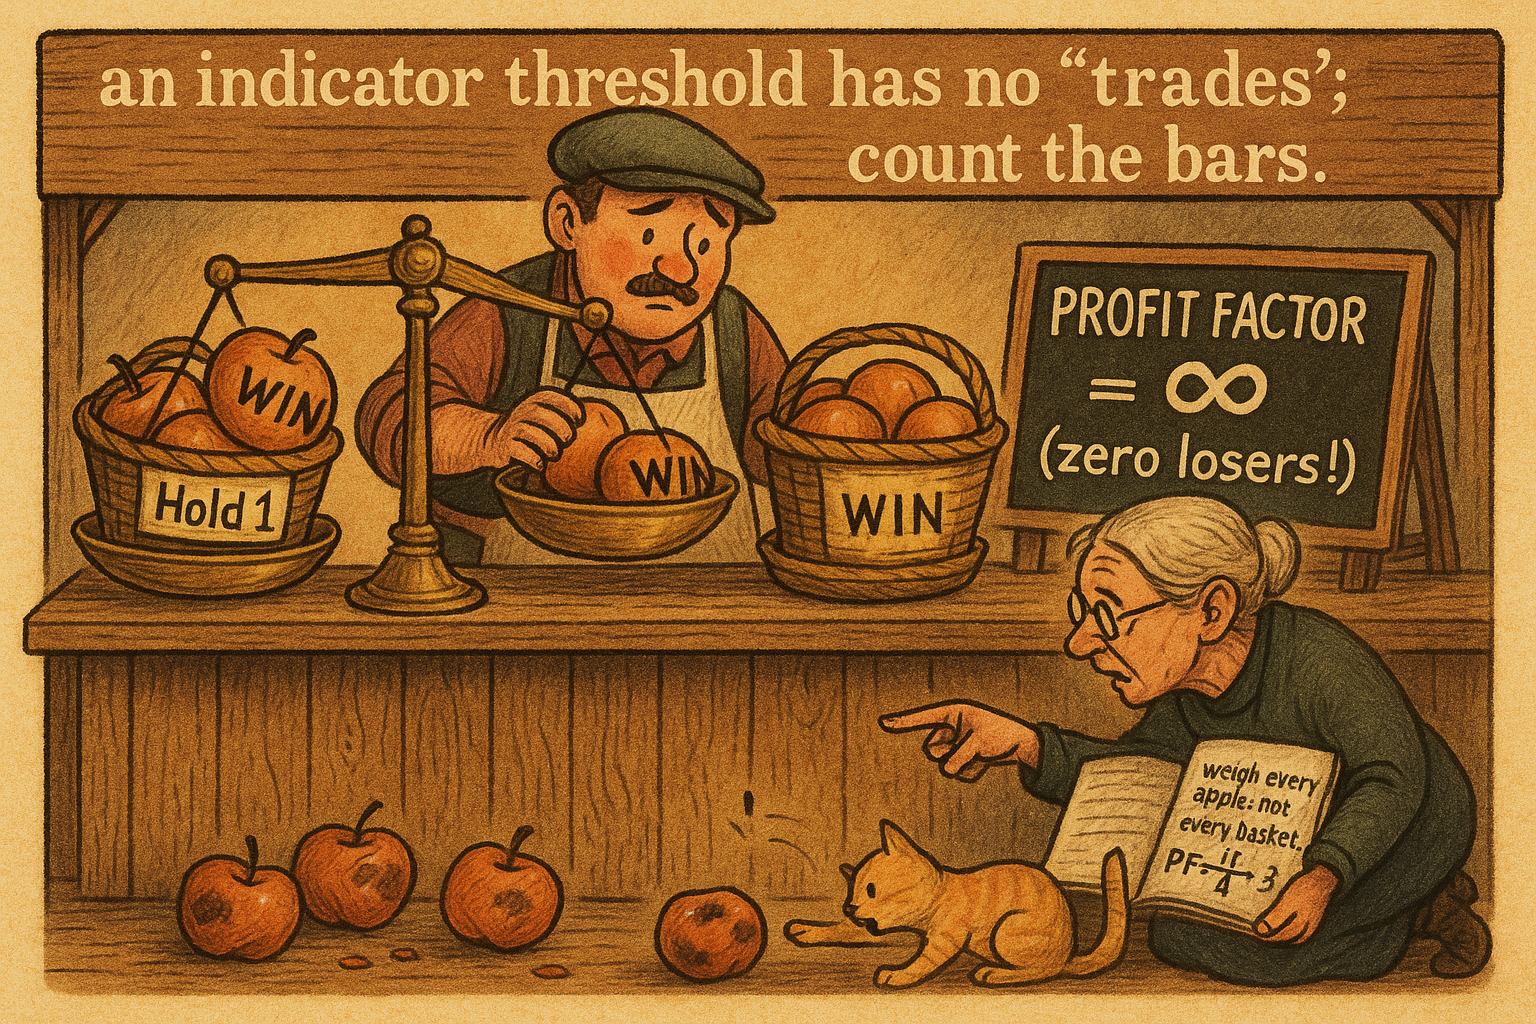
The old article "Why Profit Factor Can Lie" showed how three lucky winners inflate the headline number. There is a second, quieter way profit factor lies, and it shows up the moment you test an indicator with a threshold rule rather than discrete entries and exits. Hold a position for as long as the indicator stays above some level, and the question of what counts as a "trade" stops having an obvious answer. Answer it the convenient way, by grouping every consecutive bar of a hold into one trade, and you can manufacture a profit factor of infinity out of an indicator that is barely better than a coin. The fix is to stop counting trades and start counting bars.
The grouping artifact
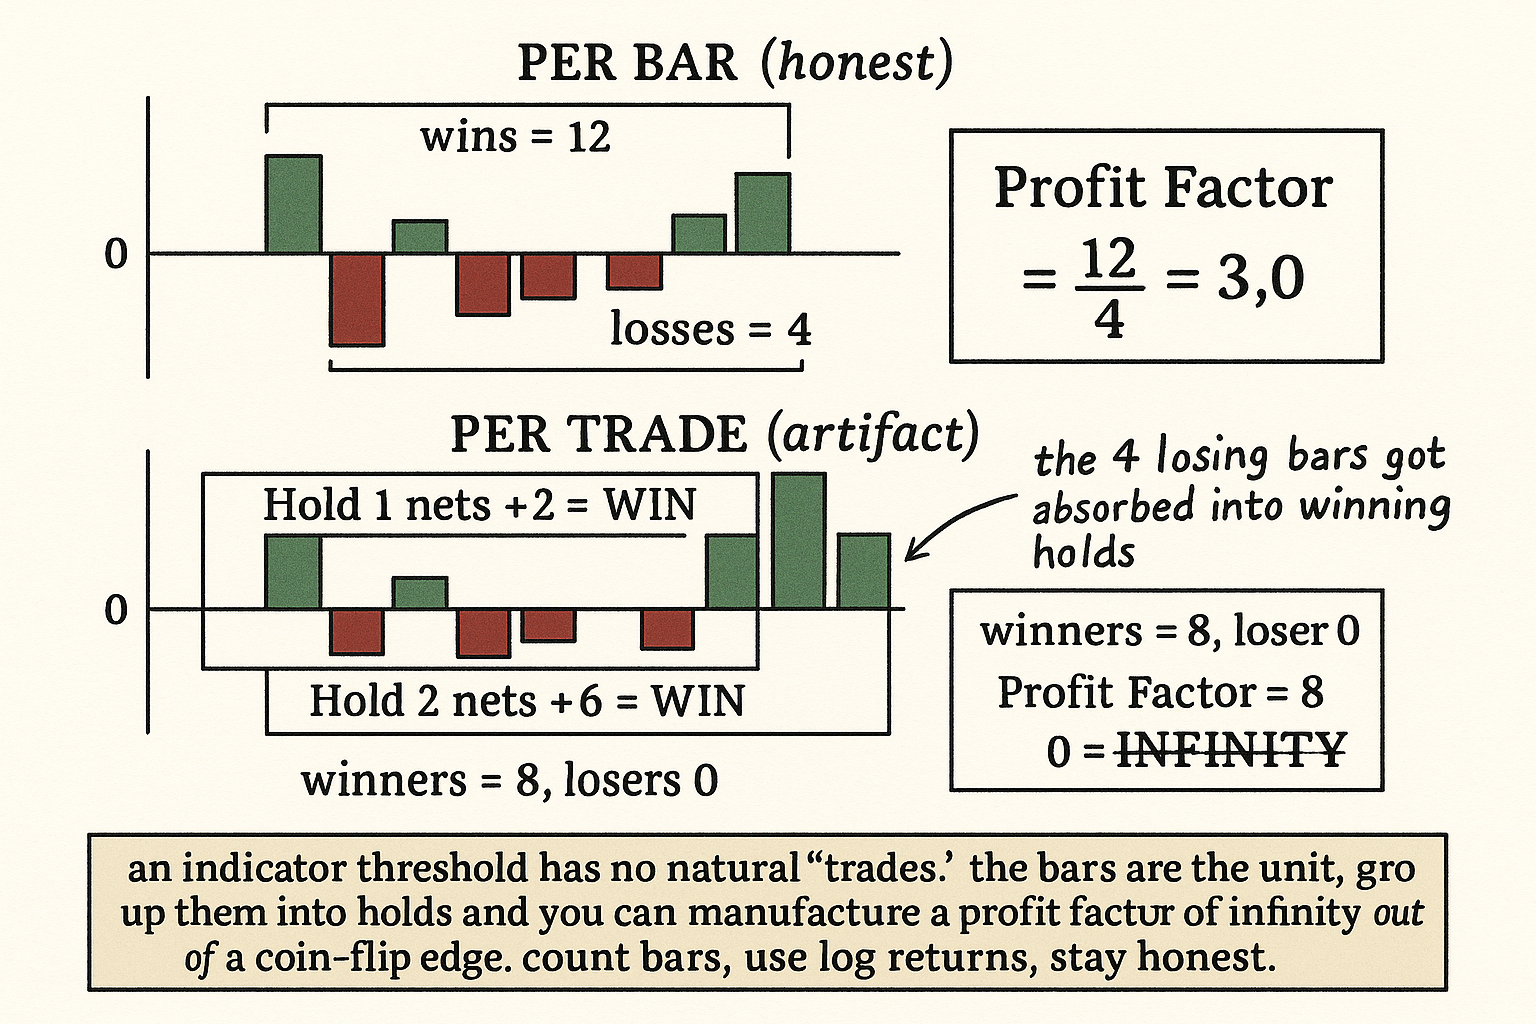
Threshold testing works like this: you stay long while the indicator sits above its threshold and flat otherwise, so a single "position" can run for one bar or forty. Take one such position that ran five bars, with per-bar log returns of 1, 3, -2, -2, 2, then later another that ran three bars at 2, 3, 1. The honest accounting treats each bar as its own outcome. Sum the up-bars, sum the down-bars, divide.
$$ \text{PF}_{\text{bar}} = \frac{\sum_{i:\, r_i > 0} r_i}{\sum_{i:\, r_i < 0} |r_i|} = \frac{1+3+2+2+3+1}{2+2} = \frac{12}{4} = 3 $$
Each term is a single bar's log return, the up-bars on top and the absolute value of the down-bars on the bottom. Now do it the lazy way. Net each hold into one number: the first position nets 1+3-2-2+2 = 2, the second nets 2+3+1 = 6. Both holds finished positive, so there are two winning trades and zero losing trades.
$$ \text{PF}_{\text{trade}} = \frac{2 + 6}{0} = \infty $$
Zero in the denominator, profit factor of infinity, and the indicator looks flawless. It is not. Inside those holds were four losing bars that the netting quietly absorbed. The per-bar profit factor of 3 is the truth; the per-trade infinity is an artifact of where you happened to draw the trade boundaries.
Why grouping is the wrong unit here
A discrete strategy has natural trade boundaries: you decide to open, you decide to close, and the round trip is a real event you could point to on a chart. A threshold rule has no such events. You are not making entry and exit decisions; you are continuously in or out as a function of one indicator, and the bars are the only natural unit of P&L. Grouping consecutive in-bars into a "trade" is an arbitrary choice, and the arbitrariness is the problem. The longer your average hold, the more down-bars get buried inside winning holds, and the more the per-trade profit factor drifts above the per-bar truth, all the way to infinity once no single hold happens to net negative.
The infinity is the tell, but the distortion is there long before you hit it. An indicator with a per-bar profit factor of 1.2, a thin but real edge, can show a per-trade profit factor of 4 or 5 simply because its holds are long enough to net positive most of the time. You would chase that 4 into production and discover the 1.2 the hard way.
One more reason to work in bars: log returns add. A bar's log return plus the next bar's log return equals the two-bar log return, so summing up-bars and down-bars across the whole test is exact, with no compounding error and no dependence on how you slice the holds. Raw percentage returns do not add cleanly, so use logs and the accounting stays honest no matter how long the position runs.
What this changes in practice
Compute profit factor per bar whenever the position is driven by an indicator threshold, an indicator-and-model output, or anything that keeps you in for a variable, signal-determined number of bars. Reserve per-trade profit factor for genuinely discrete strategies with explicit, rule-based entries and exits, where a round trip is a real decision and not an accident of where a threshold lapsed. Mixing the two is how a methodology paper reports a profit factor that no live account ever reproduces.
This sits next to the lesson from "Why Profit Factor Can Lie." That article warned that a few outlier trades dominate the ratio; this one warns that the act of forming trades at all can dominate the ratio. Both collapse to the same discipline: define your unit of P&L before you compute anything, prefer the smallest natural unit, and distrust any profit factor that depends on how you grouped the data rather than on the data.
Visualizing the artifact
KEY POINTS
- A threshold rule keeps you in a position for a variable, signal-determined number of bars, so there is no natural definition of a "trade." The bars are the only natural unit of P&L.
- Group consecutive in-bars into one trade and net them, and losing bars get absorbed into winning holds. Once no single hold nets negative, the denominator is zero and per-trade profit factor goes to infinity.
- The same data computed per bar (sum of up-bars over the absolute sum of down-bars) gives the honest, finite number. In the worked example, per bar is 3.0 while per trade is infinity.
- The distortion exists long before infinity: a per-bar edge of 1.2 can show a per-trade profit factor of 4 or 5 purely because the holds are long enough to net positive.
- Use log returns so per-bar P&L adds exactly across any hold length, with no dependence on how you sliced the position.
- Compute per-bar profit factor for indicator-threshold and model-output rules; reserve per-trade profit factor for genuinely discrete strategies with explicit rule-based entries and exits.
- This is the second way profit factor lies, alongside the outlier domination from the old article "Why Profit Factor Can Lie." Both reduce to one rule: fix your unit of P&L before computing, and distrust any profit factor that depends on grouping rather than on the data.
References
- Profit factor in trading system evaluation (Investopedia)
- Logarithmic returns and why they add (Wikipedia)
- Backtesting and performance measurement pitfalls
- Developing & Backtesting Systematic Trading Strategies
- Testing and Tuning Market Trading Systems - Timothy Masters (Amazon)
- Data Mining Algorithms in C++ - Timothy Masters (Amazon)
- Futuretesting Quantitative Strategies
- The GT-Score: A Robust Objective Function for Reducing Overfitting in Trading Strategy Optimization
- A Rigorous Walk-Forward Validation Framework for Market Microstructure-Based Algorithmic Trading
- AlgoXpert Alpha Research Framework: A Rigorous IS–WFA–OOS Architecture for Systematic FX Trading
- Multi-Timeframe Signal Confirmation in Algorithmic Cryptocurrency Trading
- Genetic Asset Management (GAM)
- BLT Engine Performance Report
- Monte Carlo method in stock trading research based on accelerated diffusion model and stochastic differential equations with jumps