10.23 Learning to Rank, the Original: Pairwise and Listwise Cross-Sectional Momentum
Cross-sectional momentum keeps the order and throws the forecast level away. A pairwise loss trains which name outranks which. Squared error can tie and still swap the book.
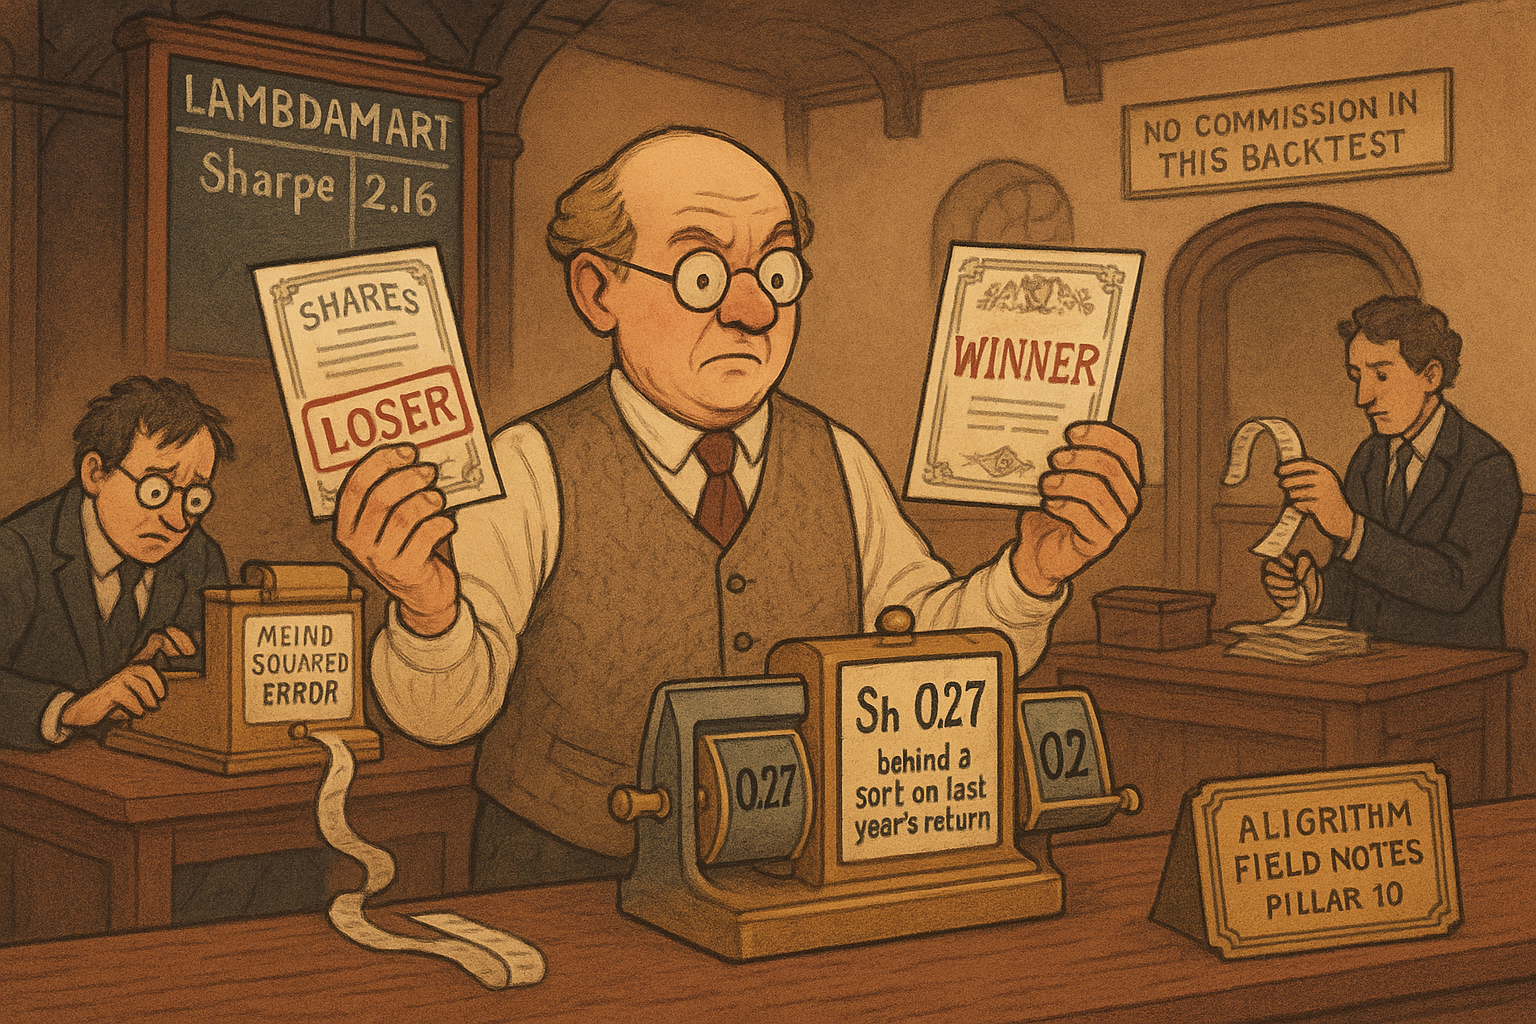
You rebalance a long-short of NYSE names once a month, and you keep the top 100 and the bottom 100. The score's level never enters the book. A loss that matches next month's return, one name at a time, can land on the same average error and still hand you the opposite two names. Pairwise and listwise losses train the order the book actually trades. Poh, Lim, Zohren, and Roberts run that comparison from 1980 to 2019, volatility-scaled near a 15% target, with no costs.
Squared error can swap the book
The regress-then-sort network fits a score to next month's return divided by a trailing volatility, one name at a time. Their equation (11) is the mean squared gap.
$$ \mathcal{L} = \frac{1}{M}\sum_{i}\left(Y_{i} - \frac{r_{i}}{\sigma_{i}}\right)^{2} $$
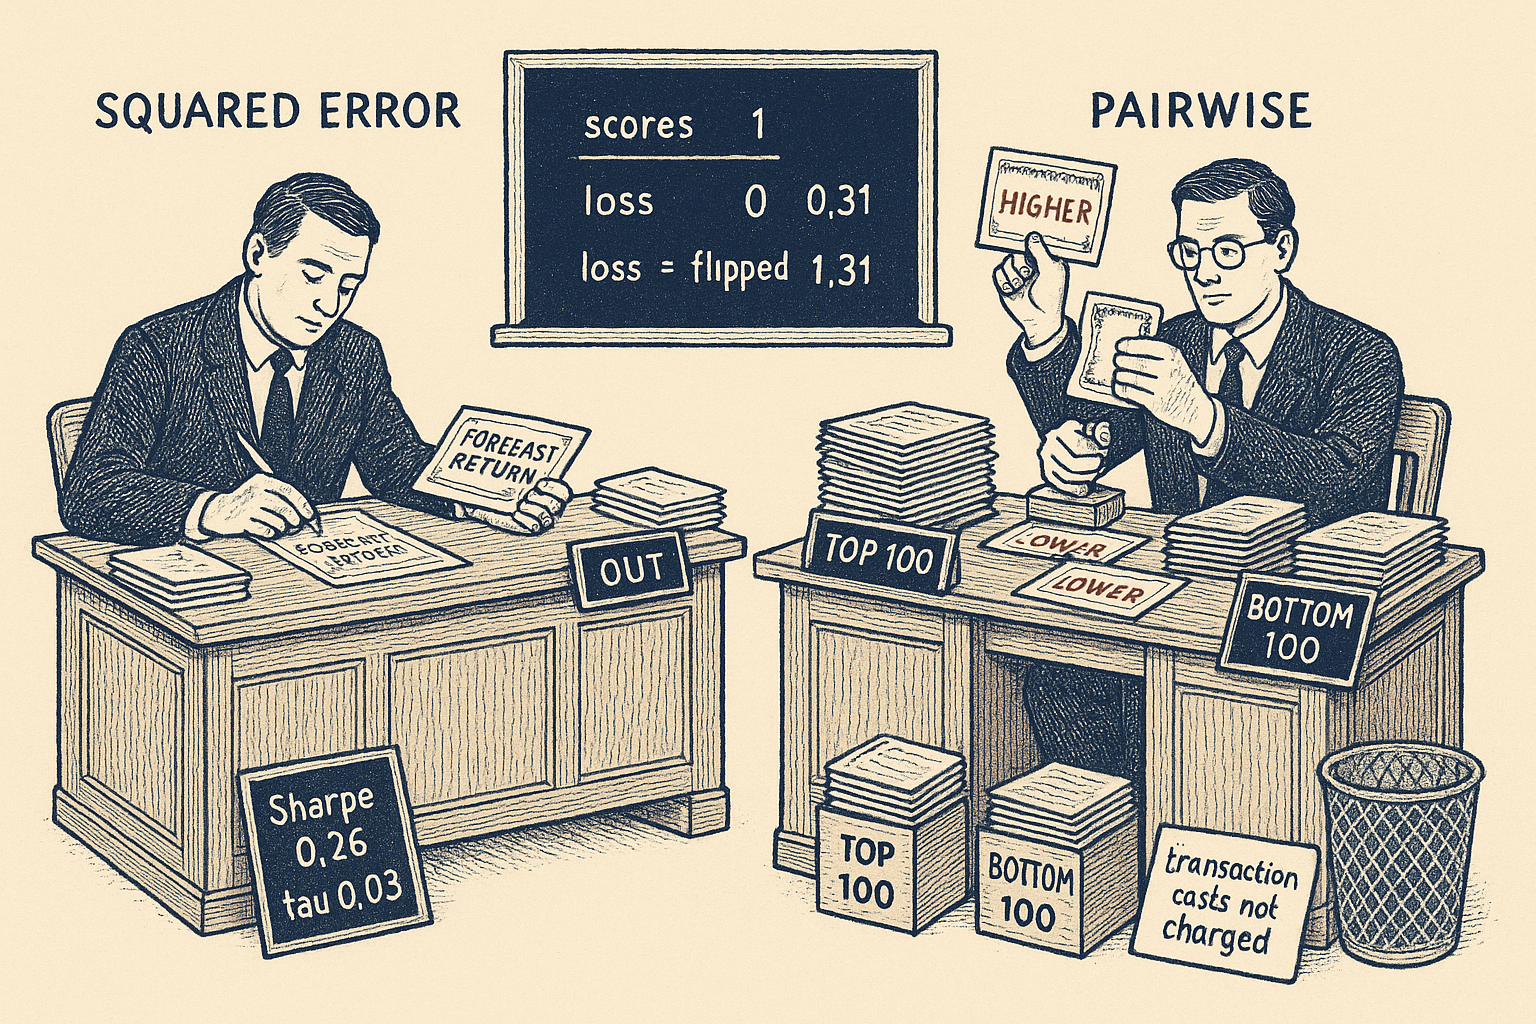
Y is the score you are fitting. r is next month's return. Sigma is a volatility computed from past returns, so the target is in units of recent volatility. M is the number of name-months in the sum. Take two names whose targets are 0.30 and 0.10. Forecast 0.10 and 0.30. The errors are -0.20 and +0.20, and the mean squared error is 0.04. Forecast 0.50 and 0.30. The errors are +0.20 and +0.20, and the mean squared error is 0.04 again. The first forecast ranks the worse name above the better one. The second keeps the order and misses the level by the same amount on both. You cannot tell those two forecasts apart from the loss. You then throw the level away and keep the top of the list, the same percentile cut as the old article "Cross-Sectional Percentile Rank Within a Universe." The old article "Ranking Beats Forecasting for Many Trading Problems" is this objection. On this sample the network, fit by that loss and then sorted, loses to a raw trailing-return sort.
The rankers change the label as well as the loss. At each month the label is the next rebalance's return decile, from 1 to 10, and a higher decile is defined to outrank a lower one. They never publish the run that changes only the loss and keeps the return as the label.
A pair has a winner
RankNet trains on every pair. The probability that name i outranks name j is a logistic of the score gap, and the loss is the cross-entropy of that probability against a label that is 1 when i's decile is the higher one. The paper describes this and does not print it.
$$ P_{ij} = \frac{1}{1+\exp(-(s_i-s_j))}, \qquad C_{ij} = -\bar{y}_{ij}\log P_{ij}-(1-\bar{y}_{ij})\log(1-P_{ij}) $$
You compute that on one pair. Scores of 1 and 0, with the higher score on the name that should win, give a probability of 0.73 and a loss of 0.31. Reverse the scores and the probability is 0.27 and the loss is 1.31, higher by exactly 1. The squared-error sum has no pair in it, so it never charges that extra 1. The cost of the method is the count. Training walks the pairs, and the work grows with the square of the number of names at the rebalance.
The whole list is one draw
ListNet drops the pairs. It turns the scores into the probability each name is ranked first, does the same for the labels, and charges the cross-entropy between those two distributions. A softmax does the turning. The paper describes this and does not print it.
$$ P_{j}(s)=\frac{\exp(s_{j})}{\sum_{k}\exp(s_{k})}, \qquad L=-\sum_{j}P_{j}(y)\log P_{j}(s) $$
Three names, labels 3, 1, and 0. The exponentials are 20.09, 2.72, and 1, and they sum to 23.81, so the label distribution is 0.844, 0.114, 0.042. Scores of 1, 2, and 0 put the middle name on top. Their exponentials are 2.72, 7.39, and 1, sum 11.11, distribution 0.245, 0.665, 0.090. The cross-entropy is 1.34. Scores that copy the labels, 3, 1, and 0, bring it down to 0.52. Both numbers use the whole list. A pairwise loss would have scored three separate coins and never seen that the top probability has to add up with the other two.
ListMLE goes after the likelihood of the observed order, best name first. The paper picks it because the likelihood is consistent, and again does not print the product. You walk down the true order. At each step the name that should come next is scored against the names still remaining.
$$ L=-\sum_{i=1}^{n}\left(s_{\pi_{i}}-\log\sum_{k=i}^{n}\exp(s_{\pi_{k}})\right) $$
Pi is the true order. The first term is the score of the name that should be first, minus the log of the sum of exponentials of everyone still in line, including that name. Then you drop that name and repeat. Scores 2, 1, 0 already in the true order cost 0.72. The reversed scores 0, 1, 2 cost 3.72, higher by 3. Consistency says a model that gets the order right should be preferred as the sample grows. It does not say the likelihood wins on a noisy five-year window.
The top of the list is worth more
LambdaMART never evaluates a loss value. It boosts trees on lambda-gradients. The paper's description is a pairwise gradient multiplied by the change in normalized discounted cumulative gain, NDCG, from swapping that pair. NDCG discounts a hit by its position, and they cut it off at 100 because that is the wing they trade. The gain itself is the usual one. The paper does not print it.
$$ \mathrm{DCG}=\sum_{i=1}^{n}\frac{2^{\mathrm{rel}_{i}}-1}{\log_{2}(i+1)}, \qquad \mathrm{NDCG}=\frac{\mathrm{DCG}}{\mathrm{DCG}^{*}} $$
rel is the relevance of the name sitting in position i, here the return decile. DCG-star is the same sum on the perfect order, so NDCG equals 1 when the list is right. Three names with relevance 3, 1, 0, already in order, have a DCG of 7.63 and an NDCG of 1. Swap the top two and the DCG falls to 5.42, so NDCG falls to 0.71, a drop of 0.29. Swap the bottom two instead and NDCG only falls to 0.98. The same pair-mistake costs more at the top, which is the end of the list the long-short actually holds. The lambda multiplies the RankNet pair-gradient by that drop, and the trees are fit to the lambdas. Their booster uses the pairwise ranking objective and NDCG as the evaluation metric.
The test, and the haircut
Look at the brown line against the orange and green lines sitting near the bottom of the log scale.
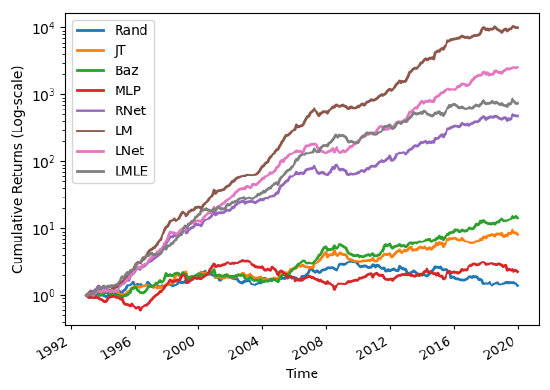
The brown line is LambdaMART. It finishes between the 10^3 and 10^4 gridlines. The trailing-return sort and Baz's volatility-normalized moving-average spread finish near 10. The red network finishes down beside the random book. The paths run out of sample from the early 1990s through 2019. They retune every five years, 50 hyperparameter trials in each window, and freeze the model for the next five. They rebalance on the last trading day of the month, and they pin every book a second time near 15%, so a Sharpe gap is a return gap. Sharpe here is mean return over volatility, with no risk-free rate removed.
LambdaMART's Sharpe is 2.16. Baz's is 0.70. The trailing-return sort is 0.55. The network, on the same momentum features as the rankers, is 0.27. Dividing 2.16 by 0.70 gives 3.1, the comparison behind their approximate threefold. ListNet, ListMLE, and RankNet print 1.97, 1.61, and 1.50. The consistent likelihood finishes behind the booster. They put that down to sample size. A listwise model sees one list per month. A pairwise model sees that list times the number of names again. They do not print the average universe. One hundred names is about a tenth of what they call tradeable, so the universe is on the order of a thousand, about 12,000 lists a year against about 12 million pairs.
In the LambdaMART panel, compare the top line with the bottom line. The network's panel, top right, stays bunched.
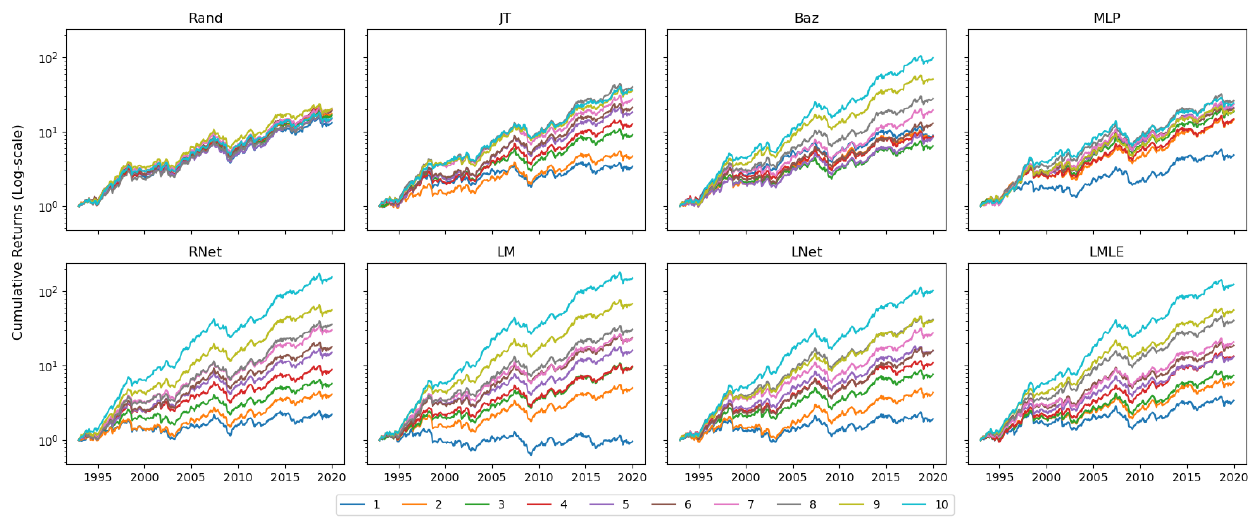
Kendall's tau, the rank correlation over the whole list, averages 0.03 for the rankers and 0.01 for the network. A tau of 0.03 barely orders the full list. The wings still separate. LambdaMART's worst decile prints a Sharpe of 0.08 and its best prints 1.23. The network's decile Sharpes run from 0.44 to 0.83 and are not monotonic.
You fit a pairwise or listwise loss, and you label each name with next month's return decile. The features are raw returns over 3, 6, and 12 months, those returns divided by volatility, and volatility-normalized moving-average signals lagged out to a year. You hold the outer 100 names on each side, scale each name by 15% over a 63-day exponentially weighted volatility, then scale the book to 15%. The neural rankers train on a 21-day forward return rather than the calendar month the book holds.
I am against fitting the level and sorting the fit. On this test that drawdown is 0.64, against 0.33 for the trailing-return sort, and the annual return falls from 0.36 to 0.04 at the same 15% volatility.
The second mistake is trading the gross Sharpe. The test turns 200 names a month and never charges a spread. Turnover is unreported, so the paper gives you no cost to subtract. The old article "Momentum Is a Ranking Problem: Learning-to-Rank vs Regress-then-Rank" runs LambdaMART on a different cross-section, and the equity Sharpe shrinks once the rebalance slows. They also never say whether a delisting return enters the P&L. CRSP here is the Center for Research in Security Prices: NYSE share codes 10 and 11, price above one dollar, a full prior year of trading.
KEY POINTS
- Fit the order. The book keeps the top and bottom 100 and throws the score's level away.
- Treat a squared error of 0.04 as ambiguous. One forecast with that error keeps the order, and one swaps it.
- Charge the pair. Scores of 1 and 0 cost 0.31 when the order is right and 1.31 when it is flipped.
- Weight the top of the list. Swapping the top pair drops NDCG from 1 to 0.71. Swapping the bottom pair drops it to 0.98.
- Haircut the winner before Monday. LambdaMART's Sharpe is 2.16 on a test that turns 200 names a month and charges no spread.