8.8 Itô Calculus, Intuitively
Stochastic calculus is one twist on the integral you know. Riemann weights rectangles by equal width, Riemann-Stieltjes by a function g, Itô by Brownian motion. Random weights make the integral a process Y(t).
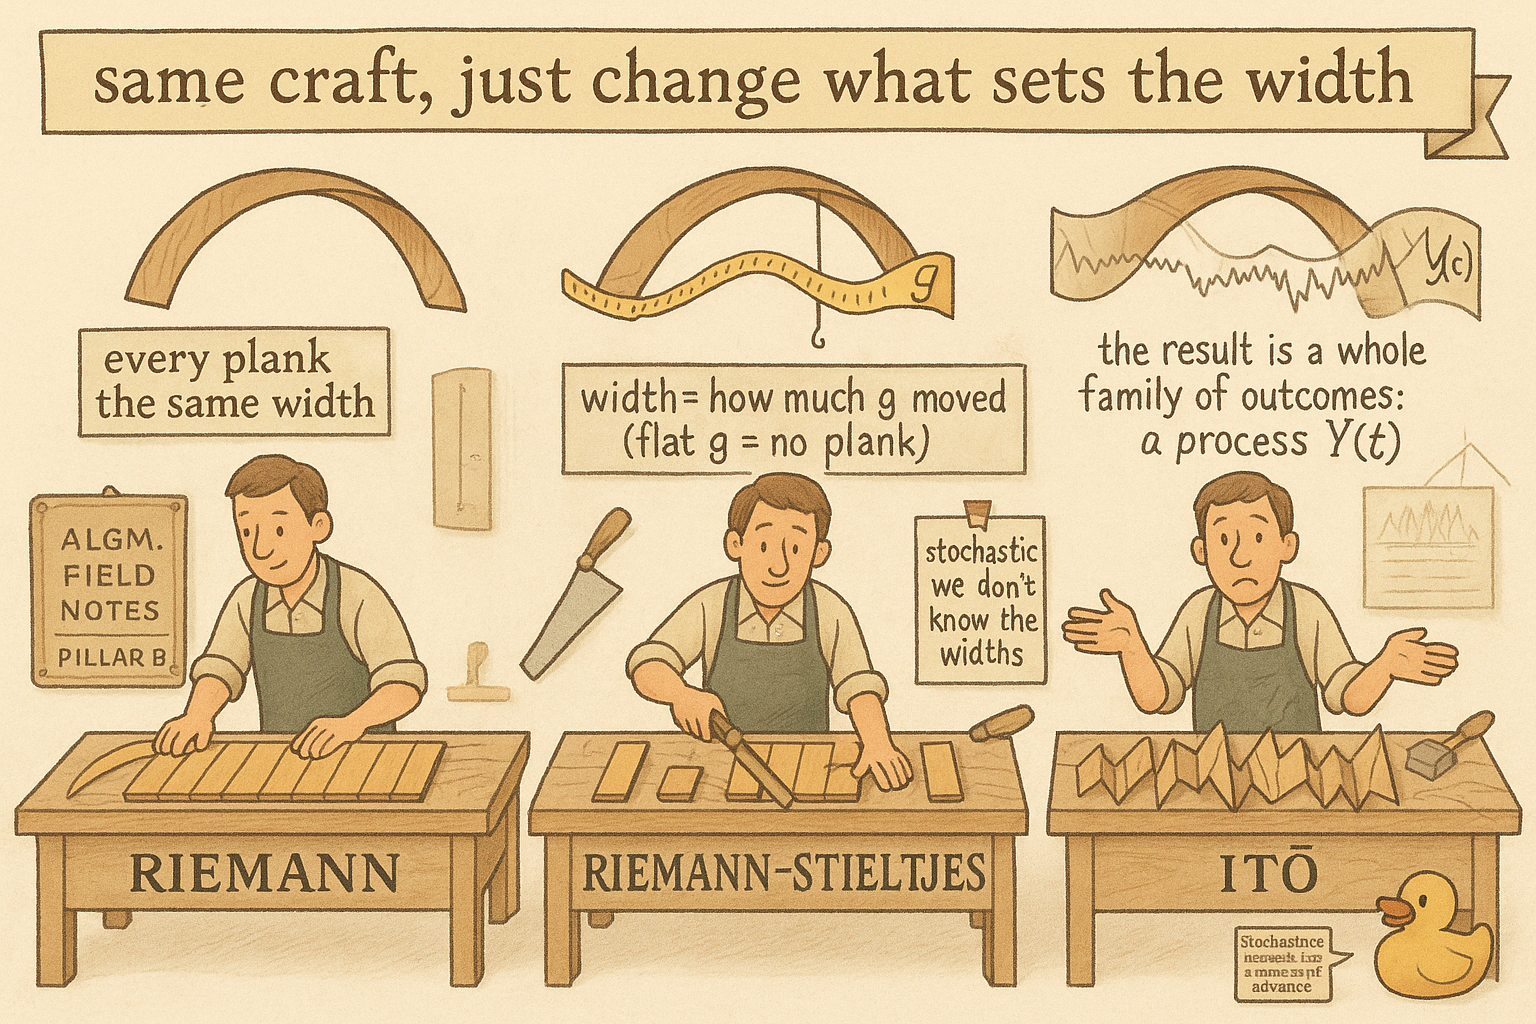
Stochastic calculus reads as a wall of unfamiliar symbols, and most traders bounce off it and decide the math behind every price model is beyond them. It is not. The central object, the Itô integral, is one small twist on the integral you already met in school, and you can get to it in three steps that each change exactly one thing. Build it that way and the symbols stop being a wall. They start telling you something concrete about a price that wanders.
Step one: the Riemann integral you already know
Start with the ordinary integral. You want the area under a curve f, so you chop the horizontal axis into thin rectangles, take the height of f on each slice, multiply by the width, and add them up. Make the rectangles thinner and add more of them, and the sum converges to the area.
$$ \int_a^b f(x)\,dx \;\approx\; \sum_i f(x_i)\,\Delta x \qquad (\Delta x \to 0) $$
Read that as: every rectangle has the same kind of width, a plain step along the x axis written as delta-x, and the integral is the limit of the rectangle sum as those widths shrink to zero. The thing to notice, because it is the thing the next step changes, is that each rectangle is weighted by an equal step in x. Every slice counts the same amount of horizontal distance.
Step two: weight the rectangles by another function
The Riemann-Stieltjes integral changes one thing. Instead of weighting each rectangle by a fixed step in x, you weight it by the change in some second function g across that slice.
$$ \int_a^b f(x)\,dg(x) \;\approx\; \sum_i f(x_i)\,\Delta g_i $$ $$ \text{if } g \text{ is smooth: } \int_a^b f(x)\,dg(x) = \int_a^b f(x)\,g'(x)\,dx $$
Read the top line as: the same rectangle sum, but each height f is now multiplied by delta-g, how much g moved over that slice, rather than by a constant delta-x. The bottom line is the sanity check: when g is well behaved, this is just the ordinary integral of f times the derivative of g, so nothing exotic has happened yet. Two cases pin the intuition. If g is constant it never moves, so every delta-g is zero and the whole integral is zero, no matter what f does. If g is the identity, g of x equals x, then delta-g equals delta-x and you are back to the plain Riemann integral. So Riemann-Stieltjes is a strict generalization: it lets the weighting come from the behavior of g instead of from uniform horizontal steps.
Step three: make the weighting function random
Here is the only real leap, and it is small. Replace g with Brownian motion. The Itô integral weights each rectangle by the change in a Brownian path rather than the change in a deterministic function.
$$ \int_0^t f \,dW \;\approx\; \sum_i f(t_i)\,\Delta W_i, \qquad \Delta W_i = W_{t_{i+1}} - W_{t_i} $$
Read that as: the same construction one more time, but now each height f is multiplied by delta-W, the increment of a Brownian motion over that slice. Brownian motion is the random walk in continuous time, the canonical model of an unpredictable wandering path, and its increments delta-W are random, so the weights themselves are random. The consequence falls straight out: because the path W could have wandered any number of ways, the value of the integral is not a single number. It is a random variable, with its own distribution. You ran the same rectangle sum, but the answer now has a spread because the thing you weighted by has a spread.
What you actually get: a process, not a number
In trading you care about systems that evolve, so you take the integral from time zero up to a running time t and watch how it grows.
$$ Y(t) = \int_0^t f \,dW $$
Read that as: for every horizon t, the integral from zero to t gives you Y of t, and because the Brownian increments inside are random, Y of t is itself random, carrying a probability distribution at each point in time. Sweep t forward and you trace out a whole family of possible paths, which is a stochastic process. That is the payoff: the Itô integral does not output an area, it outputs a process whose value at each instant is a distribution rather than a point. And the integrator does not have to be plain Brownian motion. In full Itô calculus both the integrand f and the integrator can themselves be stochastic processes, which is what lets you write a price whose volatility is also random and wandering.
Why this is the engine under your price models
This machinery is the thing under the hood every time you see a price written as a drift term plus a noise term. The old article "Log-Normal Prices and the Price/Volume Trick" models a price as geometric Brownian motion, and the noise piece of that model, the part written with a dW, is exactly the Itô integral built above: the accumulated effect of random Brownian kicks weighted by the current price. When a model says volatility scales the dW term, it is saying f in the integral is the volatility and the integrator is the Brownian path, so the price process Y of t inherits its randomness from the integral. The whole apparatus of diffusion that the old article "Long-Range Dependence: Real Memory or Just Short-Range Echo?" leans on, the idea that price changes accumulate like a wandering walk, is this same integral run forward in time. You do not have to solve these integrals by hand to trade. Knowing what they mean tells you why a price model has a deterministic part you can reason about and a random part you can only describe by its distribution, and that split is the whole reason risk is a distribution and not a forecast.
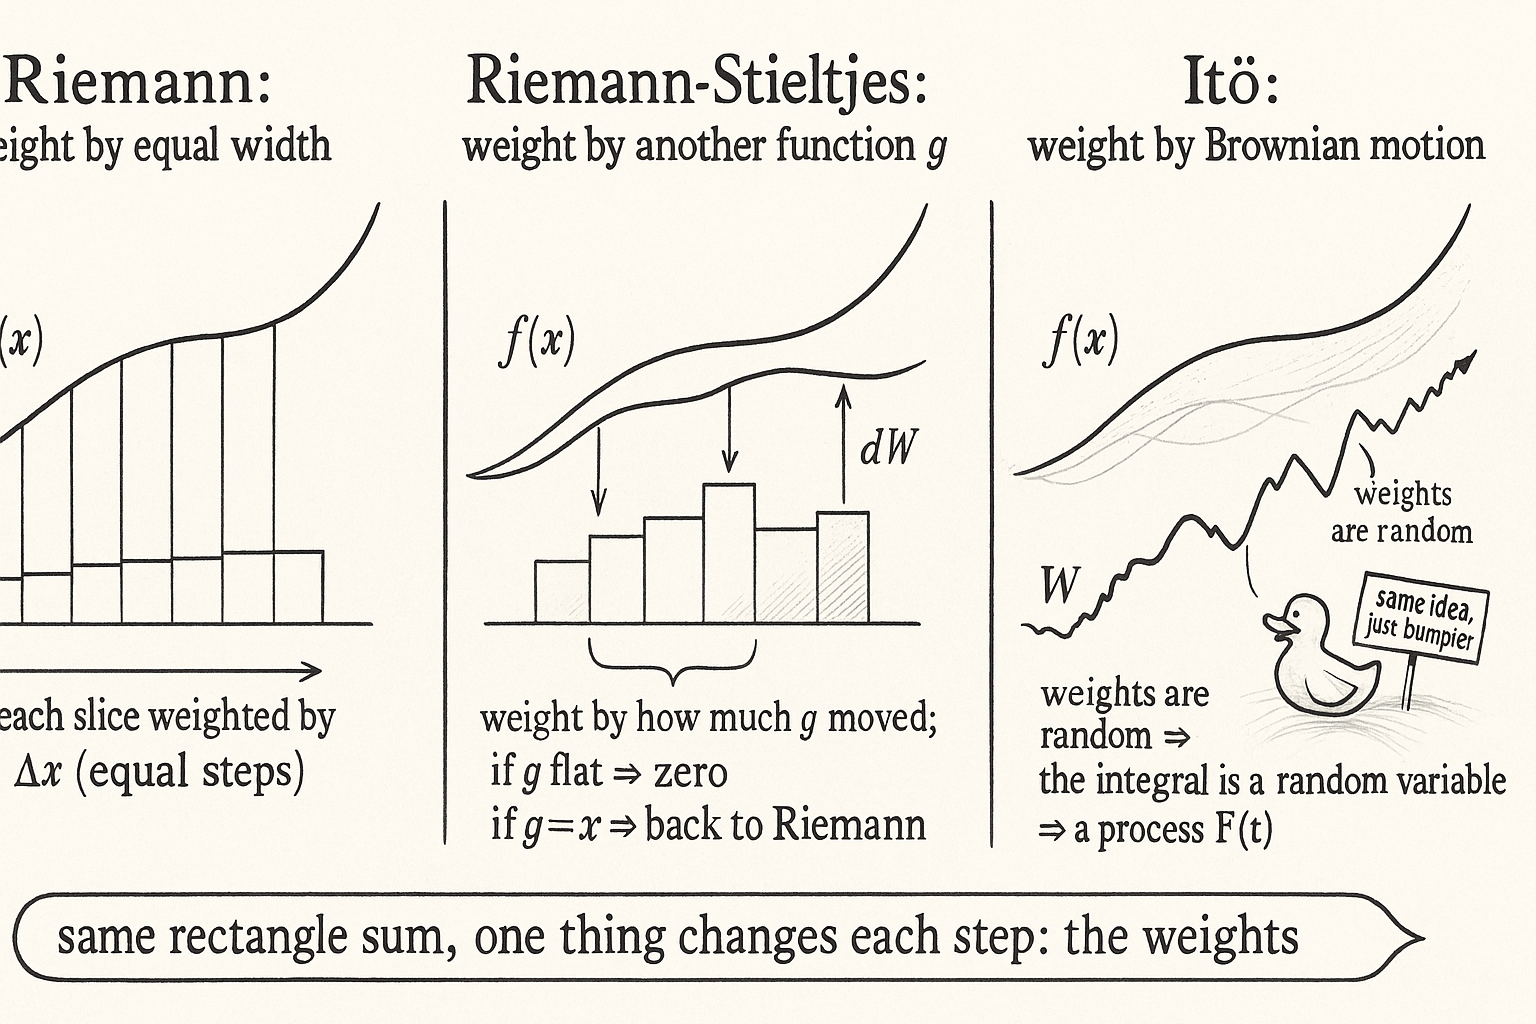
Visualizing the three steps
KEY POINTS
- The Itô integral is one small twist on the ordinary integral. Build it in three steps that each change exactly one thing.
- Riemann integral: chop the axis into thin rectangles, weight each by an equal step in x, sum, and shrink the widths to zero. Every slice counts the same horizontal distance.
- Riemann-Stieltjes integral: weight each rectangle by the change in a second function g instead of by a fixed step. If g is constant the integral is zero; if g equals x you recover the Riemann integral. For smooth g it is just the integral of f times g-prime.
- Itô integral: replace g with Brownian motion, so each rectangle is weighted by a random Brownian increment. The weights are random, so the integral is a random variable with a distribution, not a single number.
- Take the integral from zero to a running time t and you get a stochastic process Y of t, whose value at each instant is a distribution. Both the integrand and the integrator can themselves be stochastic processes.
- This is the machinery under every price model written as drift plus a dW noise term, including the geometric Brownian motion of the old article "Log-Normal Prices and the Price/Volume Trick." The random part of a price is exactly this integral run forward, which is why risk is a distribution, not a forecast.