8.3 Log-Normal Prices and the Price/Volume Trick
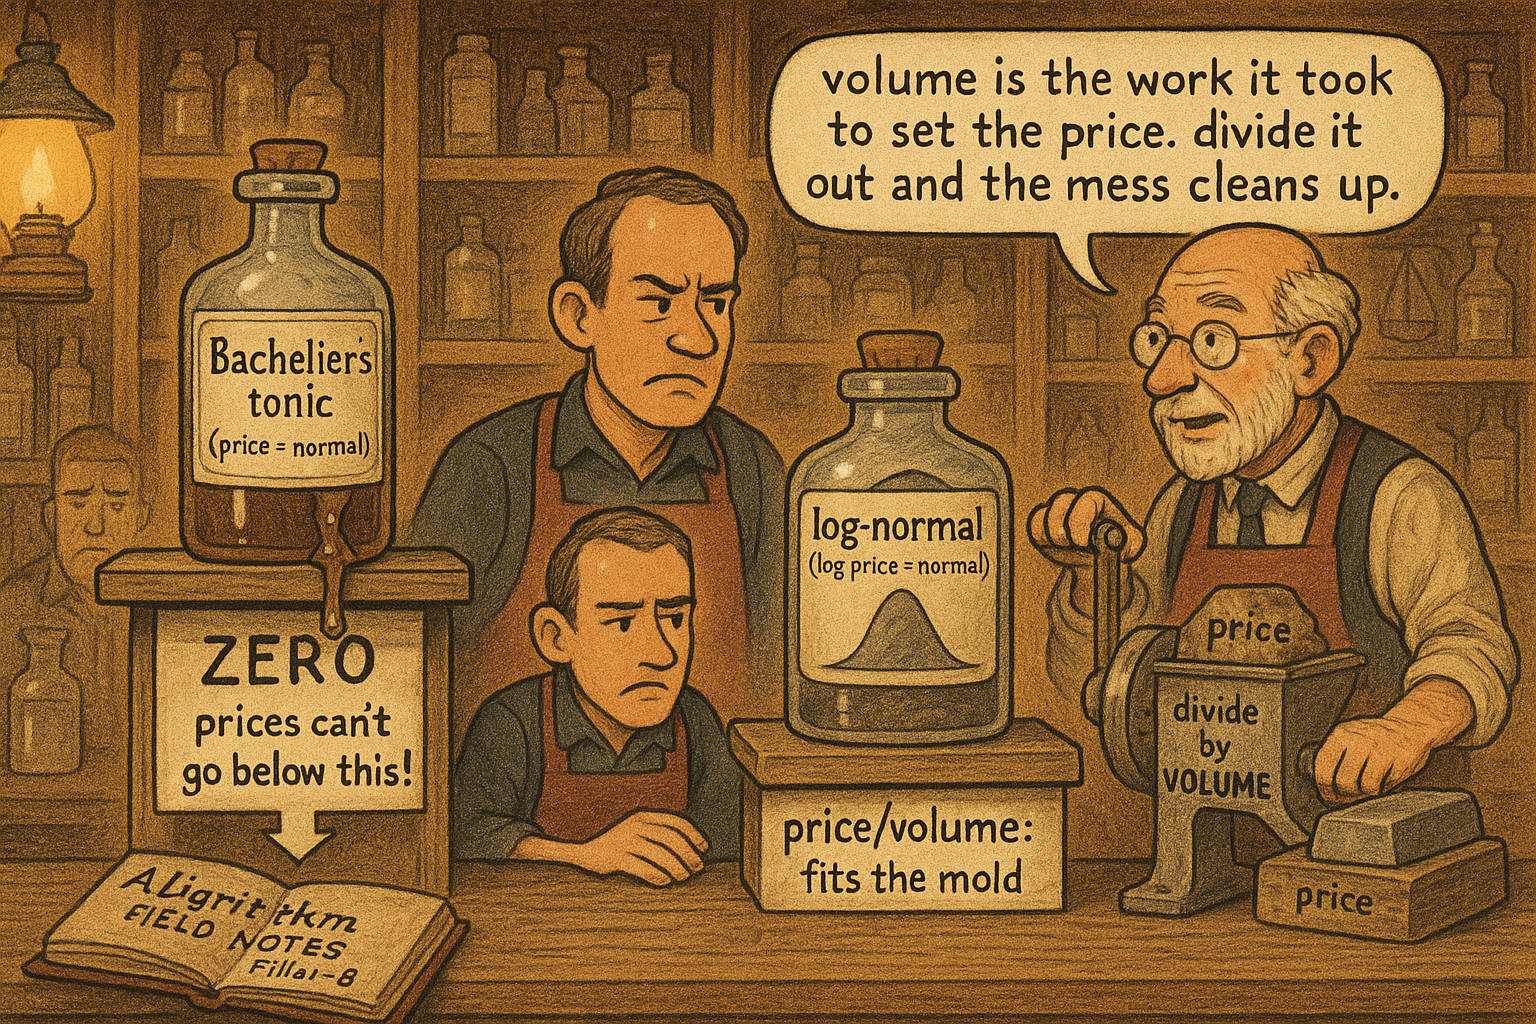
Bachelier's normal-price model lets prices go negative; putting the walk on log price fixes it. The twist: raw price fits a log-normal badly, but price divided by volume fits one cleanly.
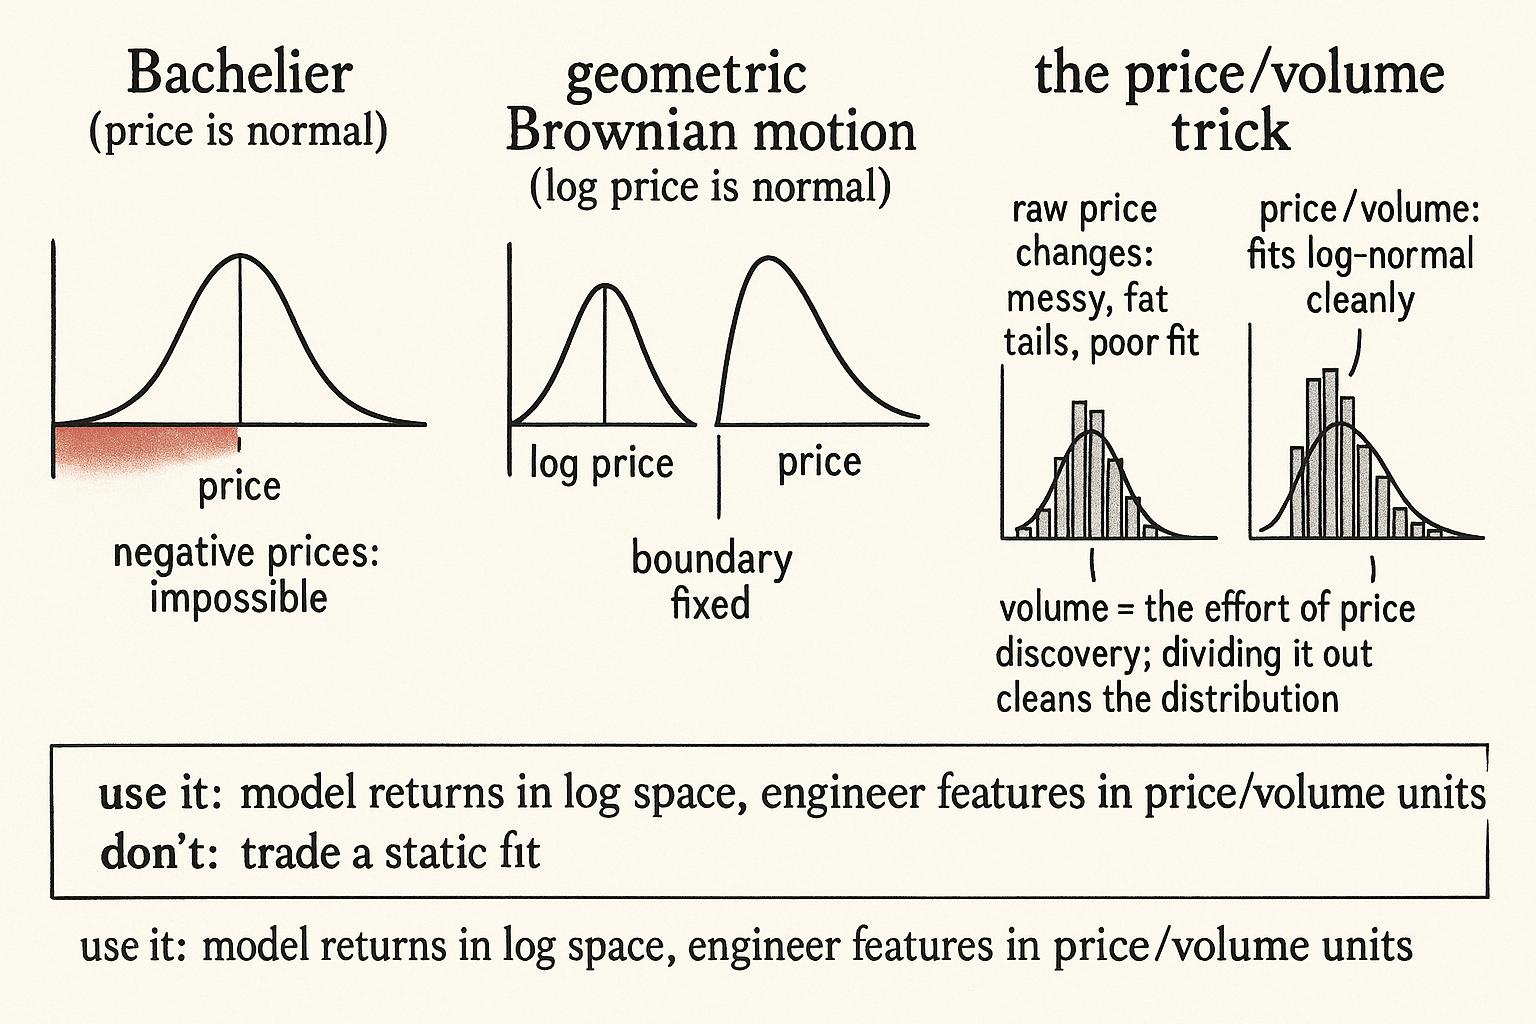
Bachelier started everyone off on the wrong distribution. In 1900 he modeled the stock price itself as Brownian motion, a random walk with normally distributed changes, which is elegant and has one fatal flaw: it lets the price go negative. A stock cannot trade below zero, so a model that assigns real probability to negative prices is broken at the boundary before you even reach the fat-tail problems the old article "Fat Tails: Why Gaussian Thinking Breaks Trading Systems" laid out. The fix that the field settled on is to put the random walk on the logarithm of price instead of the price, which makes returns normal and prices log-normal. That single change repairs the boundary, and it sets up a less obvious result: the thing that fits a clean distribution is not price at all, it is price divided by volume.
From Bachelier to geometric Brownian motion
Move the Brownian motion onto log price and the model becomes geometric Brownian motion, the workhorse behind most of continuous-time finance. The log of price does a random walk, so the price is the exponential of a normal variable, which is the definition of a log-normal distribution.
$$ \ln P_t - \ln P_0 \sim \mathcal{N}(\mu t,\ \sigma^2 t) \quad\Longrightarrow\quad P_t = P_0\, e^{\,\mu t + \sigma W_t} $$
The left side says the change in log price over an interval is normally distributed with a mean and variance that grow with time, which is the random-walk-on-returns statement. The right side is the same thing solved for the price: the starting price multiplied by the exponential of a drift term plus a random term, where W is the Brownian noise. Because price is an exponential of a normal variable it can never go negative, which fixes Bachelier's boundary problem, and the multiplicative form matches how returns compound, a 1% move on a $10 stock and on a $1000 stock being the same percentage rather than the same dollar amount. This is the price process that has to hold, up to the structure, for the random-walk half of the old article "Random Walk and Efficient Markets Are Not the Same Thing" to even be stated.
The log-normal is a genuine improvement over the raw Gaussian and still not the truth. Real log returns have the fat tails and the peaked center the old article on fat tails cataloged, so the log-normal price model gets the no-negative-price boundary right while still understating the extremes. It is the correct skeleton, not the correct flesh.
The price/volume trick
Here is the part worth stealing. Fit a log-normal to raw price changes and the fit is mediocre, the tails are wrong and the parameters drift. Antoniou's finding is that if you normalize price by volume first, dividing price by the volume traded, the resulting quantity fits a log-normal cleanly across most stocks.
$$ f(x) = \frac{A}{\sqrt{2\pi}\,\sigma\, x}\, \exp\!\left(-\frac{(\ln x - \mu)^2}{2\sigma^2}\right), \qquad x = \frac{\text{price}}{\text{volume}} $$
The function is the standard log-normal density: A is a normalizing constant, mu and sigma are the mean and dispersion of the logarithm, and the variable x is not price but price divided by volume. The reason this works points at something real about market structure. Volume is the denominator of price discovery, the amount of trading it took to hold the price where it is, so price-per-unit-volume is closer to a measure of value adjusted for the effort of trading than price alone. Dividing the two strips out a chunk of the messiness that makes raw price changes deviate from any clean distribution, and what survives is the well-behaved log-normal shape. Volume carries information that price alone hides, which is the same instinct behind every volume-weighted indicator, stated as a distributional fact rather than a charting habit.
What to use this for
Resist the urge to build a system that bets on price/volume reverting to its log-normal mean, because a clean static fit on historical data is a description, not a tradable edge, and the same fat-tail and non-stationarity warnings from the rest of this pillar apply the moment you try to trade it. The honest uses are narrower and more useful. First, model returns and risk in log space, not price space, so your volatility scaling and position sizing operate on the quantity that is closer to normal and your downside math never relies on a price that the model says could go negative. Second, treat the price/volume result as a reason to engineer features in price/volume units rather than raw price, because a quantity that fits a known distribution is far easier to standardize, to z-score, and to compare across instruments than one that does not. Third, hold the boundary lesson: any model that can produce a negative price, a negative volatility, or a probability that ignores the fat tail is telling you about its own assumptions, not about the market, and the log-normal is the minimum repair, not the finish line.
Visualizing the log-normal repair
KEY POINTS
- Bachelier modeled price itself as Brownian motion, which lets price go negative, a boundary failure that breaks the model before fat tails even enter.
- Putting the random walk on log price gives geometric Brownian motion: log returns are normal and prices are log-normal, so price is an exponential of a normal variable and can never go negative, matching how returns compound multiplicatively.
- The log-normal price model is the right skeleton, not the right flesh. Real log returns still carry the fat tails and peaked center from the old article "Fat Tails: Why Gaussian Thinking Breaks Trading Systems," so it fixes the boundary while understating the extremes.
- Antoniou's result: raw price changes fit a log-normal poorly, but price divided by volume fits one cleanly across most stocks, because volume is the effort of price discovery and dividing it out strips messiness that price alone carries.
- The honest uses are modeling returns and risk in log space so sizing never relies on an impossible negative price, and engineering features in price/volume units because a quantity with a known distribution is easy to standardize and compare across instruments.
- A clean static fit is a description, not an edge. Do not trade price/volume reverting to its mean; the fat-tail and non-stationarity warnings of this pillar still apply.
References
- Systematic Trading - Robert Carver (Amazon)
- Trading Systems - Urban Jaekle Emilio Tomasini (Amazon)
- Louis Bachelier's Theory of Speculation (1900), translated
- The Distribution of Stock Returns (overview of log-normal and GBM)
- Power Laws in Economics and Finance
- A Detailed Take on Fat Tails
- Trading Volume and Serial Correlation in Stock Returns