8.5 Markets Are Getting More Random: Non-Stationarity of Randomness Itself
The market's randomness itself drifts: competition arbitrages structure away, so recent data is more random than old and your backtest edge is an upper bound that decays, not a stable estimate.
Most traders worry about the wrong kind of non-stationarity. They watch the mean drift, the volatility cluster, the correlations break, all the things the old article "Stationarity: The Word Every Trader Ignores Until It Kills the Strategy" warned about. There is a deeper one. The degree of randomness itself drifts. Run the same random-walk test on old market data and on recent data and you get different answers: recent prices conform more to a random walk than older prices did. The market does more than shift its parameters; it changes how predictable it is, and the direction of that change is toward less predictability. The edge that existed in the data you studied may be smaller in the data you trade, because the market evolved while you were calibrating.
Randomness as a measured quantity, not a fixed property
Treat predictability as something you measure on a window rather than a permanent label. The old article "Random Walk and Efficient Markets Are Not the Same Thing" made the case that a random walk is a testable statistical claim about price changes, distinct from the economic claim of efficiency. The variance ratio is one such measurement: a value of 1 means the increments scale like a random walk, departures from 1 flag the autocorrelation that a tradable structure leaves behind.
$$ VR_q(\text{epoch}) = \frac{\operatorname{Var}(r_t^{(q)})}{q\,\operatorname{Var}(r_t^{(1)})}, \qquad VR_q \to 1 \text{ as the epoch gets more recent} $$
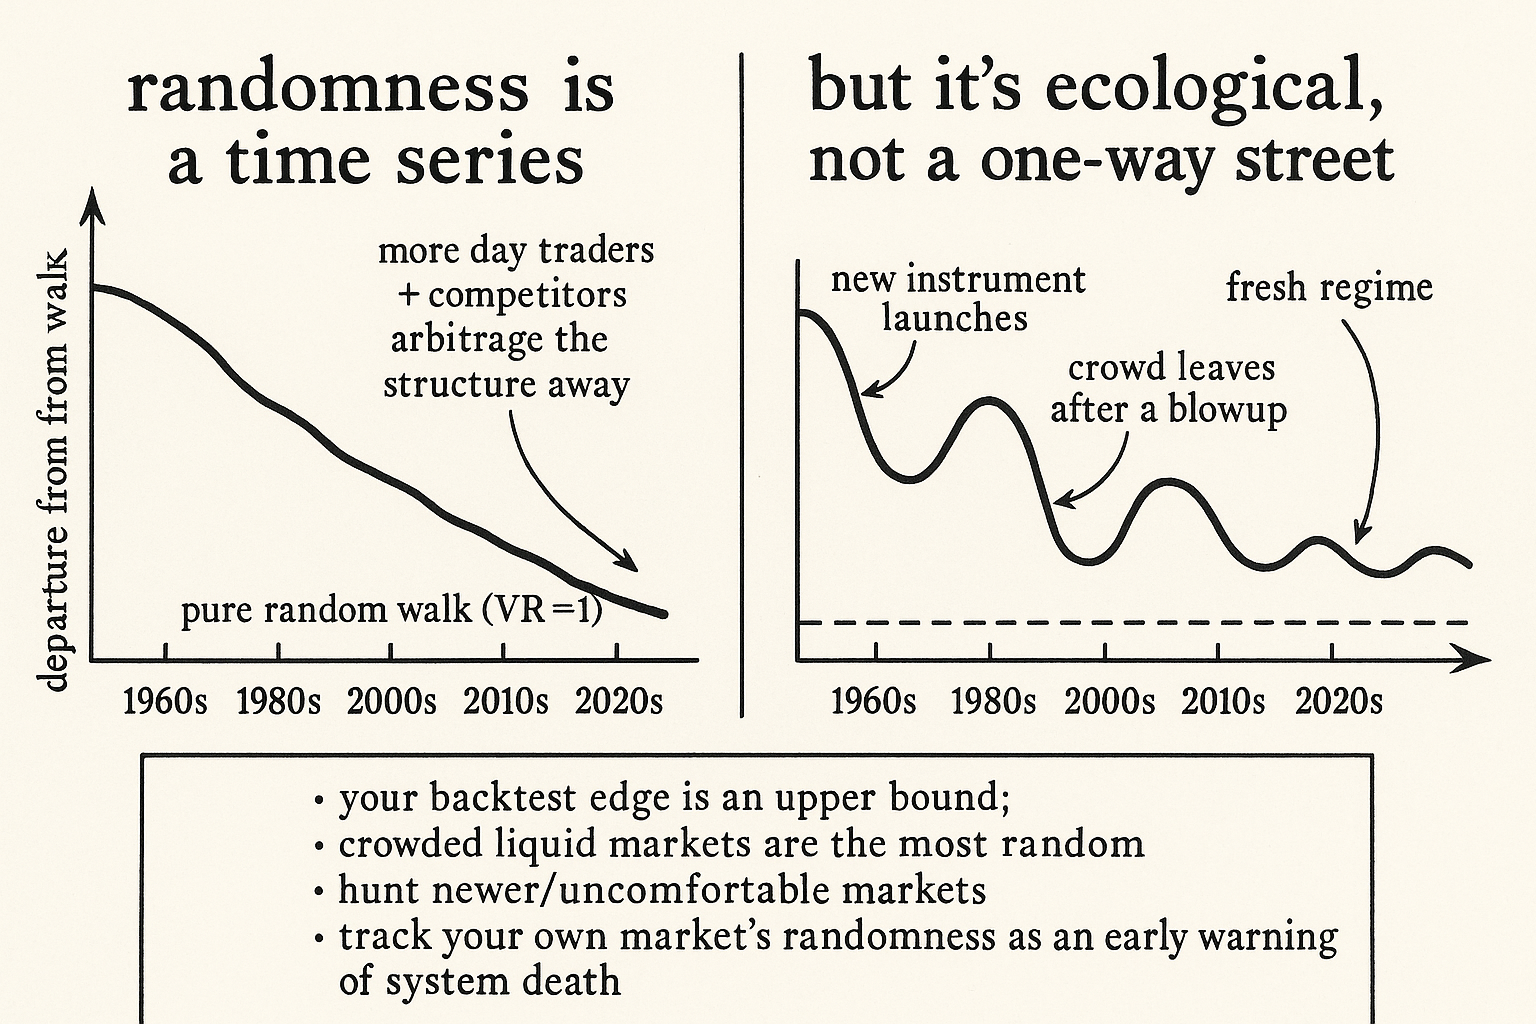
The variance ratio for horizon q is the variance of the q-period return divided by q times the one-period variance, which equals 1 under a pure random walk. Compute it per epoch instead of once over the whole history, the 1960s, the 1980s, the 2010s, and the finding is that the number drifts toward 1 as the epoch gets more recent. The same is true of first-order autocorrelation and the other departure-from-randomness statistics: they were larger in magnitude in older data and have shrunk toward the random-walk values over the decades. Randomness is not a constant of the market. It is a time series in its own right, and it has been trending up.
Why the market got more random
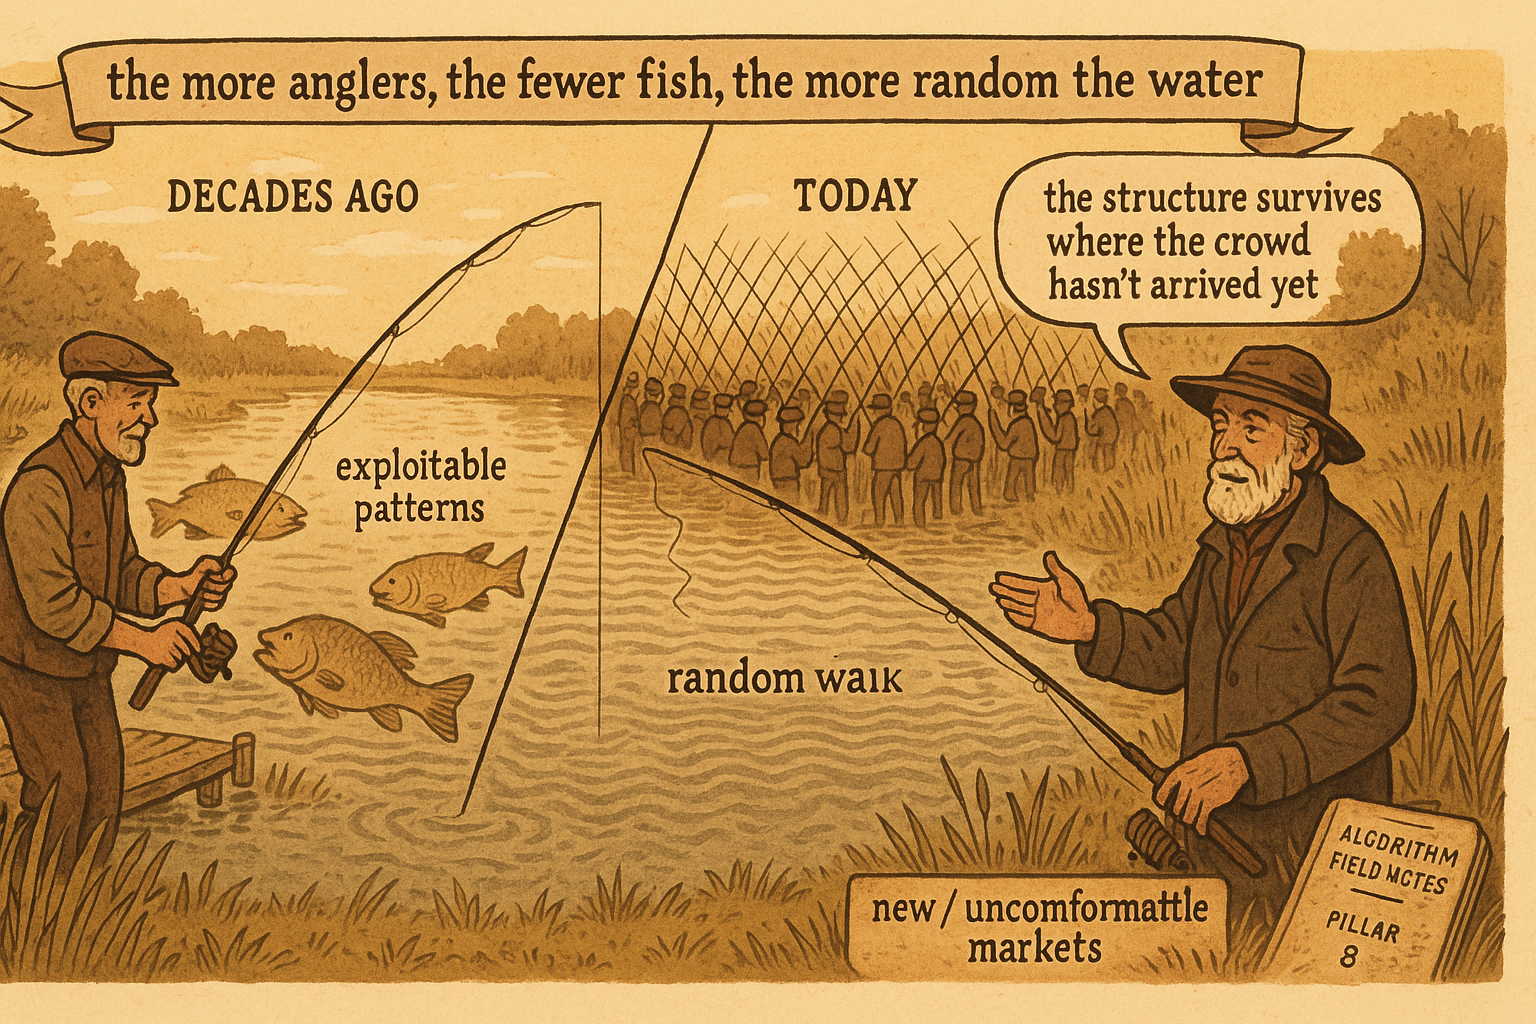
This is not mysterious once you stop treating the market as a fixed object and start treating it as a population of participants that changes. The old finding behind this is concrete: when researchers asked why recent data looked more random, they traced it to the rise of day trading and the growth in the number of active short-horizon participants who altered the return distribution. More traders hunting the same short-term patterns means each pattern gets arbitraged away faster, so the autocorrelation that one generation of traders fed on is eaten by the next generation competing to exploit it. The structure does not vanish because the market became wise in some abstract sense. It vanishes because more money chased it, which is the mechanism, not a metaphor.
That makes the market a complex evolving system, the framing the econophysics thread keeps returning to. Efficiency is an ecological variable that rises and falls with how crowded the relevant strategies are, so the careful version of this story is a cyclical, context-dependent efficiency that tightens when a strategy gets crowded and loosens again when participants leave, a new instrument launches, or a regime scares the competition out. The trend in the data has been toward more randomness in the most-traded, mature markets, and the mechanism, competition eroding exploitable structure, tells you where to look for the exceptions.
What an evolving randomness does to your edge
This is a survival argument, the core concern of this pillar, so treat it as one. First, your backtest's edge is an upper bound, not an estimate, because the structure you measured on historical data has been getting arbitraged away and the same statistic computed on next year's data tends to be weaker, so discount the historical Sharpe before you trust it and assume decay rather than persistence. Second, the more crowded and liquid the market, the faster the erosion, so the deepest, most-studied markets are where randomness has advanced furthest and where a pattern you discover today has most often been arbitraged away already. Third, hunt the exceptions the mechanism predicts: newer instruments, less-trafficked markets, and strategies that are hard or uncomfortable for the crowd to run are where exploitable structure survives longest, because fewer participants have competed it away. Fourth, monitor the randomness of your own market in real time, not once, tracking whether the variance ratio or autocorrelation your edge depends on is itself drifting toward the random-walk value, because that drift is the early warning of the system death the old article on stationarity told you to budget for. The market you backtested is not the market you are trading, and the specific way it changed is that it got harder to beat.
Visualizing randomness on the move
KEY POINTS
- The deepest non-stationarity is in randomness itself. Run the same random-walk test on old versus recent data and recent prices conform more to a random walk, so the market's predictability drifts toward less predictability.
- Predictability is a measured quantity, not a fixed label. Compute the variance ratio or first-order autocorrelation per epoch and the departures from the random-walk values shrink toward 1 over the decades, building on the old article "Random Walk and Efficient Markets Are Not the Same Thing."
- The mechanism is competition: more day traders and short-horizon participants altered the return distribution and arbitraged away the autocorrelation earlier traders fed on. Structure vanishes because more money chased it.
- That makes the market a complex evolving system. Efficiency is an ecological variable tied to how crowded the relevant strategies are, so the careful version is cyclical, context-dependent efficiency, not a steady march to perfect randomness.
- Your backtest edge is an upper bound, not an estimate. Discount the historical Sharpe, assume decay, and expect the fastest erosion in the deepest, most-studied markets where randomness has advanced furthest.
- Hunt the exceptions the mechanism predicts (newer instruments, thin markets, strategies the crowd finds uncomfortable) and monitor your own market's randomness in real time, because drift toward the random-walk value is the early warning of the system death the old article "Stationarity: The Word Every Trader Ignores Until It Kills the Strategy" said to budget for.
References
- Systematic Trading - Robert Carver (Amazon)
- Trading Systems - Urban Jaekle Emilio Tomasini (Amazon)
- The Adaptive Markets Hypothesis (Lo, 2004)
- The Adaptive Markets Hypothesis: Market Efficiency from an Evolutionary Perspective
- Stock return predictability and the adaptive markets hypothesis: century-long U.S. data
- A Non-Random Walk Down Wall Street (Lo & MacKinlay, overview)
- Power Laws in Economics and Finance