8.4 Long-Range Dependence: Real Memory or Just Short-Range Echo?
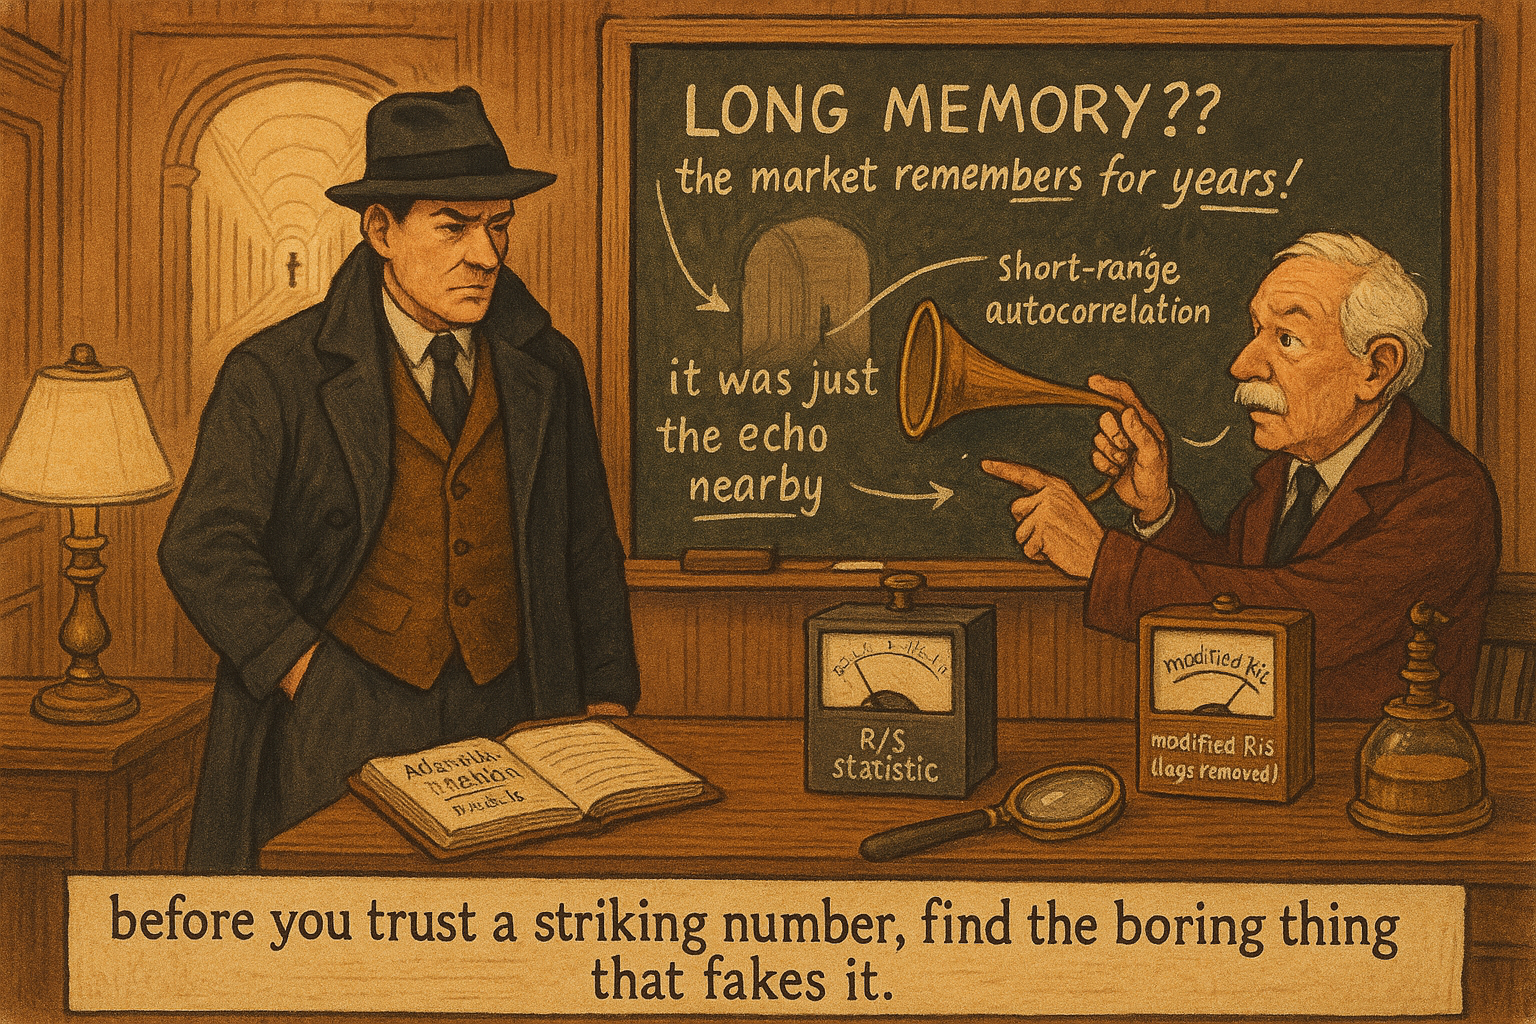
Market "long memory" is mostly short-range autocorrelation in disguise: correct for it and the Hurst signal collapses toward random. Kill a striking statistic with the boring explanation first.
Traders love the idea that markets have long memory. It would mean a move today still nudges prices months or years out, that business cycles leave a persistent fingerprint you can lean on, that the Hurst exponent you computed and got 0.6 from is real persistence you can trade. The old article "Variance Ratio Tests for Traders" already showed how to measure whether moves reinforce or reverse over a horizon. Long-range dependence is the grander claim: memory so persistent it never dies, beyond the few-day reinforcement the variance ratio already covers. The claim is mostly an artifact. When you correct for ordinary short-range autocorrelation, the long memory tends to evaporate, and most of the famous Hurst estimates were measuring something they were not designed to separate.
The R/S statistic and the Hurst exponent
The classic tool for long memory is rescaled range analysis, the R/S statistic that Hurst built studying Nile river floods. Take a window of length n, compute the running sum of deviations from the mean, measure the range of that running sum (the spread between its high and low), and divide by the standard deviation over the window. Do it across many window sizes and see how the rescaled range grows with n.
$$ \left(\frac{R}{S}\right)_n \sim c\, n^{H}, \qquad H = 0.5 \text{ (no memory)}, \quad H > 0.5 \text{ (persistent)}, \quad H < 0.5 \text{ (anti-persistent)} $$
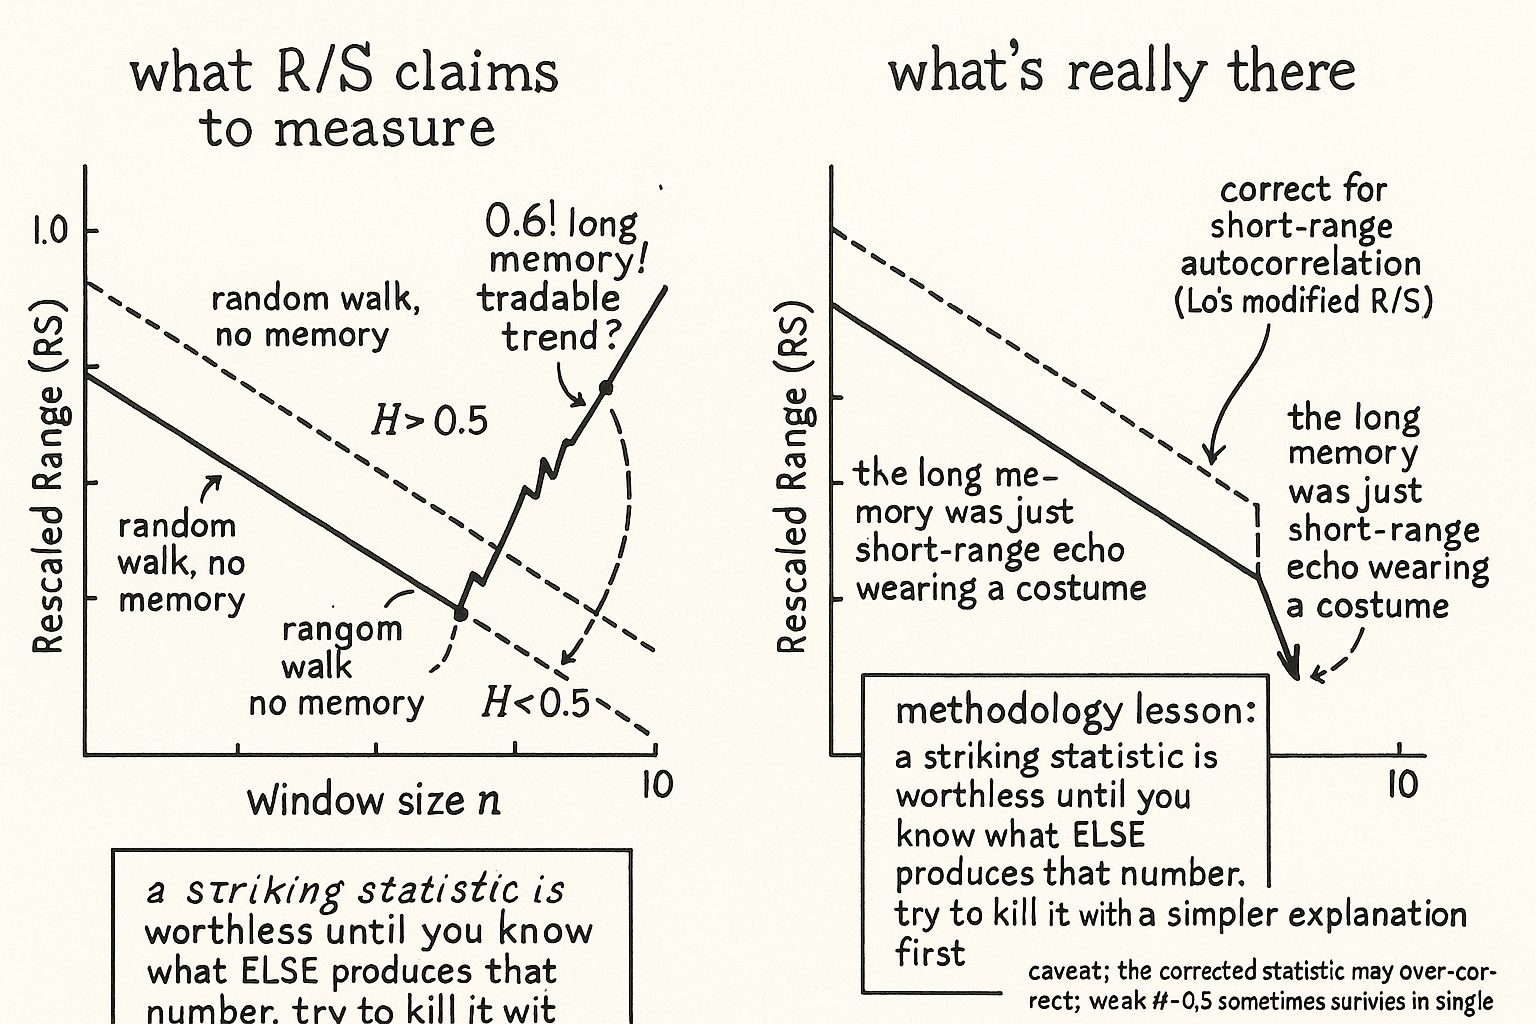
The rescaled range scales as the window size raised to the power H, where H is the Hurst exponent. Read the three cases. At H equal to 0.5 the range grows as the square root of the window, which is what a pure random walk with no memory does, the same square-root-of-time benchmark behind the variance ratio. Above 0.5 the range grows faster, which says the series is persistent, with moves tending to be followed by moves in the same direction over long stretches. Below 0.5 it grows slower, the anti-persistent case where moves tend to reverse. Find H well above 0.5 on stock returns and the temptation is to declare long memory and a tradable trend at long horizons.
The trap: short-range dependence inflates H
The problem is that the plain R/S statistic cannot tell long memory apart from ordinary short-range autocorrelation. A series with no long memory at all, holding only a little week-to-week persistence of the kind every market has, will still produce an R/S slope above 0.5 and hand you a Hurst exponent that looks like long-range dependence. The statistic conflates the two, and the famous early findings of long memory in stock returns were mostly this confusion: short-range dependence wearing a long-memory costume.
Lo's fix was a modified R/S statistic that normalizes not by the plain standard deviation but by one that includes the autocovariances out to a chosen number of lags, deliberately soaking up the short-range structure before measuring the range.
$$ S_q^2 = \hat{\sigma}^2 + 2\sum_{j=1}^{q}\left(1 - \frac{j}{q+1}\right)\hat{\gamma}_j $$
The modified denominator takes the ordinary variance and adds a weighted sum of the first q autocovariances, the gamma terms, with weights that taper as the lag grows. By folding the short-range correlations into the normalizer, the statistic discounts the echo that was inflating H. Apply it to daily, weekly, monthly, and annual stock index returns across many sample periods and the result is blunt: once short-term autocorrelation is accounted for, the evidence for long-range dependence disappears. The long memory was the short memory, measured with a tool that could not separate them.
The methodology lesson that outlives the result
This is a robustness cautionary tale before it is a fact about markets, and the lesson generalizes far past the Hurst exponent. A statistic that produces a striking number is worthless until you know what else could produce that same number. The plain R/S looked like it was measuring deep memory while part of what it measured was ordinary autocorrelation, so the headline finding was an artifact of the estimator, not a property of the data, the same failure mode as any indicator that looks predictive because it shares regime structure with its target. Note also that the debate did not close: later work argued Lo's modified statistic leans too hard the other way, biased toward accepting no long memory as the lag count grows, with some studies still finding weak long-range dependence at Hurst values near 0.6 in individual stocks. So the honest position is the uncomfortable one. Long memory in returns is weak at best and mostly an artifact of short-range dependence, the effect that survives correction is too small and too unstable to build a long-horizon system on, and any Hurst exponent you compute should be reported as an estimate that changes with the window length and the correction method, not as a constant of the market. Before you trade a number, try to kill it with a simpler explanation, and the simplest explanation here, short-range autocorrelation, kills most of it.
Visualizing memory versus echo
KEY POINTS
- Long-range dependence is the claim that market memory is so persistent it never dies, a grander version of the horizon question the old article "Variance Ratio Tests for Traders" measured.
- The classic R/S (rescaled range) statistic estimates a Hurst exponent H from how the rescaled range grows with window size: H of 0.5 is a memoryless random walk, above 0.5 is persistent, below 0.5 is anti-persistent.
- Plain R/S cannot separate long memory from ordinary short-range autocorrelation. A series with only week-to-week persistence still yields H above 0.5, so the famous early long-memory findings were short-range dependence in disguise.
- Lo's modified R/S normalizes by a standard deviation that includes the first q autocovariances, soaking up the short-range structure. Applied across daily to annual index returns, the evidence for long-range dependence disappears once short-term autocorrelation is accounted for.
- The debate is not closed: later work found Lo's statistic biased toward rejecting long memory as the lag grows, with weak Hurst values near 0.6 surviving in some individual stocks, so the surviving effect is too small and unstable to trade.
- The robustness lesson outlives the result: a striking statistic is worthless until you know what else produces the same number, and any Hurst estimate should be reported as window- and method-dependent, not a constant of the market.
References
- Systematic Trading - Robert Carver (Amazon)
- Trading Systems - Urban Jaekle Emilio Tomasini (Amazon)
- Long-Term Memory in Stock Market Prices (Lo, modified R/S statistic)
- Stock market prices and long-range dependence (Willinger, Taqqu, Teverovsky)
- A critical look at Lo's modified R/S statistic
- Long Term Dependence in Stock Returns (spectral regression evidence)