8.12 Information Theory for Traders: Entropy, Mutual Information, Channel Limits
Mutual information on an E-mini sign signal: an 80% hit rate carries 0.278 bits. Channel capacity is that ceiling, and 252 days give 0.117 bits back.
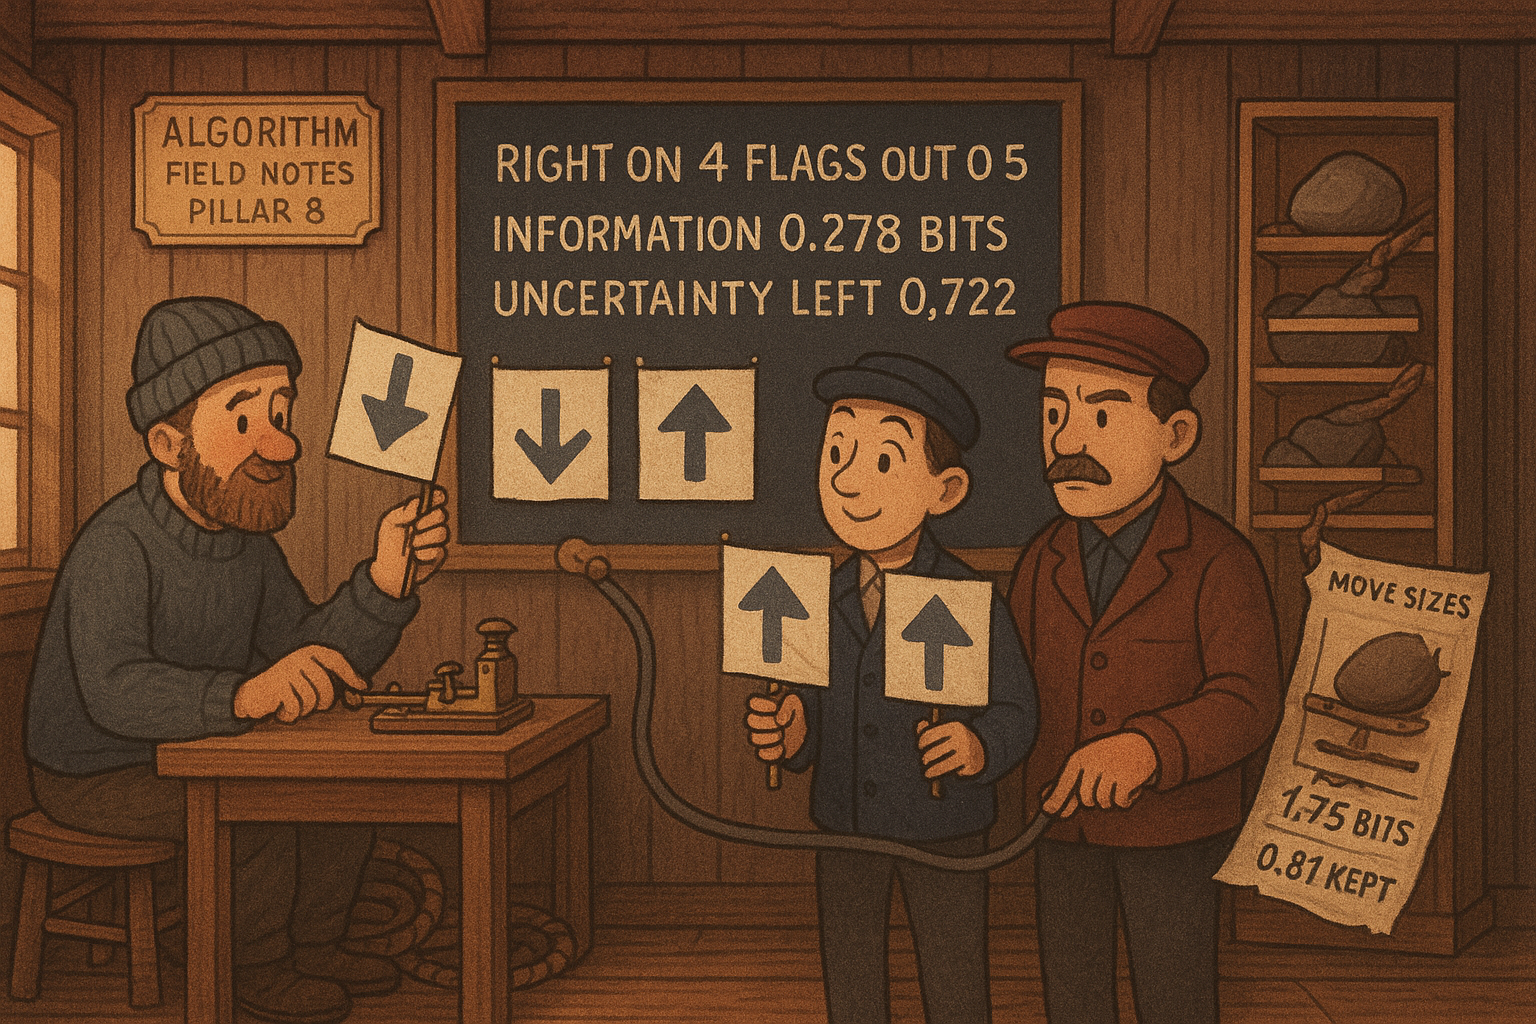
A feature that matches the sign of the next E-mini return on 4 days out of 5 leaves 0.722 bits of uncertainty about that sign. The part the feature removes is 0.278 bits of mutual information, out of the 1 bit in a fair coin. The binary channel that flips 1 transmitted bit in 5 has that 0.278 as its capacity, and no choice of how often the feature calls up versus down raises it.
What this actually is
You run a daily signal on the E-mini. Lagged order-flow imbalance, or yesterday's return, agrees with the sign of the next return on 4 days out of 5. The backtest reports an 80% hit rate. The information in that agreement is 0.278 bits per day.
Entropy is the average surprise of one series, in bits. Mutual information is how many of those bits two series share. Channel capacity is the largest mutual information a noisy map can carry, once you may choose the distribution of what you send.
A harbor telegraph delivers the right character 4 times in 5 and flips it the fifth. Repeat each instruction until a majority vote is sure, and the dock gets few new instructions per hour. Shannon's coding theorem says the error can be pushed as low as you want without driving the information rate to zero, as long as the rate stays under a bits-per-use ceiling. Above the ceiling, the decoder misses a fraction of the messages at every block length.
At the desk, rank a feature by its mutual information with the next return, and treat capacity as a cap. A moving average, a rank, or a model fitted on the feature cannot beat the mutual information the raw series shares with the return. Taking the 0.278 from a 252-day book at face value ignores the finite-blocklength gap. On this channel the leading correction, at a 1% chance the decoded block is wrong, is 0.117 bits per day.
A four-bin day contains 1.75 bits
A four-bin E-mini return with probabilities 1/2, 1/4, 1/8, and 1/8 contains 1.75 bits, and that number is a floor on a lossless record of the bins.
Pinkard and Waller put those same weights on four marble colors. Read them as a large up move, a small up move, a small down move, and a large down move. Entropy, the sum in their section 2.1, is the probability-weighted average surprise.
$$ H(X) = \sum_{x} p(x) \log_2 \frac{1}{p(x)} $$
Read it as: p(x) is the probability of bin x, a fraction with no units. The log is base 2, so each term is in bits, and the sum is bits per draw. A bin of probability 1/2 has surprise 1 bit. A bin of probability 1/8 has surprise 3 bits.
Worked on the four bins: (1/2)(1) + (1/4)(2) + (1/8)(3) + (1/8)(3) = 0.5 + 0.5 + 0.375 + 0.375 = 1.75 bits. Spread the same probability evenly over four bins and the entropy hits its maximum, the log base 2 of 4, which is 2 bits. Redundancy, their W(X), is the gap: 2 minus 1.75, so 0.25 bits.
A prefix code assigns the large-up bin the single bit 1, the small-up bin the two bits 01, and the two down bins the strings 001 and 000. No codeword is a prefix of another, so a concatenated string still splits. On 16 draws that land on the expected counts, 8 large-up, 4 small-up, 2 small-down, and 2 large-down, the length is 8(1) + 4(2) + 2(3) + 2(3) = 28 bits, and 28/16 = 1.75. The paper prints a binary string beside that 28. The string in the transcription is 31 characters. The length implied by the probabilities is 28. The drawn string and the printed length disagree, so the figure may be wrong. The sum is the part that checks.
Over 252 trading days the same histogram needs 252 times 1.75 = 441 bits for a lossless record of the bins, against 504 bits if you budgeted the 2-bit maximum every day. The 63-bit gap is redundancy of the histogram, compressibility of the record. A forecast needs the next bin to depend on the ones before it. That dependence is the entropy-rate gap, computed below. The 0.25 here is histogram redundancy.
Their asymptotic equipartition result, from the law of large numbers, puts the probability of a long sequence onto a typical set of about 2 raised to N times H(X) sequences, each with probability about 2 raised to minus that. For N = 16 and H(X) = 1.75 the set holds 2 to the 28, which is 268,435,456 sequences. All possible 16-draw strings from four bins number 4 to the 16, which is 4,294,967,296. The typical set is 1/16 of that space, and addressing it takes 28 bits. Fewer bits and two typical sequences share a codeword.
The old article "Entropy as a Market Choppiness Gauge" divides entropy by the log of the number of bins and reads a ratio near 1 as chop. On these four bins that ratio is 1.75/2 = 0.875. The ratio describes the histogram. Dependence from one bin to the next can be large while the ratio sits near 1, which is the sticky chain below.
The shared part is mutual information
The 80% feature shares 0.278 bits with the next sign. The correlation of the same table is 0.6. The two numbers do not convert into each other.
Mutual information is their equation (1), the probability-weighted average of the pointwise score log of joint over the product of the marginals.
$$ I(X; Y) = \sum_{x} \sum_{y} p(x, y) \log_2 \frac{p(x, y)}{p(x)\, p(y)} $$
Read it as: p(x, y) is the joint probability of signal x and next sign y. p(x) and p(y) are the separate probabilities. The fraction inside the log equals 1 when the two are independent, and the log is then zero. The sum is in bits per observation.
Work the 80% table. Signal and next sign are each up half the time, and the signal is wrong on 1 day in 5. The four joint probabilities are 0.4 for up-up, 0.1 for up-down, 0.1 for down-up, and 0.4 for down-down. Each diagonal cell contributes 0.4 times log base 2 of (0.4/0.25) = 0.4 times log base 2 of 1.6 = 0.4 times 0.6781 = 0.27124. Each off-diagonal cell contributes 0.1 times log base 2 of (0.1/0.25) = 0.1 times log base 2 of 0.4 = 0.1 times -1.3219 = -0.13219. Two of each: 2(0.27124) + 2(-0.13219) = 0.54248 - 0.26438 = 0.2781 bits.
Code up as +1 and down as -1 on that same table. The product averages 0.4 + 0.4 - 0.1 - 0.1 = 0.6, and both variables have variance 1, so the correlation is 0.6. One table, two summaries.
Pinkard and Waller then rewrite equation (1) three ways.
$$ I(X; Y) = H(Y) - H(Y \mid X) = H(X) - H(X \mid Y) = H(X) + H(Y) - H(X, Y) $$
Read it as: H(Y) is the uncertainty in the next sign before you see the feature, in bits. H(Y given X) is the uncertainty that remains after you see it. The difference is what the feature removed. The third form subtracts the joint entropy from the sum of the two separate entropies, which is the overlap.
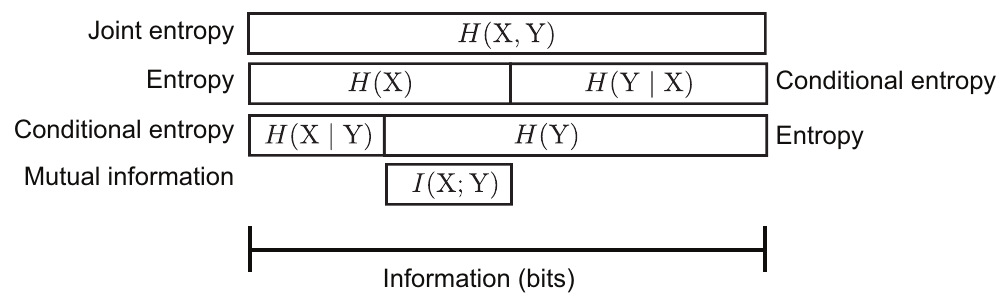
Worked on the same table. The next sign is a fair coin, so H(Y) = 1 bit. Given the feature, the sign still flips with probability 1/5, so the remaining entropy is the binary entropy of 1/5. That is -(1/5) log base 2 of (1/5) minus (4/5) log base 2 of (4/5) = (1/5)(2.3219) + (4/5)(0.3219) = 0.4644 + 0.2575 = 0.7219 bits, which rounds to 0.722. Then 1 minus 0.722 = 0.278 bits. Same number as the double sum. The bar diagram is that subtraction drawn as lengths.
Let X be one of -2, -1, +1, +2, each with probability 1/4, and let Y equal X squared. Then Y is 4 or 1, each with probability 1/2. X is symmetric about zero, so the correlation is 0. H(X) is 2 bits. Given Y, two values of X remain and they are equally likely, so the conditional entropy is 1 bit and the mutual information is 1 bit. You learned the magnitude. You learned nothing about the sign. The old article "Mutual Information as a Regime / Noise Filter" uses a gap of this kind as a go or no-go on a system. The mutual information is the ceiling on that test. A correlation of zero can sit next to a ceiling of 1 bit.
The ceiling drops further once the series has memory, and the marginal entropy does not show it. Pinkard and Waller's sticky chain repeats the last outcome with probability 5/8 and jumps to each of the other three with probability 1/8. The chain is symmetric, so the marginal stays uniform and each draw still has entropy 2 bits if you have not seen the previous draw. The conditional entropy is
$$ H(X_{n+1} \mid X_n) = -\frac{5}{8}\log_2\frac{5}{8} - 3\cdot\frac{1}{8}\log_2\frac{1}{8} $$
Read it as: 5/8 is the probability of repeating the last bin, and each 1/8 is a jump to one of the other three. The log is base 2. The result is bits of uncertainty about the next bin once you know the last one.
The three jumps contribute 3 times (1/8) times 3 = 1.125 bits, since log base 2 of 8 is 3. The repeat contributes (5/8) times log base 2 of (8/5) = 0.625 times 0.6781 = 0.4238 bits. Add them: 1.125 + 0.4238 = 1.5488, which rounds to 1.549 bits. Mutual information from one bin to the next is 2 minus 1.549 = 0.451 bits. Their equations (3) and (4) are two writings of the entropy rate: joint entropy divided by length, and the conditional entropy of the next draw given the whole past. On a stationary process the two meet as the length grows. Their equation (5) is the Markov cut. Only the last draw matters, so the conditioning set collapses to one variable. A one-lag model of this chain cannot pull out more than 0.451 bits per step. Point the choppiness ratio at the marginal and it reads 2/2 = 1, a fully chopped tape, while the lag still carries 0.451 bits.
The directed version across two series, how many bits one series' past removes from the uncertainty of another's future, is what a conditional-mutual-information test estimates. The old article "Stop Using Pairwise Granger: PCMCI for Financial Causality" plugs that test in as CMI, beside a linear partial correlation and a Gaussian-process residual test. Pairwise mutual information still counts bits that a third series explains. The conditional number is the subtraction H(X given Z) minus H(X given Y and Z). A pairwise screen has not run that subtraction.
Capacity is the best input on a fixed channel
The flip channel's capacity is 0.278 bits per use. A 252-day block does not get to spend all of it.
Capacity, their equations (7) and (8), is the mutual information at the best input distribution. The channel stays fixed. You choose how the inputs are distributed.
$$ C = \max_{p_X} I(X; Y) $$
Read it as: p_X is a probability distribution over the channel inputs, a list of fractions that sum to 1. I(X; Y) is mutual information in bits per use. C is that mutual information at the maximizing list.
For the binary symmetric channel the maximizing input is a fair coin, and capacity equals 1 minus the binary entropy of the flip probability.
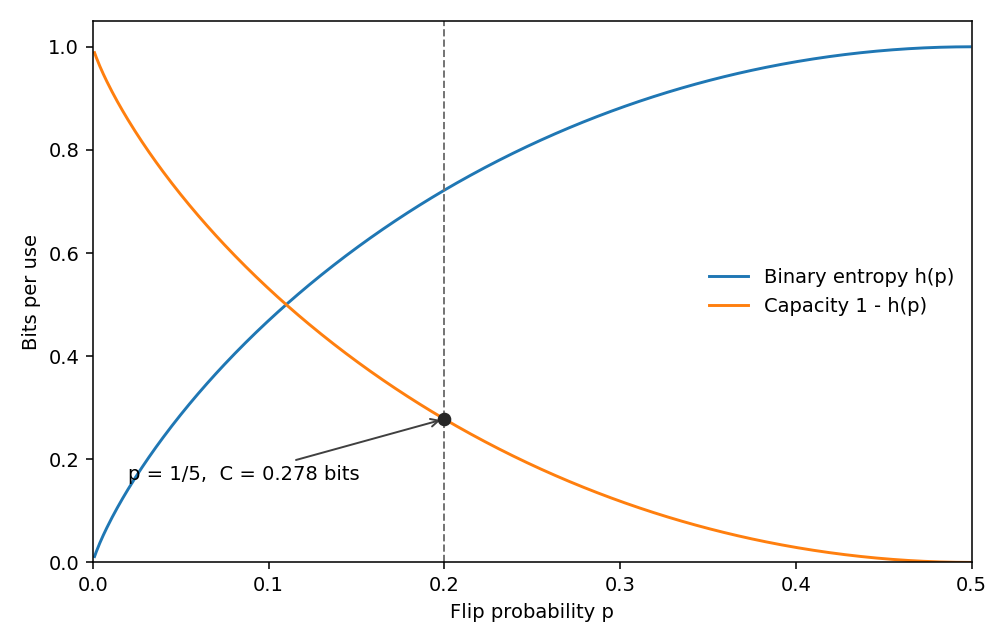
$$ h(p) = -p \log_2 p - (1-p)\log_2(1-p), \qquad C = 1 - h(p) $$
Read it as: p is the probability that a transmitted bit arrives flipped, a fraction. h(p) and C are in bits per use. At p = 0 the channel is clean and C = 1. At p = 1/2 the output is independent of the input and C = 0.
Worked at p = 1/5: h(1/5) = 0.722 bits, so C = 0.278 bits per use. That is the mutual information of the 80% table, because that table is this channel fed with a fair input. You were already on the ceiling. Changing the long-run share of up calls versus down calls does not raise it.
Pinkard and Waller set this flip probability at 1/5 in the body of the coding section. The caption of their coding figure says the channel flips each bit with probability 1/2. At 1/2 the capacity is zero, so the caption and the body disagree. The arithmetic here follows the body. If the caption is what they solved, the capacity result collapses.
Their three-input channel shows what happens when you optimize one term of I(X; Y) = H(Y) minus H(Y given X) and drop the other. Maximizing output entropy alone, spreading probability onto inputs whose outputs do not pile up, transmits 1 bit on that channel. Minimizing output noise alone piles every input onto the quietest symbol and transmits 0 bits, because a channel that always sends the same symbol sends nothing. Maximizing the difference transmits 1.13 bits. Those three numbers are the ones they print. They draw the channel matrix rather than tabulate it, so this article does not recompute 1.13. Treat 1.13 as their reported optimum, not as a check you can redo from the text.
Repetition coding, sending the same bit many times and taking a majority vote, can push the error down, and the rate (source bits divided by transmitted bits) goes to zero as you demand a smaller error. The noisy-channel coding theorem says block codes do better. Encoder and decoder pairs exist that keep the probability of a wrong block as small as you want, at any rate below capacity, once the block is long enough. No pair does that above capacity. Shannon's argument shows that a random encoder achieves the bound on average. It does not hand you the encoder. Pinkard and Waller note that codes with fast decoders arrived decades after the existence proof.
The rate you can lock in at a finite block length sits under capacity. They report, citing Polyanskiy, Poor, and Verdú, that at a fixed block-error probability the gap shrinks in proportion to 1 over the square root of the block length. They do not print the constant. On this channel the pointwise information is 1 + log base 2 of (4/5) = 0.678 bits when the bit arrives intact, and 1 + log base 2 of (1/5) = -1.322 bits when it flips. The mean of that two-point score, weighted by 4/5 and 1/5, is the capacity, 0.278. The variance is 0.8 times (0.678) squared plus 0.2 times (1.322) squared, minus (0.278) squared, which equals 0.640 bits squared. The normal approximation in the finite-blocklength paper sets the leading gap at the square root of (variance over N), times the standard-normal quantile of 1 minus the block-error target. At a 1% block-error target that quantile is 2.326. At N = 252,
$$ \sqrt{\frac{0.64}{252}} \times 2.326 = 0.117 $$
Read it as: 0.64 is the variance of the pointwise information, in bits squared. 252 is a count of trading days, the block length. 2.326 is a pure number, the normal quantile. The product is in bits per day.
So 0.278 minus 0.117 leaves 0.161 bits per day as the leading finite-blocklength rate at a 1% chance the whole block is decoded wrong. The next term in the approximation, of order log(N) over N, adds about 0.016 bits, half of log base 2 of 252, divided by 252. Constants that stay flat as N grows sit in neither term. The 0.117 is checkable from the variance above. Pinkard and Waller do not print it. That 1% is the probability the decoded block is wrong. A daily hit rate answers a different question, and reading the 1% as "right on 99% of days" misreads the theorem.
The gap shrinks slowly. The leading gap falls to a tenth of capacity, 0.0278 bits, when N = 0.64 times (2.326 / 0.0278) squared, which is 4,480 trading days, about 18 years. A mutual-information number from one year of daily bars sits outside the limit the coding theorem describes.
The same paper flags the cliff effect, again from Polyanskiy, Poor, and Verdú. Design the code for one noise level, then run it on a noisier channel, and the error jumps. The theorem tells you the capacity at the new noise. It does not tell you how to build a code that degrades gently when the noise you assumed was wrong. A feature whose 80% hit rate you measured in one regime and traded in another has this failure, and capacity at the new noise will not patch the code you already froze.
A transform spends bits, and units can fake entropy
A function of a series cannot carry more information about a target than the series already shares with that target.
Their data-processing inequality, in section 3.3, covers a chain A to B to C. What C tells you about A is at most what B tells you about A.
$$ I(A; B) \ge I(A; C) $$
Read it as: A, B, and C are random variables. The inequality is in bits. The hypothesis is that C depends on A only through B.
Work it on the four bins. Entropy is 1.75 bits. The sign is a function of the bin. Given a down sign, the two down bins each had probability 1/8, so they split the conditional probability in half and the conditional entropy is 1 bit. Given an up sign, the small-up probability 1/4 and the large-up probability 1/2 become 1/3 and 2/3. That conditional entropy is -(1/3) log base 2 of (1/3) minus (2/3) log base 2 of (2/3) = 0.9183 bits. The sign is down with probability 1/4, so the average entropy left is (1/4)(1) + (3/4)(0.9183) = 0.9387 bits. Mutual information between the four-bin return and its own sign is 1.75 minus 0.9387 = 0.8113 bits. Any further function of the sign keeps at most those 0.8113 bits about the four-bin return. The sign already dropped 0.9387 bits.
The same inequality binds the feature. A moving average of order-flow imbalance is a function of the imbalance, so the average cannot carry more information about the next return than the imbalance did. Mix extra noise into the average and it carries less. The word length in the old choppiness gauge is a map of this kind. A coarser alphabet is a channel. It keeps some bits and spends others. It does not raise the mutual information with a target the raw tape did not already share.
Differential entropy is the integral that replaces the sum when the variable is continuous, and Pinkard and Waller spend section 2.9 on why you should refuse to read it as a bit count. It can come out negative. It changes when you change units, because a density has units of 1 over x, and logging it folds that unit into the number.
$$ h(X) = \frac{1}{2} \log_2 \left(2 \pi e \sigma^2\right) $$
Read it as: this is the differential entropy of a Gaussian, in bits, with sigma the standard deviation of the return in whatever unit you stored. Pi and e are the usual constants. The log is base 2.
A Gaussian daily return with standard deviation 0.01, decimal form, has differential entropy -4.597 bits. Write the same returns in percent and the standard deviation is 1, and the differential entropy is +2.047 bits. The shift equals log base 2 of 100, which is 6.644 bits, and -4.597 + 6.644 = 2.047. Nothing in the market changed. Mutual information does not move under that rescaling: the log runs on a ratio of densities, and the units cancel. Ross showed mutual information between a discrete series and a continuous series is well defined, which is the case of a binned signal against a raw return. Use that, or bin both sides and accept that the bin width is part of the answer. Ranking features by the differential entropy of a residual, in a unit you picked for the file format, ranks the unit.
Rate distortion is the lossy form of the same floor. To hold average distortion under a cap you chose, you need at least R(D) bits about the source. If you already sit on the best distortion your current mutual information can buy, a lower distortion requires more bits. For a discrete source and a distortion that is zero only when the reconstruction matches, that curve meets zero distortion at the entropy. The sign map above is a lossy code at 0.8113 bits, under the 1.75-bit lossless floor, and the 0.9387 bits it dropped are the distortion you accepted when you kept the sign and threw out the size of the move.
KEY POINTS
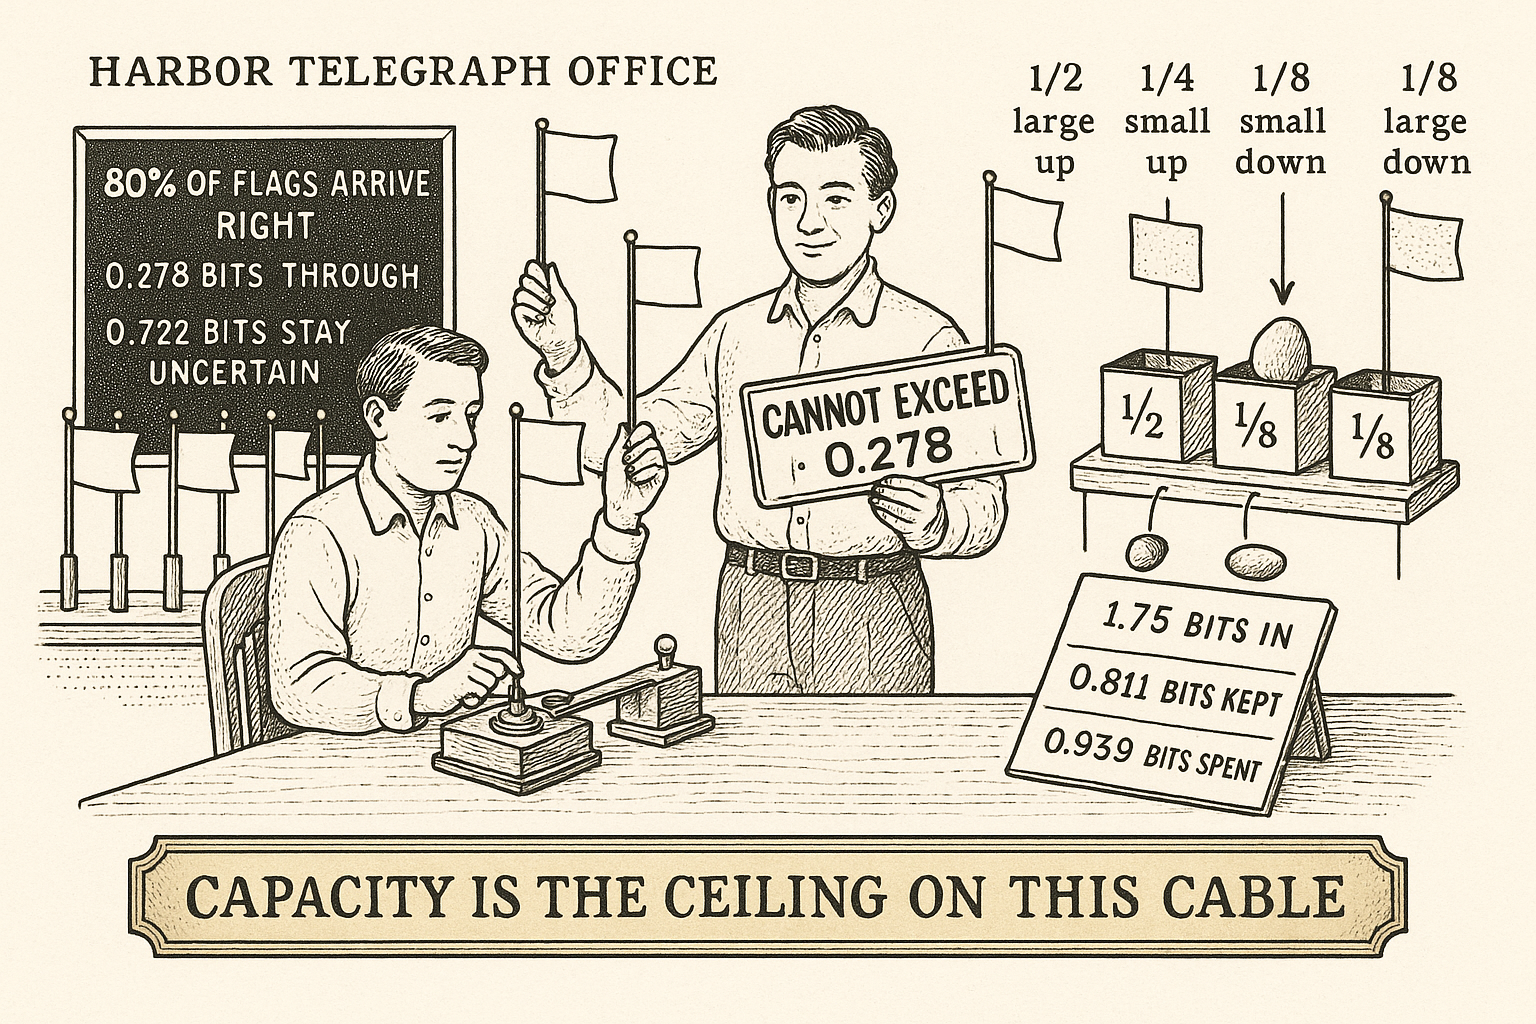
- An 80% hit rate on a balanced up/down signal is 0.278 bits of mutual information. The binary entropy of a 1-in-5 flip is 0.722 bits, and that is the uncertainty left after you see the feature.
- Entropy of the bins 1/2, 1/4, 1/8, 1/8 is 1.75 bits. The maximum on four bins is 2. Redundancy is 0.25 bits. Over 252 days that is a 441-bit lossless record against a 504-bit budget. The 63-bit gap is compressibility of the histogram. Forecasts live in the entropy rate, the conditional entropy of the next bin.
- The sticky chain that repeats with probability 5/8 has marginal entropy 2 bits and conditional entropy 1.549 bits, so one lag carries 0.451 bits. A choppiness ratio on the marginal reads 1 and misses it. Conditional mutual information is the subtraction the old article "Stop Using Pairwise Granger: PCMCI for Financial Causality" plugs in as the CMI test.
- Channel capacity is the maximum of mutual information over input distributions. On this flip channel the fair input already achieves it, at 0.278 bits per use. The paper's coding-figure caption says flip probability 1/2, which would make capacity zero. The body says 1/5. The body is the calculation that checks.
- At block length 252 and a 1% chance the whole block is wrong, the leading finite-blocklength gap on this channel is 0.117 bits per day, from a pointwise-information variance of 0.64. The square root shrinks slowly: cutting that gap to a tenth of capacity takes about 4,480 trading days. The theorem does not supply a code, and it does not protect you when the noise level moves.
- Data processing forbids a moving average, a rank, or a sign from carrying more information about a target than the raw series did. The sign of the four-bin return keeps 0.8113 bits and drops 0.9387. Differential entropy of a 1% Gaussian return is -4.597 bits in decimal and +2.047 bits in percent. Rank features by mutual information, which does not move when you change units.