4.73 HFT Supplies Liquidity Until It Doesn't: FX Flash-Crash Cascades
FX liquidity is mostly cancellable: Ultra-HFT posts 61.6% of orders, fills 6.8%. It supplies depth until a cascade hits, then vanishes. The March 2011 yen crash, and a queue fix that might help.
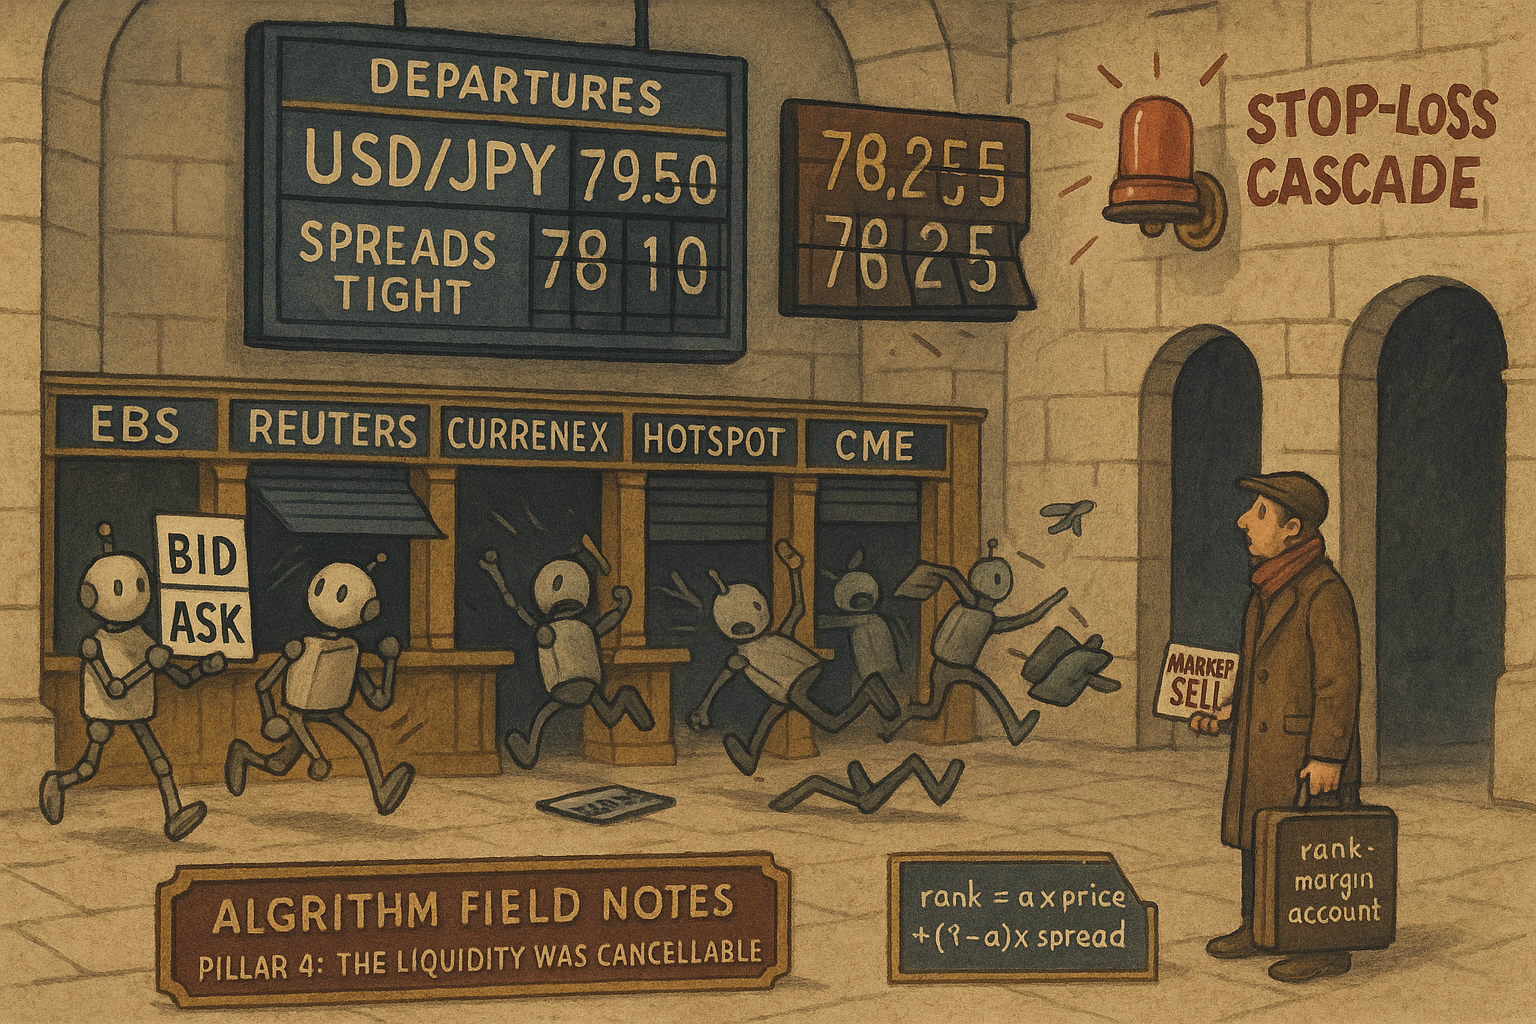
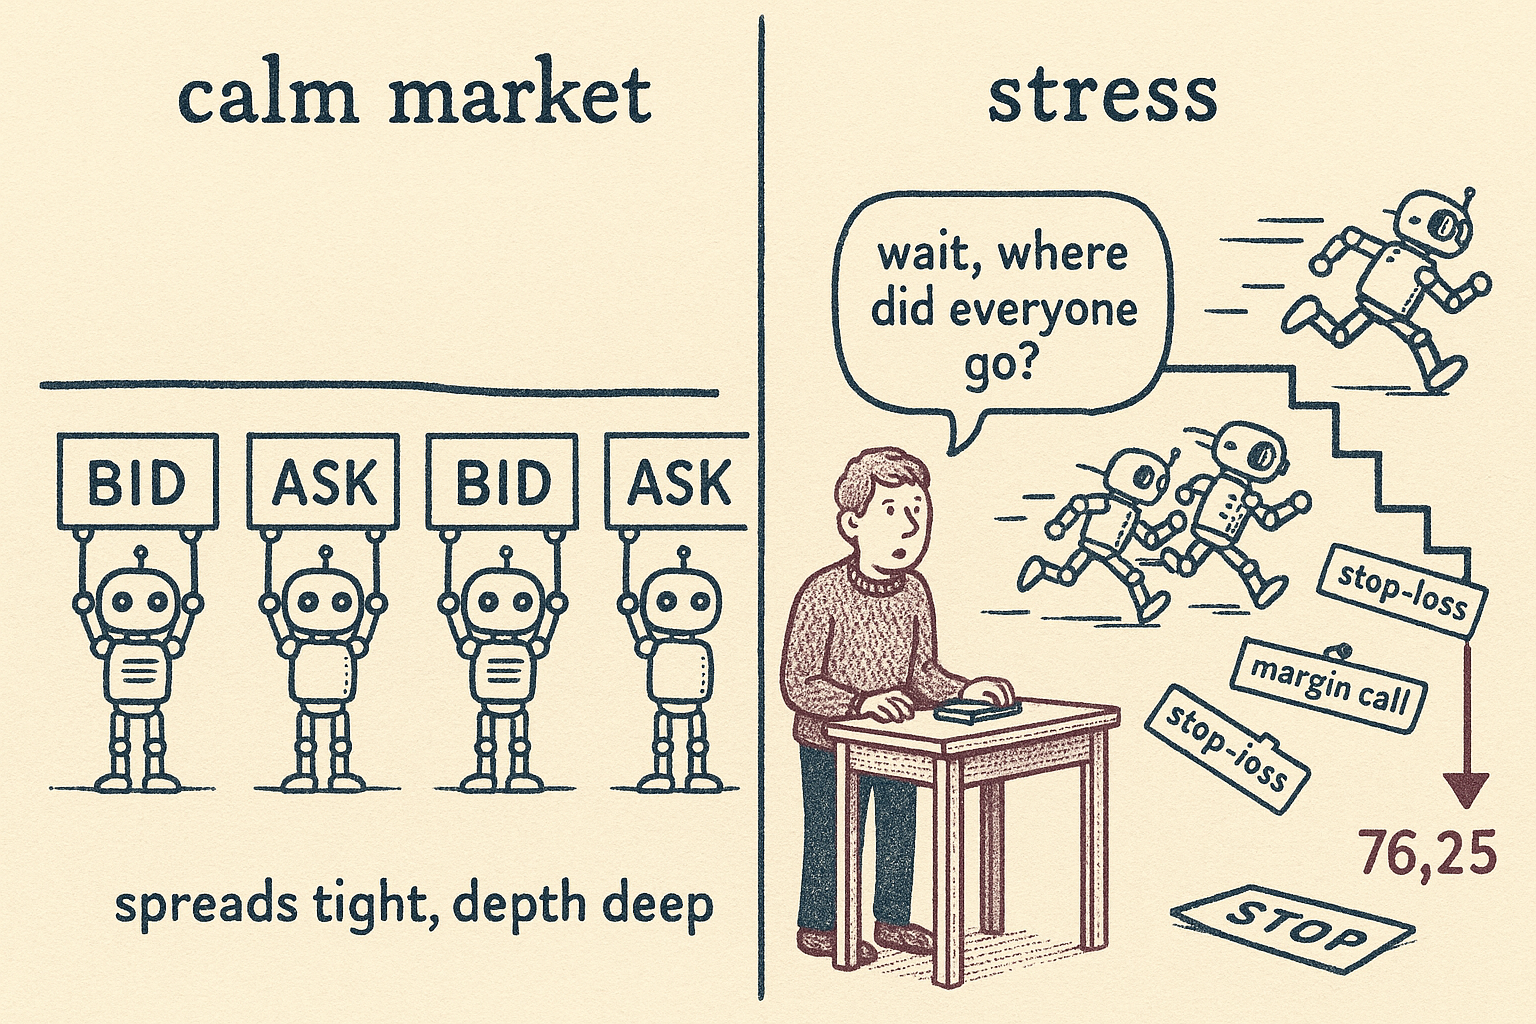
At 05:55 Tokyo time on March 17, 2011, six days after the Fukushima earthquake, USD/JPY sat around 79.50 on a thin overnight tape. Twenty-five minutes later it was below 76.50. Three hundred pips, gone, with no fresh fundamental news in that window. Retail stop-losses tripped, margin desks fired liquidations into a market where banks had already yanked their quotes or widened them so far their bids sat well under the last print. Then it snapped back to 78.23 within half an hour, then dropped again to 77.10 around 07:00 as a second wave of forced stop-outs, roughly two billion dollars of USD/JPY selling, hit six market makers who had obligations to quote. Nobody decided the yen was worth that. The microstructure decided.
The comfortable academic consensus says high-frequency traders are good for you: they narrow spreads, speed price discovery, and dampen short-term volatility. Golub, Dupuis, and Olsen at Olsen Ltd show that consensus is true on average and false exactly when it matters. Their claim is blunt: FX price trajectories are path-dependent, a black swan can be manufactured by market structure alone with no link to fundamentals, and the liquidity HFT provides is real right up to the moment the machines all decide to leave at once. The old article "Why Retail FX Execution Is Not the Same as Interbank FX" explained why your fill is not the interbank fill. This article is about what happens to that whole plumbing system under stress.
The FX market is a mesh, not a ladder
First fix the map, because most retail traders picture FX as a clean hierarchy with banks on top and them at the bottom. It is not hierarchical. It is a mesh of venues with different rules, and orders route sideways as often as up.
At the center sit two inter-dealer platforms: EBS and Reuters, both limit order books. EBS is the venue for USD, EUR, GBP, CHF, and JPY crosses; Reuters owns the Commonwealth and Scandinavian currencies. Both carry a minimum ticket size of one million units, which is what makes them institutional-only. That minimum created a business opportunity, and ECNs like Currenex and Hotspot filled it with anonymous market making, a 0.1-pip tick, and much smaller or zero minimum tickets (Hotspot sets 50,000 units). Oanda, an FCM, quotes the same firm price for a ticket as small as one dollar or as large as ten million and hedges its net exposure with institutional makers. The CME runs the largest currency-futures market at roughly 100 billion dollars notional a day, 49 contracts, a 125,000-dollar ticket, and, unlike spot, a single centralized price and a clearinghouse guarantee. Retail aggregators together are about 10% of spot volume. The whole thing turns over about 1.4 trillion dollars of spot a day.
Two mechanical details matter for what follows. EBS publishes time-sliced order-book snapshots every 250 milliseconds, or every 100 on its premium feed, and imposes a minimum quote lifetime of 250 milliseconds so an order cannot be cancelled the instant it is posted. The ECNs are faster and looser, and some let liquidity providers use "last look," a few-hundred-millisecond option to reject your fill if the price moved against them. Last look is the same asymmetry the old article "Why Retail FX Execution Is Not the Same as Interbank FX" flagged: the maker keeps the good fills and passes the bad ones back to you. Even the paper notes Hotspot's last-look feed runs wider than Currenex's non-last-look feed, so the "protection" makers get is paid for by everyone else in spread.
Who is actually in the book
Now count the participants, because the order book you see is mostly a mirage. Schmidt's EBS study splits traders into four tiers by trades per day: manual traders (MT) on a GUI, "Slow AI" under 500 trades a day, HFT between 500 and 3,000, and Ultra-HFT above 3,000. Manual traders are 75% of EBS customers, and more than 90% of them submit under 100 orders a day. But on EUR/USD, the busiest pair, the share of orders submitted flips hard: MT 3.7%, Slow AI 5.7%, HFT 29%, and Ultra-HFT 61.6%. The machines dominate the order flow you observe.
Here is the trap. Posting an order is not filling one. Fill ratios run the opposite direction: about 50% for manual traders, 26.6% for Slow AI, 8.1% for HFT, and 6.8% for Ultra-HFT. The tier that floods the book with 61.6% of orders cancels roughly 93% of them.
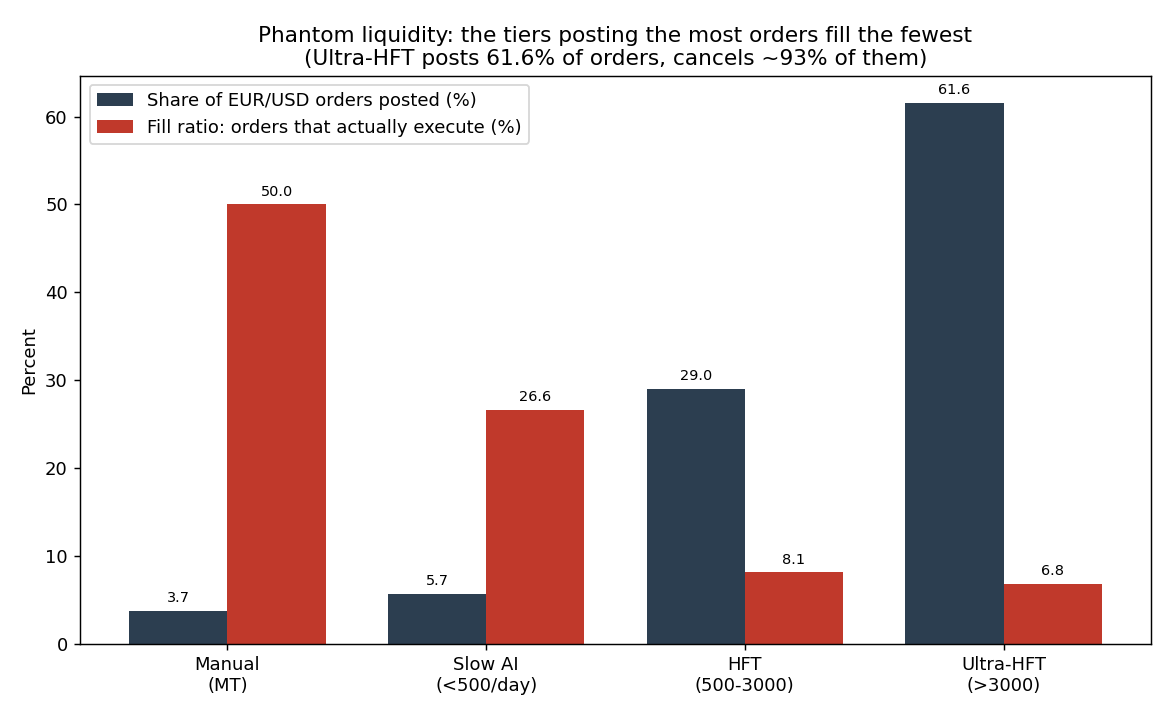
Multiply the two and you get the share of actually-filled trades per tier, Schmidt's Table 4.1: MT 1.9%, Slow AI 1.5%, HFT 2.3%, Ultra-HFT 4.2%. So the depth on your screen is dominated by quotes that will vanish before you can hit them. In calm markets this phantom liquidity is harmless, even helpful, because someone usually refreshes. In stress it is the whole problem: the 61.6% of the book that is cancellable evaporates in milliseconds, and the depth you were counting on was never contractually there. Masry's Oanda study, 110 million transactions across 46,000 accounts and 48 pairs from 2007 to 2009, finds the same shape on the retail side: assuming manual traders trade at most 50 times a day, their 27.7% share lines up with the 26.6% institutional figure.
Path dependence: a crash with no cause
The paper's central and least comfortable claim is that price is path-dependent. Second-by-second transaction volume is a trickle, so a minor market order can spike the price, the spike trips stop-losses and margin calls, the liquidations are more market orders, and the loop feeds itself. No fundamental input required. Cespa and Foucault formalize the same fragility: a small drop in one asset's liquidity propagates through a feedback loop into a large, market-wide liquidity crash, with multiple equilibria where the bad one looks like the May 6, 2010 Flash Crash.
The FX record is a list of these. The August 2007 yen carry unwind produced one of the highest realized volatilities and the highest absolute serial correlation in five-second returns on record; algorithms as a group aggressively sold dollars and bought yen while humans on the other side bought and sold in roughly equal amounts. The machines moved together; the humans did not. On May 6, 2010, the DJIA lost about 900 points in minutes, a 1,010-point intraday swing, triggered by a mutual fund's 4.1-billion-dollar E-mini sell that HFT did not start but amplified into a "hot potato." In FX that day, EBS algorithmic activity actually rose to 53.5% of the total against 46.5% manual, versus a 45/55 norm, so the algos did not flee, they leaned in. Menkveld and Yueshen later showed the mutual fund was only 4% of net E-mini sells during the crash itself, which means the cascade, not the trigger, did the damage.
Then March 2011, the cleanest FX example.
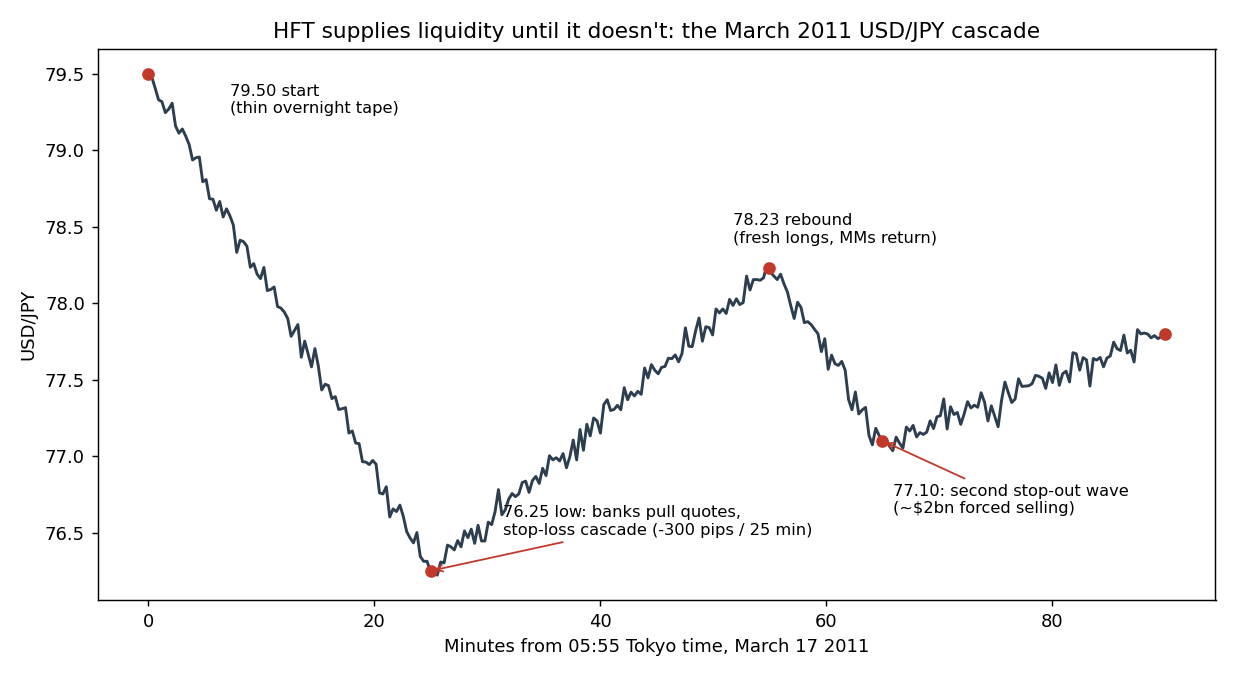
Retail margin stop-losses set off the first wave of dollar selling into a thin tape. Banks withdrew from making prices or widened spreads until their bids were far below the last trade, which is exactly the volatility-conditioned spread behavior the old article "Spread Widening During Volatility Expansion" described, except here it went all the way to withdrawal. That drove the price lower, which tripped more stops, a positive feedback loop down to 76.25. The recovery to 78.23 came only when fresh longs stepped in and banks resumed quoting. The second leg down to 77.10 was another automated stop-out cascade, about two billion dollars, when a Tokyo platform restarted and dumped compulsory stop orders on six obligated market makers. Both HFT and traditional makers had stepped away. The lesson the authors draw is sharp: even venues with designated, obligated market makers give you no guarantee on quote quality, because obligated makers widened their spreads so far the obligation was meaningless.
The nuance the headline skips
If the story stopped there it would be dishonest, and the paper does not stop there. During two central bank interventions, HFT was the good guy. At the BOJ intervention at 01:00 GMT on August 4, 2011, the USD/JPY jump did not break the two-sided market: manual traders quoted 100% of the time, HFT and Slow AI failed to provide two-sided liquidity for only two and eight seconds respectively, and HFT set the spread throughout. Only the Ultra-HFT tier withdrew for several minutes around 02:40. At the SNB intervention on September 6, 2011, from 08:00 to 08:30 GMT, HFT was the quickest of all groups to restore two-sided quoting and the most active in setting the spread, while Ultra-HFT was the slowest to come back.
So the real finding is conditional, not a slogan. HFT reliably supplies liquidity, tightens spreads, and restores two-sided markets fast during large but orderly moves like a telegraphed central bank action. It withdraws and amplifies during disorderly, surprise cascades where its own positions are suddenly underwater. The distinction that keeps showing up is the Ultra-HFT tier: fastest to post in calm, first to vanish in stress. "HFT is good for markets" and "HFT causes flash crashes" are both true, on different days, and anyone selling you only one half is selling you something.
Correlation is the hidden fragility
The mechanism that turns many independent makers into one fragile maker is strategy correlation. Chaboud and coauthors, using EBS data from 2003 to 2007 on EUR/USD, USD/JPY, and EUR/JPY where human and computer trades are separately tagged, found strong evidence that computers do not trade with each other as much as random matching would predict. Their strategies are more correlated and less diverse than humans'. On average this is benign and even useful: algorithmic quoting reduced triangular arbitrage opportunities and cut the absolute autocorrelation of five-second returns, because machines reprice on new information faster than people. But the same commonality means that when the shared signal says "get out," they all get out together, collectively acting as one enormous trader. Jarrow and Protter warned about precisely this: common signals plus speed produce momentum and less informative prices. Correlated liquidity is liquidity that disappears all at once, which is no liquidity at all in the one moment you need depth.
A fix at the queue, not the tax
Regulators mostly reached for blunt instruments: circuit breakers, a 500-millisecond minimum resting time under MiFID, order-count caps, and France's 0.2% Tobin tax. Becchetti and coauthors found the French tax did cut intraday volatility, but it also cut transaction volume, which is the brute-force tradeoff: you buy calm by killing activity. The paper's own proposal is subtler. Instead of punishing makers, reward the ones who quote both sides. It changes the order-book queue itself, from the standard price-time priority to what the authors call spread/price-time priority.
Under normal price-time priority, the best price wins and ties break by who was first. The proposal blends price rank with spread rank using one knob, alpha between 0 and 1.
$$ \text{rank}(\alpha) = \alpha \times \text{price} + (1 - \alpha) \times \text{spread} $$
The rank of a limit order is a weighted average of its price rank (weight alpha) and its spread rank (weight one minus alpha), and the lowest rank gets executed first. Set alpha to 1 and you are back to pure price-time priority, spread ignored. Set alpha to 0 and it is pure spread-time priority, price ignored. Lower alpha means more weight on the spread, which hands better queue position to traders who quote a tight two-sided market. Worked example: suppose a one-sided sell order is 0.4 pips off the best ask, and the widest resting two-sided quote has a 1.0-pip spread, so the one-sided order inherits spread rank 1.0. A competing two-sided maker sits 0.6 pips off the best price but quotes a tight 0.3-pip spread. At alpha of 0.5, the one-sided order ranks 0.5 times 0.4 plus 0.5 times 1.0, which is 0.70, while the two-sided maker ranks 0.5 times 0.6 plus 0.5 times 0.3, which is 0.45. The two-sided maker jumps the queue despite the worse price, because it revealed information about both sides.
That requires defining the two ranks. Price rank is your distance from the current best price on your side, and spread rank depends on whether you quote one side or both.
$$ \text{price} = \text{ask} - \text{ask}^{\text{best}} \quad (\text{sell}), \qquad \text{spread} = \text{ask} - \text{bid} \quad (\text{two-sided}) $$
A sell order's price rank is its ask minus the best resting ask, so a new best ask ranks 0 and worse asks rank higher (a buy order is symmetric, best bid minus your bid). A two-sided order's spread rank is simply its own ask minus bid. A one-sided order does not get to skip the spread term: it is assigned the worst spread among resting two-sided orders, so it is always "at par" with the least competitive real maker. Worked example: best ask is 1.2000, you post a sell at 1.2002, so your price rank is 0.0002, two pips. If you also post a bid at 1.1999, your spread rank is 1.2002 minus 1.1999, which is 0.0003, three pips. Quote only the sell and you inherit whatever the widest two-sided spread in the book is, which is a strictly worse deal. The design makes one-sided quoting structurally expensive in queue position, which is the whole point: it pays makers to stay two-sided.
Does the queue fix actually work
The authors test it in Bartolozzi's agent-based limit-order-book model, which reproduces the empirical fingerprints of real microstructure: negative return autocorrelation, clustered volatility and volume, and non-linear price response to size. They add two knobs: alpha, and p, the probability a trader posts a two-sided rather than one-sided quote, capped at a 10-pip spread. They sweep both on a 0.1-to-0.9 grid, 81 combinations, 1,000 iterations each. Volatility is measured as an average across eight timescales so it captures both the scalper's world and the swing trader's.
$$ \sigma = \frac{\sigma_{1} + \sigma_{2} + \sigma_{5} + \sigma_{10} + \sigma_{15} + \sigma_{20} + \sigma_{25} + \sigma_{50}}{8} $$
Overall volatility is the mean of the return standard deviations measured at 1, 2, 5, 10, 15, 20, 25, and 50 time-step horizons. Averaging across scales stops the metric from flattering a mechanism that only calms one horizon while roughening another. Worked example: if the per-horizon standard deviations came out at 0.9, 0.8, 0.7, 0.6, 0.55, 0.5, 0.48, and 0.47 model units, the reported sigma is their sum, 4.90, divided by 8, which is 0.61. A fix that cut only the 1-step number to 0.3 would barely move this average, which is the design intent.
The result is the useful part.
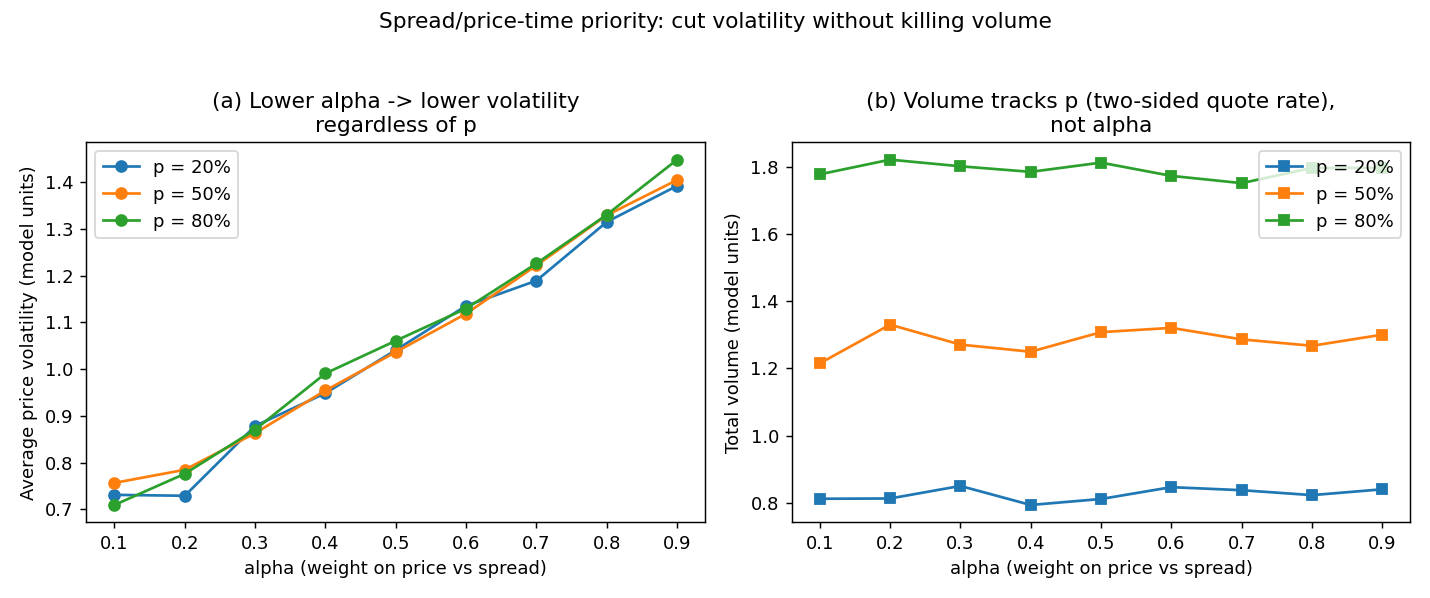
Lowering alpha, putting more weight on spread, reduces volatility regardless of p. Total volume, meanwhile, tracks p and is essentially flat in alpha. Read together, that is the claim: you can dial down volatility with the queue rule without sacrificing volume, which is exactly the tradeoff the Tobin tax loses. HFT keeps its market-making revenue, long-term traders get a calmer tape, and volume survives.
The skeptic's ledger
Hold the enthusiasm at the right level. Take the taxonomy and the cascade mechanics as real: they rest on transaction-level EBS and Oanda data and documented events. Treat the fix as an untested hypothesis, because that is what it is. It lives inside a single agent-based model, Bartolozzi's, 81 runs of 1,000 synthetic iterations, with no live venue ever running spread/price-time priority. Agent-based models are calibrated to reproduce stylized facts, which means they can also reproduce a convenient result; a real order book has adverse selection, latency arbitrage, and gaming incentives that a toy will not surface. The authors themselves note the rule can produce crossed or locked quotes for any alpha above zero, which is a real implementation headache.
The event evidence is anecdotal by the paper's own admission, four episodes across different stages of HFT's evolution, not a controlled panel. And the liquidity-provision measurements are from EBS, the institutional venue with a one-million-unit minimum. Retail did not get that liquidity in March 2011; retail stop-losses were the fuel. So the honest read for someone trading a retail account is grim: you carry the wider spread and the last-look rejection in calm markets, per the old article "Why Retail FX Execution Is Not the Same as Interbank FX," and in a cascade you are the first to be liquidated into a book whose depth was 93% cancellable to begin with. The machines supply liquidity until they don't, and when they don't, you are not on the EBS side of that trade.
Where this connects
For Pillar 4, this is the market-structure floor under every FX strategy: your edge is computed against quoted prices, and quoted prices are path-dependent artifacts of a correlated, mostly-cancellable book that thins out precisely in the tails your risk model cares about. For Pillar 5 microstructure, the queue-priority idea is the constructive counterpart to the destructive cascade: the same limit-order-book mechanics that manufacture a flash crash can, in principle, be re-engineered to dampen one. Both pillars share the same uncomfortable premise, that in FX the plumbing is the strategy, and pretending price is a clean signal on top of infinite liquidity is how retail accounts get stopped out at 76.25.
KEY POINTS
- The FX market is a non-hierarchical mesh of venues (EBS and Reuters interbank books, Currenex and Hotspot ECNs, Oanda FCM, CME futures) with wildly different tick sizes, minimum tickets, and rules like last look and a 250-millisecond minimum quote lifetime.
- The order book is mostly phantom liquidity. On EUR/USD, Ultra-HFT posts 61.6% of orders but fills only 6.8% of them; manual traders post 3.7% but fill about 50%. Depth you see can be cancelled before you hit it.
- FX prices are path-dependent. A thin tape plus stop-losses and margin calls creates self-feeding cascades with no fundamental cause: August 2007, May 2010, and the March 2011 USD/JPY drop of 300 pips in 25 minutes.
- HFT's role is conditional, not one-sided. It supplied and restored liquidity fastest during the orderly BOJ and SNB interventions, but withdrew and amplified during disorderly surprise cascades. The Ultra-HFT tier is consistently first to leave.
- Correlated strategies are the hidden fragility. Machines trade less diversely than humans, so when a shared signal says exit, they all exit at once and act as one giant trader, which is when depth vanishes.
- The proposed fix is spread/price-time priority: rank equals alpha times price rank plus one minus alpha times spread rank. Lower alpha rewards two-sided quoting, and in an agent-based model it cuts volatility without cutting volume, unlike a Tobin tax.
- The taxonomy and cascade mechanics are solidly evidenced; the queue fix is a single agent-based model with no live-venue test, so treat it as a hypothesis. Retail sits on the wrong side of all of it.
References
- Trading Systems and Methods - Perry Kaufman (Amazon)
- Cybernetic Trading Strategies - Murray Ruggiero (Amazon)
- The Art of Currency Trading - Brent Donnelly (Amazon)
- High-Frequency Trading in FX Markets (HFT in FX markets - Glob)
A note on AI. The ideas, research, analysis, and conclusions in this article are my own. I use AI tools to help with editing and wordsmithing, because English is not my first language, and I am not shy about that. AI-generated ideas and AI-assisted writing are not the same thing: the first is empty slop from a generic prompt, the second is a tool for communicating years of real research more clearly. Judge the work by its substance, not by whether software helped polish the prose.