4.72 Graph Learning for FX: Interest-Rate-Parity Statarb Done Right
A dollar looped through euros and yen should come back a dollar. Sometimes it comes back bigger. A graph neural net hunts that sliver across ten currencies, winning on risk, not return.
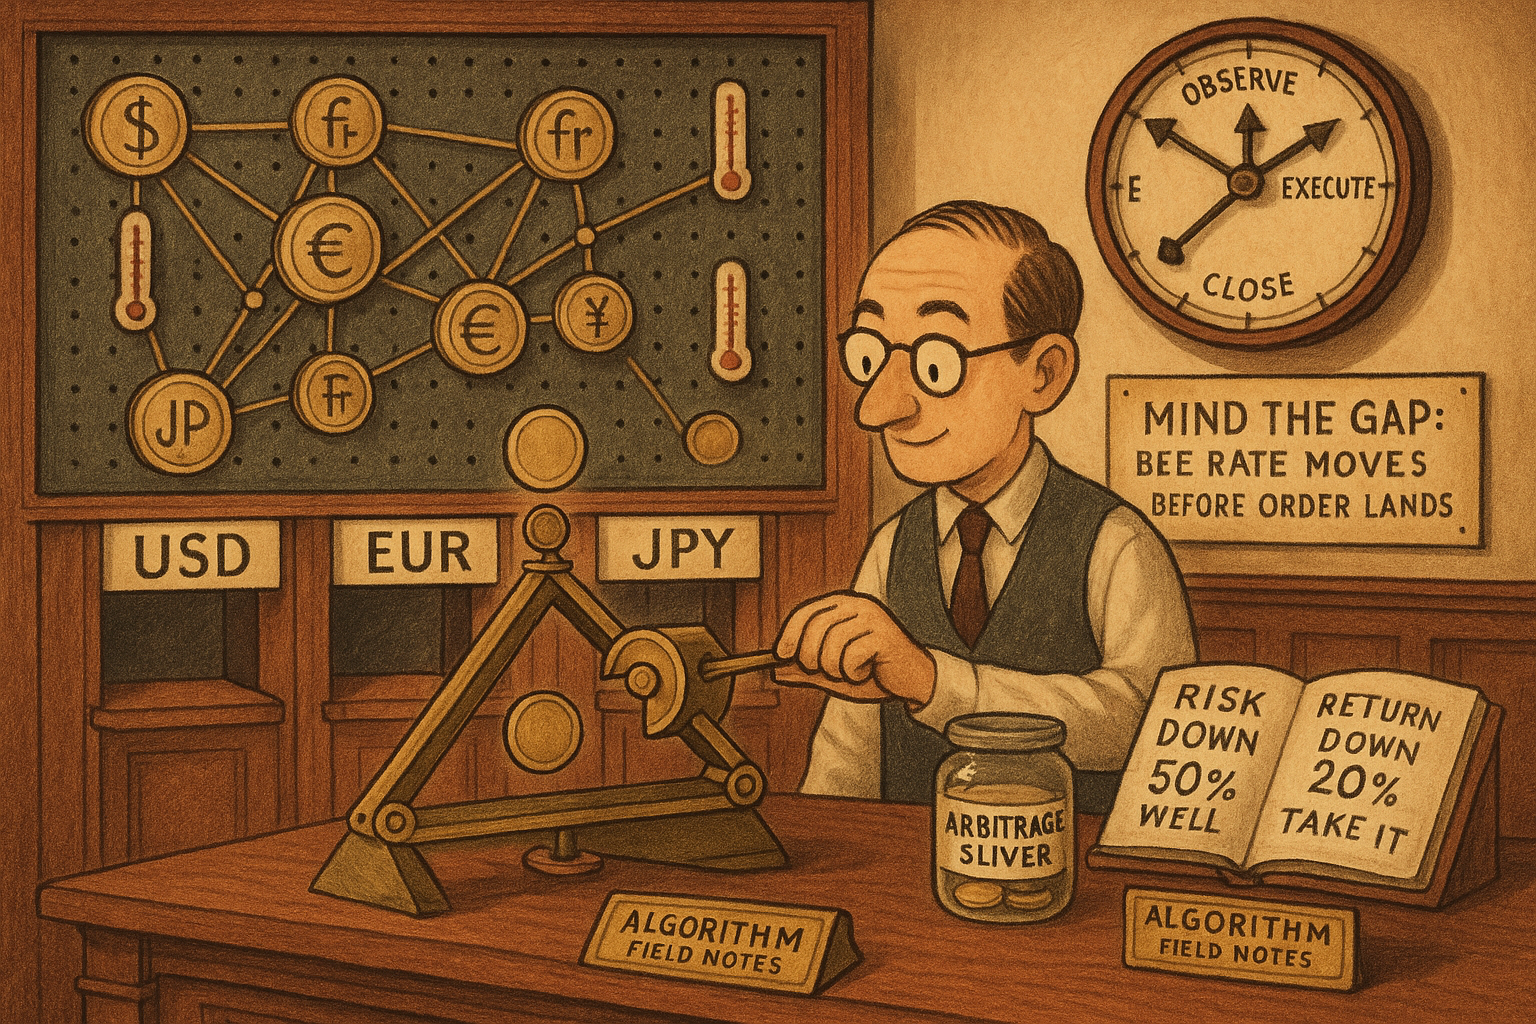
Take one dollar. Buy euros with it, buy yen with those euros, then buy dollars back with the yen. In a clean market you end where you started, holding exactly one dollar, because the three exchange rates are locked together by an identity. Sometimes you end with slightly more than a dollar. That sliver is triangular arbitrage, and it exists in real spot data even though the textbook says it cannot. Yoonsik Hong and Diego Klabjan built a two-stage graph neural network across ten currencies to hunt those slivers, and the interesting part is not the machine learning. It is that they beat the standard arbitrage solver by 61.89% on information ratio while cutting volatility in half and drawdown by 45%, and they did it by fixing a bias the whole prior literature ignored.
The old article "From Intermarket Analysis to Network Momentum" made the case that markets are a graph and a signal flows along the edges. The old article "Granger Causality: Finding What's Driving Your Currency Right Now" made the case that you should find the live driver of a currency instead of guessing. This paper fuses both instincts into one FX arbitrage engine and then does something most quant papers skip: it takes the look-ahead bias seriously.
The triangle that should close and does not
Two identities govern currency conversion. The first is direct: the rate from currency i to j times the rate from j back to i should equal one, so a round trip through a single pair leaves you flat. The second is triangular: the rate from i to j should equal the rate from i to k times the rate from k to j. When that second identity breaks, a three-currency loop pays.
$$ \text{Loop payoff} = X_{ik}\, X_{kj}\, X_{ji} - 1 $$
The loop payoff is what you keep after converting one unit of i into k, then k into j, then j back into i, minus the unit you started with. If the product of the three rates lands above one, the loop is profitable. Work it with numbers. Say the rate from USD to EUR is 0.92, from EUR to JPY is 162.0, and from JPY back to USD is 0.0068. Multiply: 0.92 times 162.0 is 149.04, times 0.0068 is 1.0135. You end with 1.0135 dollars, a 1.35% gain on the loop, because the three quotes drifted out of alignment for a moment. In theory this is zero. In practice, Aiba and coauthors documented it as a real interaction among FX rates, and Hong and Klabjan build their whole method on exploiting the loops that appear across three or more currencies, not just three.
The classic way to scale this past a single triangle is a linear program. Soon and Ye wrote the template: observe all the rates, set up cash-flow-balance constraints so you hold nothing but your home currency at the end, and let the LP maximize the profit across every possible loop. That LP is the benchmark this paper is trying to beat, and its fatal assumption is coming up.
Why interest rates belong in the graph
FX rates are not free-floating numbers. Interest rate parity ties every currency pair to the interest rate gap between the two countries. Covered interest rate parity is the exact version.