9.40 Do Polymarket Prices Converge? Bias and Volatility Evidence
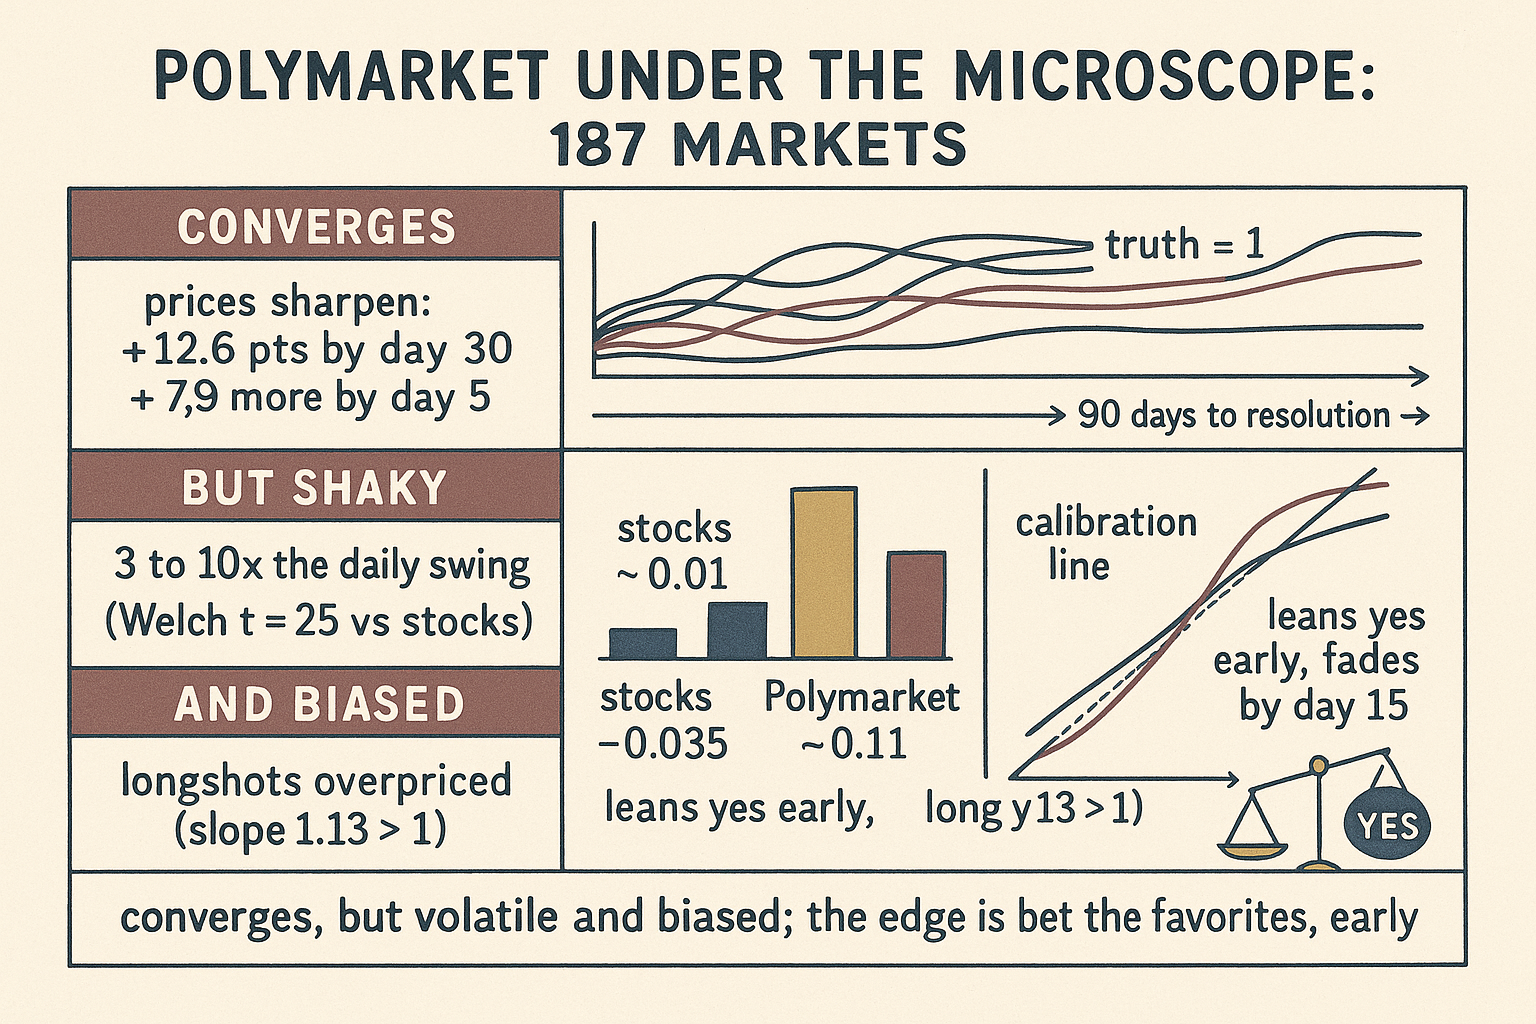
Polymarket prices do converge to the truth over 90 days. But they are far more volatile than stocks or crypto, overprice longshots (slope 1.13 > 1), and lean "yes." The edge: bet favorites, early.
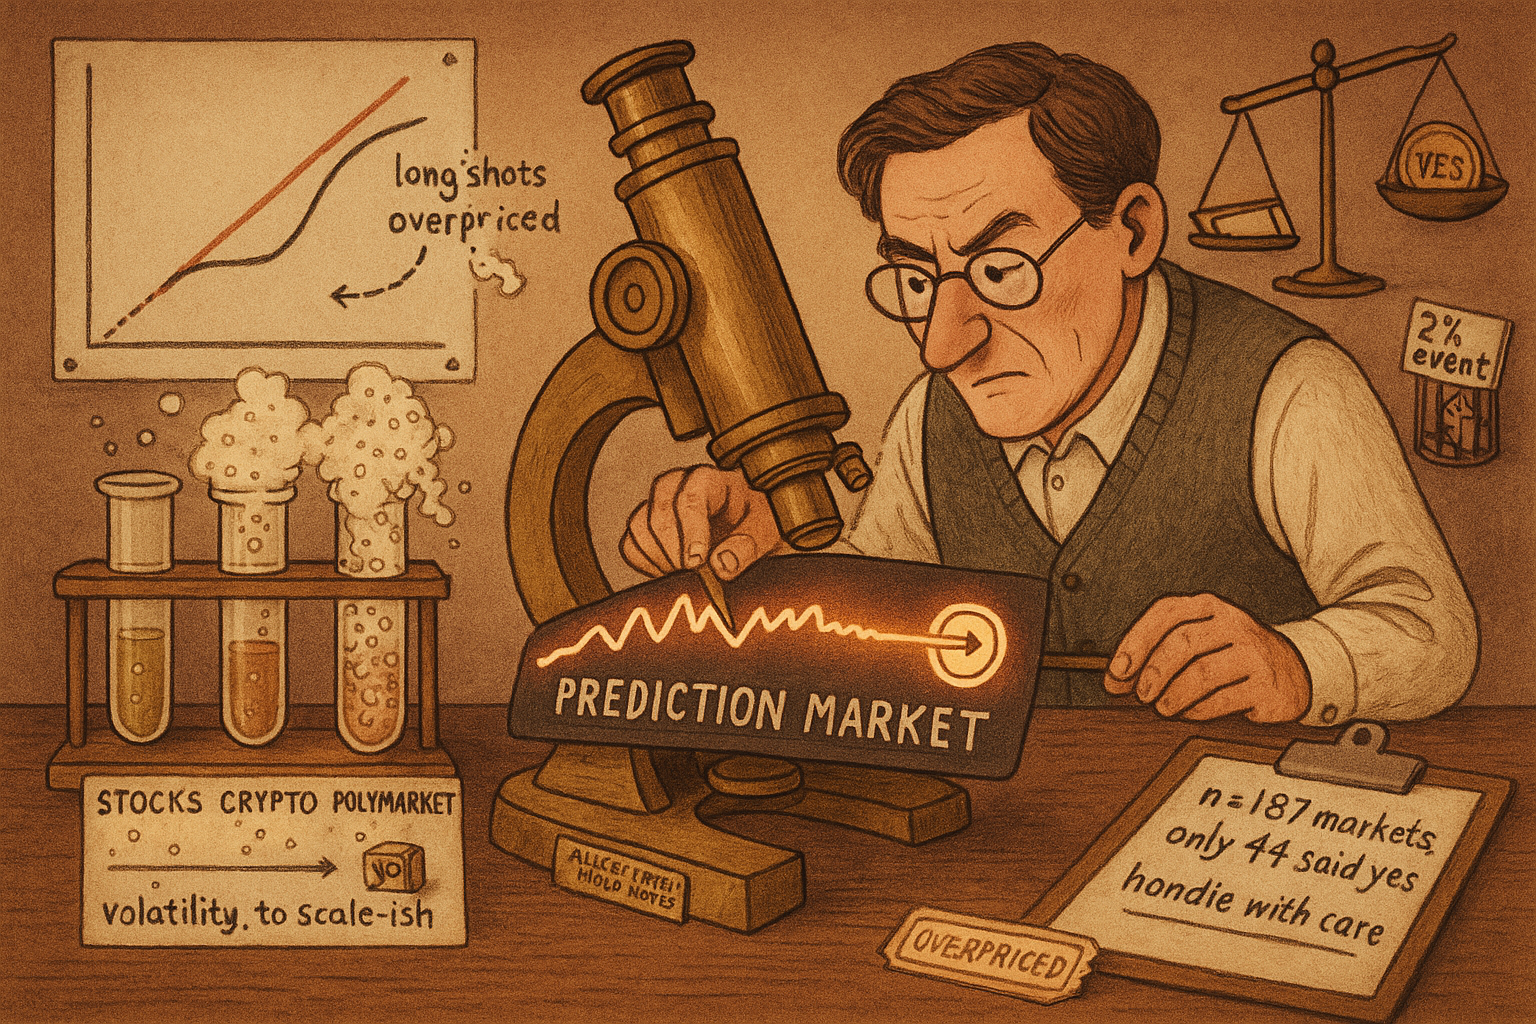
Everyone repeats the same slogan: prediction market prices are probabilities, and the crowd is wise. A 2024 master's thesis out of Charles University actually checked, on 187 Polymarket markets that resolved between December 2023 and April 2024, and the answer is more interesting than the slogan. Prices do converge to the truth as resolution nears, which is the good news. But the ride is far more violent than stocks or crypto, and the prices carry two measurable, exploitable biases: they overprice longshots and they lean toward "yes." Three findings, one reassuring and two that should keep you honest.
The old article "What a Market Price Actually Is: Capital-Weighted Consensus and the Brier Skill Score Gate" argued that a price is only a probability if it survives a calibration test. This thesis runs that test on real Polymarket data and finds the price passing on convergence while failing on calibration in a specific, patterned way. That gap is where an edge lives, and also where you can fool yourself, so read the numbers before you read the conclusion.
The prices do converge, and you can clock the speed
Start with the reassuring part. Take a snapshot of a market's probability 90, 30, and 5 days before it resolves, and ask whether the probability assigned to the eventual winner climbs as the clock runs down. It does, and the movement is large. The average jump in the probability of the correct outcome from 90 days out to 30 days out is 12.6 percentage points, with a standard deviation of 21.3 points. From 30 days to 5 days it climbs another 7.9 points, standard deviation 20 points.
Those gaps are not noise. A one-sample t-test on the 90-to-30 move returns a t-statistic of 8.01; the 30-to-5 move returns 5.36. Both p-values sit far below 0.0001, so the market genuinely sharpens as information arrives and the window for surprises shrinks. The author also fit a crude daily linear model:
$$ \widehat{p}_{\text{correct}} = 0.860 + 0.003 \times \text{day} $$
Read it plainly. The probability the market assigns to the eventual outcome starts around 0.860 and creeps up by roughly 0.003, three tenths of a percentage point, for each additional day closer to resolution. Work a number: move 40 days closer and the model adds 0.003 times 40, about 0.12, or 12 percentage points of extra confidence in the right answer. The slope's t-statistic is 40, which looks decisive, but the author is refreshingly blunt that daily probabilities are autocorrelated, so the regression's standard errors are understated and this line "serves only to point out the relationship." Trust the t-tests on the 90/30/5 snapshots, not the pretty slope.
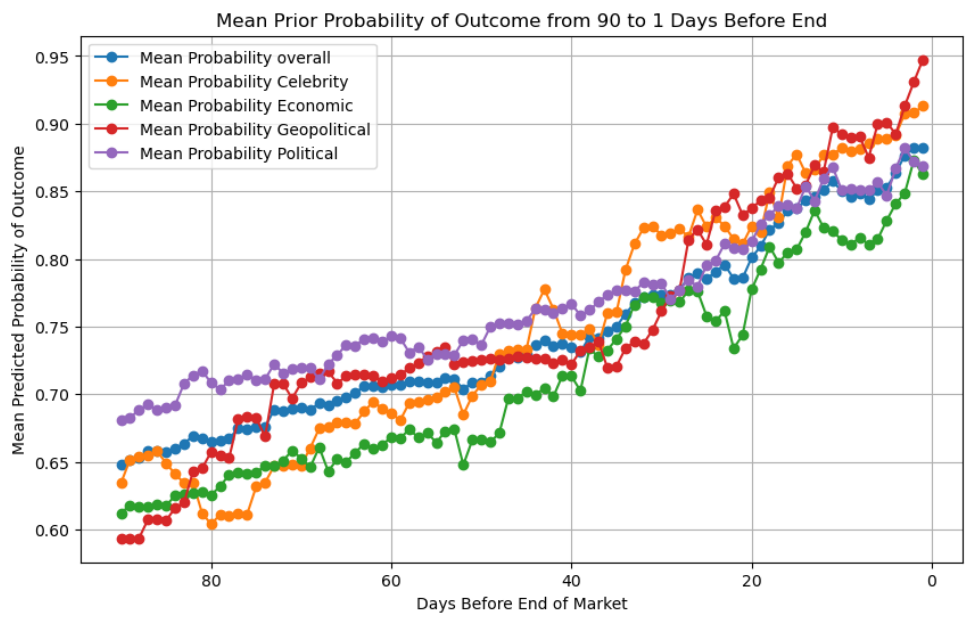
Split by category and the convergence holds everywhere, but the starting point differs. Ninety days out, political markets already sit at 68.1% confidence in the eventual outcome against 59.3% for geopolitical ones, and that gap is the only category difference that clears significance at 90 days (geopolitical versus political, p = 0.04). By five days out, every category has climbed into the mid-to-high 80s and no pairwise comparison is significant anymore. The lesson for a trader is that the informational edge across categories exists early and evaporates late. If you think you read geopolitics better than the crowd, the time to express that is three months out, not the week of resolution.
The ride is brutal: volatility
Now the part the slogan never mentions. A prediction market token is not a gentle probability drifting to its answer. Measured as the standard deviation of daily returns, Polymarket is wildly more volatile than either stocks or crypto.
$$ \sigma = \sqrt{\frac{1}{N-1}\sum_{t=1}^{N}\left(r_t - \bar{r}\right)^2} $$
That is just the standard deviation of daily returns r-t around their mean r-bar. Work a tiny example: a token posting daily returns of +20%, minus 10%, +15%, and minus 25% has a mean of zero and a standard deviation of about 0.19, meaning a typical day moves the price roughly 19%. A blue-chip stock's daily standard deviation sits near 1%. That is the gap the thesis measures.
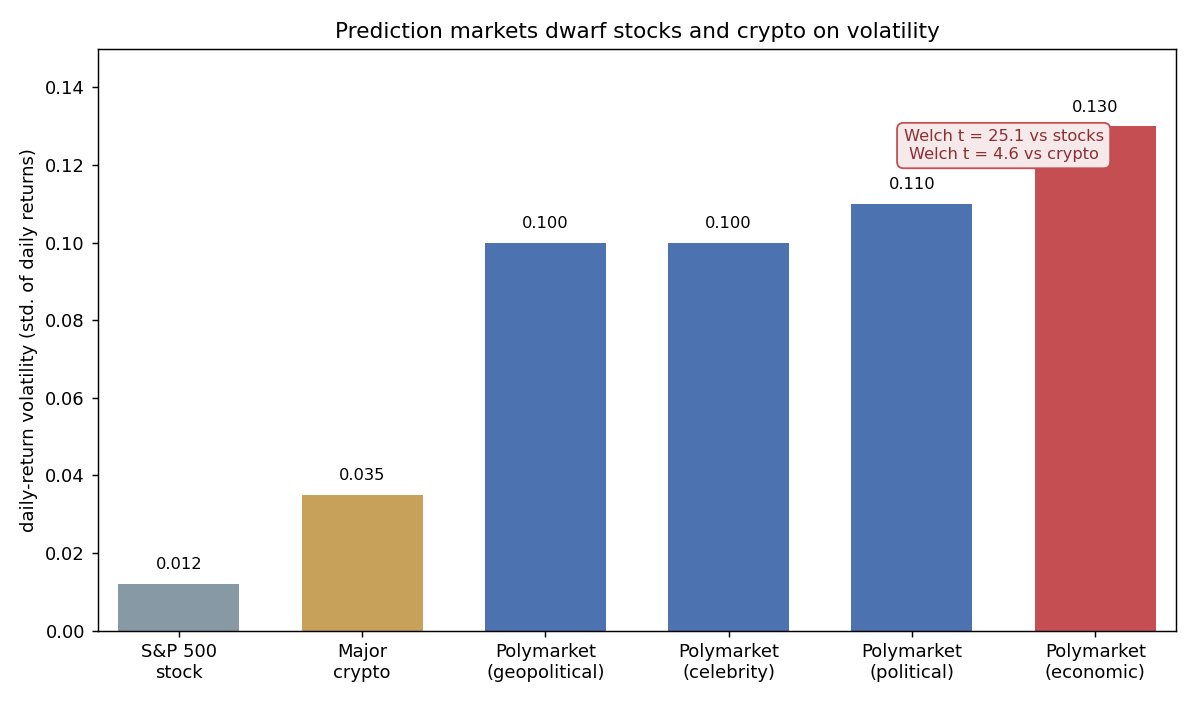
The comparison uses Welch's t-test, chosen because the variances are nowhere near equal. Polymarket versus stocks returns a t-value of 25.1, an absurd distance past the critical value of about 1.97. Polymarket versus major cryptocurrencies returns 4.6, past the critical 2.365. So the ordering is stocks, then crypto, then prediction markets, each step up a real jump in daily risk. Within Polymarket, economic-indicator markets are the most volatile at a mean daily volatility of 0.13, significantly above the rest (t = 2.63, p = 0.01), while celebrity markets are the calmest at 0.10 (t = minus 2.16, p = 0.03). The practical read: position sizing that feels sane on a stock will get you liquidated on a prediction market, because the same nominal edge rides on three-to-ten times the daily swing.
Here is the contrarian kicker the author half-buries. The obvious hypothesis, that volatility spikes as resolution nears, because liquidity providers pull out to dodge divergence loss and news arrives faster, does not hold. Comparing volatility 90-to-61 days out (mean 0.073), 60-to-31 days (0.058), and 30-to-1 days (0.059), no pairwise t-test is significant; the largest is t = 1.04, p = 0.15. If anything, volatility drifts down into resolution, the opposite of the story. Do not assume the endgame is the wild part. On this sample it was the opening.
The prices are biased: longshots are overpriced
Convergence and volatility are about dynamics. The sharper edge is static mispricing. Bundle every market by its predicted probability and check how often each bucket actually resolves "yes." A well-calibrated market has the 10-to-20% bucket resolving yes about 15% of the time. Instead, the low buckets resolve far less often than their price implies. Ninety days out, the 0-to-10% bucket resolved yes just 2.4% of the time, and the 10-to-20% bucket only 10.5%. The market was charging longshot prices for events that almost never happened.
Formalize it with a weighted least squares regression of each bundle's actual outcome rate on its average predicted probability, weighting by how many markets fall in each bundle:
$$ \text{actual}_b = \beta_0 + \beta_1 \cdot \bar{p}_b, \qquad H_0: \beta_1 = 1 \;\; \text{vs} \;\; H_1: \beta_1 > 1 $$
If the market were perfectly calibrated, the slope beta-1 would be exactly 1: a bucket priced at 30% should resolve yes 30% of the time. A slope above 1 means the line is too steep, so low prices undershoot reality (longshots overpriced) and high prices overshoot (favorites underpriced). The fit gives beta-1 = 1.13 with a standard error of 0.058 and an R-squared of 0.955. Test it: the t-statistic is (1.13 minus 1) divided by 0.058, which is 0.13 over 0.058, about 2.18. Against the critical value of 1.734 for 18 degrees of freedom at the 5% level, 2.18 clears it, so you reject calibration and confirm the overestimation of low probabilities.
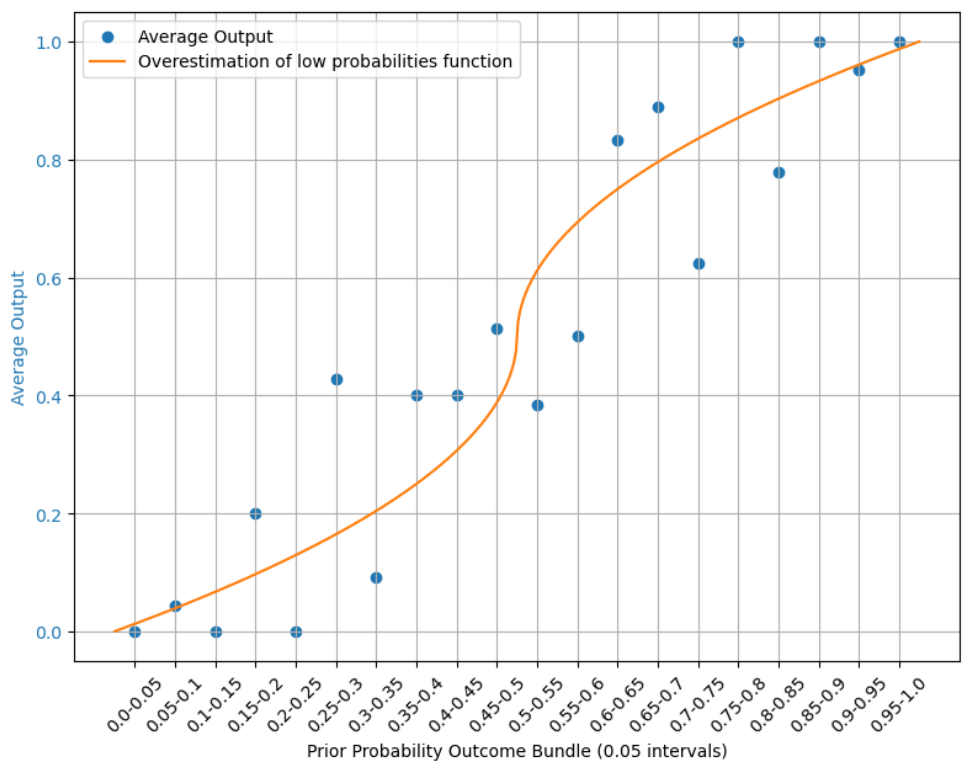
The straight-line model was flagged as misspecified by a Ramsey test, because the true relationship is an S-curve, not a line. The author swapped in a monotone, centrally-symmetric bias function pinned to pass through the point (0.5, 0.5), and it fit at R-squared 0.98 with its own slope of 1.04. Either way the verdict is identical: bet the favorites. Systematically buying high-probability tokens and avoiding longshots was profitable on this sample, which is the same probability-weighting distortion Kahneman and Tversky documented in prospect theory, now showing up in a crypto order book. This is exactly the kind of durable, ranked mispricing the old article "The Term Structure of Prediction-Market Strategy and Crowding: Why the Fastest Three Bots Take 80 Percent" warned gets arbitraged by whoever moves first, so treat the edge as real but crowded.
The prices lean yes: acquiescence bias
There is a second, subtler tilt. Because every market is phrased as a yes/no question, people disproportionately buy "yes," which should make yes tokens systematically overpriced. Test it by summing each market's implied probability into an expected count of yes outcomes and comparing to how many actually happened:
$$ \mathbb{E}[\text{yes}] = \sum_{i=1}^{N} p_i, \qquad H_0: \mathbb{E}[\text{yes}] = \text{actual yes} \;\; \text{vs} \;\; H_1: \mathbb{E}[\text{yes}] > \text{actual yes} $$
The expected yes count is just the sum of the individual yes probabilities across all N markets; a binomial test then asks whether the market expected more yeses than reality delivered. Ninety days out, the market's prices implied 72.5 yes outcomes, but only 44 of the 187 markets actually resolved yes, a gap with p far below 0.001. At 60 days the implied count was 67.8, at 30 days 58.3, both still significant. By 15 days the implied count had fallen to 49.5 against the same 44 actual, and the gap was no longer significant (p = 0.41).
So yes, the market leans affirmative, and the lean fades as resolution approaches, another face of the self-correction the convergence section found. But stay skeptical about naming it. Only 44 of 187 markets resolved yes, a base rate of 24%, so a chunk of what looks like acquiescence bias is really the same longshot overpricing seen earlier: most of these markets asked "will this unusual thing happen," and the honest answer was usually no. The author says as much. Two biases pointing the same direction on a small sample are hard to cleanly separate, and 187 markets with 44 yeses is a thin dataset to hang a trading system on. The direction is credible; the precise magnitude is not bankable.
Where this connects
This thesis is an empirical stress test of the claim the whole pillar rests on. The old article "What a Market Price Actually Is: Capital-Weighted Consensus and the Brier Skill Score Gate" said a price earns the name "probability" only by passing a calibration gate. Here the gate is a weighted regression whose slope should be 1, and Polymarket flunks it at 1.13: the price is a biased probability, not a clean one. The convergence result rescues the slogan for the endgame, since the bias shrinks toward resolution, but the opening is where the price and the truth disagree most.
The trading implication ties straight into the old article "The Term Structure of Prediction-Market Strategy and Crowding: Why the Fastest Three Bots Take 80 Percent." A durable, direction-stable mispricing, longshots overpriced and yes overbought, is precisely the kind of signal that gets crowded and front-run by the fastest capital. The edge here is real on 2023-to-2024 data, but it is the most obvious edge in the room, which means its half-life is short and its capacity is small. Fade the longshots, lean on the favorites, act early while categories still disagree, and size for volatility that will humble a stock trader. And remember the sample is 187 markets on a young venue; the pattern is a hypothesis with good p-values, not a law.
KEY POINTS
- On 187 Polymarket markets resolving December 2023 to April 2024, prices converge to the truth as resolution nears: the probability on the eventual outcome rises 12.6 points from 90 to 30 days out (t = 8.01) and 7.9 more from 30 to 5 days (t = 5.36).
- Category edges exist early and vanish late. Political markets are sharpest 90 days out (68.1% on the eventual outcome), but by 5 days every category clusters in the high 80s with no significant differences.
- Prediction markets are far more volatile than traditional assets. Daily-return volatility beats stocks (Welch t = 25.1) and crypto (t = 4.6); economic markets are most volatile (0.13), celebrity least (0.10).
- Volatility does not rise into resolution. Across 90-61, 60-31, and 30-1 day windows no difference is significant (largest t = 1.04), contradicting the liquidity-withdrawal hypothesis; if anything it declines.
- Prices overestimate low probabilities. A weighted regression of actual outcomes on predicted probability gives a slope of 1.13 (SE 0.058), significantly above the calibrated value of 1 (t = 2.18), so longshots are overpriced and favorites underpriced. Bet the favorites.
- Prices also lean "yes" (acquiescence bias): implied yes counts of 72.5 at 90 days versus 44 actual (p far below 0.001), fading to insignificance by 15 days (p = 0.41).
- Stay skeptical: only 44 of 187 markets resolved yes, so acquiescence and longshot overpricing are entangled, the convergence regression is autocorrelated, and 187 markets on a young venue is a thin base for a trading system.
A note on AI. The ideas, research, analysis, and conclusions in this article are my own. I use AI tools to help with editing and wordsmithing, because English is not my first language, and I am not shy about that. AI-generated ideas and AI-assisted writing are not the same thing: the first is empty slop from a generic prompt, the second is a tool for communicating years of real research more clearly. Judge the work by its substance, not by whether software helped polish the prose.