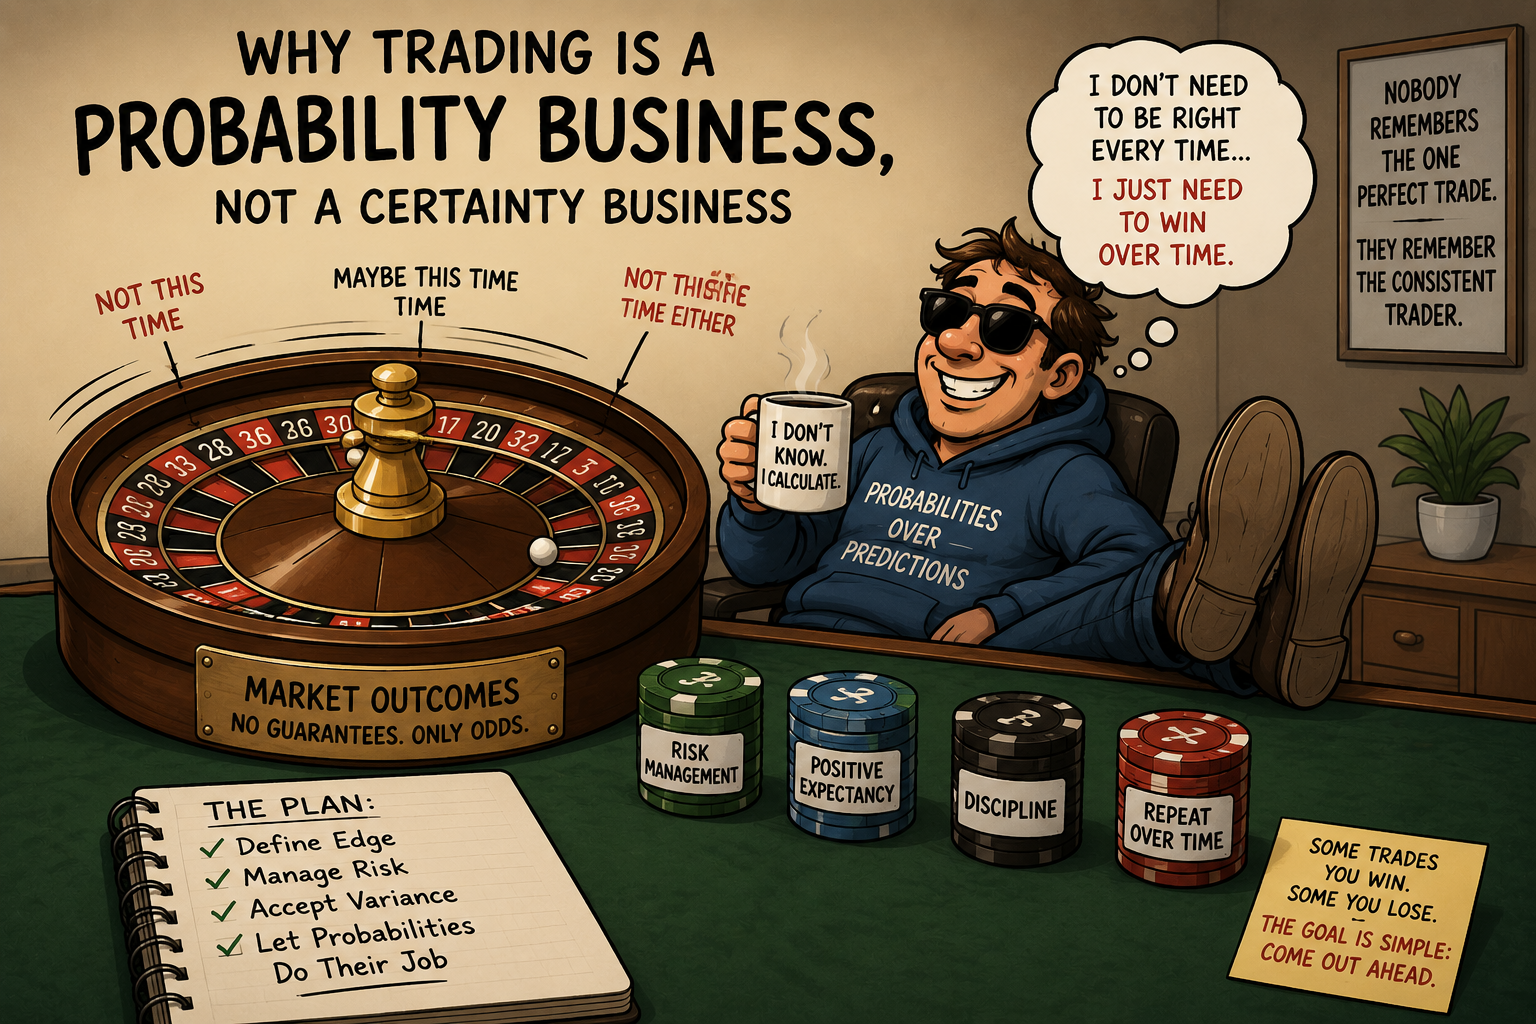
1.9 Why Trading Is a Probability Business, Not a Certainty Business
Trading is not about being right on every trade. It is about managing probabilities over hundreds of trades. A single win or loss means almost nothing. The edge appears only through repetition, discipline, risk control, and positive expectancy over time.
Most retail trading pain comes from treating each trade as a verdict on the system. The trade closes at a loss, the trader concludes "the system is wrong," and starts adjusting. The trade closes at a profit, the trader concludes "I am right," and increases size. Both conclusions are statistical errors. A single trade is one sample from a distribution. The distribution decides whether the system works. The single sample carries little of the information needed to update on the distribution.
A professional treats every trade as a draw from a known distribution with known properties and a known tolerance for variance. The trade outcome adds one data point to the running estimate of the distribution. The next decision depends on the distribution, not on the last draw. This is the mental switch that separates a trader from a gambler. The math is the easy part. The discipline is the slow part.
The certainty mindset
The amateur mindset treats each trade as a binary event with a binary outcome.
"This signal is strong, I expect this to be a winner." "That trade lost, the system is broken." "Three losers in a row, I'm sitting out the next signal." "Four winners in a row, I am in good form, time to scale up."
Each of these sentences is a category error. The signal is not "strong" or "weak" except in the sense that it shifts the conditional probability of an outcome by a measurable amount. The system is not "broken" because one trade closed in the red. Three losers in a row is what a 55% win rate strategy produces about 9% of the time. Four winners in a row is what the same strategy produces about 9% of the time. Neither carries information about the next trade.
The certainty mindset produces a predictable behavior: the trader adjusts position size, parameters, or rules based on the most recent few trades. The adjustments are responses to noise. The result is that the trader manufactures their own underperformance by interpreting normal variance as signal.
The probability mindset
The probability mindset starts with a different model of what a trade is.
A trade is a random draw from a distribution. The distribution has a mean (expected return per trade) and a spread (the standard deviation of trade returns). Both are properties of the rule plus the market, estimated from a large sample of past trades. The single trade outcome is one observation from this distribution. It carries no more information about the next trade than one coin flip carries about the next coin flip, given that you already know the coin is biased 55/45.
The relevant decisions for the trader are not "did this trade work" or "should I take the next signal." The relevant decisions are:
- Is the distribution still the same one I estimated? (Has the rule decayed?)
- Is my position sizing correct for the variance of that distribution?
- Is my account survival probability acceptable across the next 1,000 draws?
None of these are about any single trade. All of them are about properties of the underlying distribution and the trader's exposure to it.
The math of why one trade tells you nothing
The expected value of a single trade is the average across the distribution.
In plain words: the win probability times the average win, minus the loss probability times the average loss. For a system with a 55% win rate, an average win of $120, and an average loss of $100:
Now the noise. The standard deviation of trade returns σ for this system works out to around $110 per trade, given the spread of wins and losses around the mean. The single trade is drawn from a distribution centered at +$21 with a width of $110. The next trade can come in anywhere from −$200 to +$240 and still be a normal draw. The single-trade outcome is dominated by noise, not by the edge.
The edge emerges as you average across many trades. The standard error of the mean shrinks with the square root of the sample size.
In plain words: the uncertainty in your estimate of the true mean shrinks as you collect more samples, but only as the square root of the sample count. To halve the uncertainty, you need four times the samples. To get the uncertainty down to a useful level, you need a lot of samples.
Three sample sizes for the same system.
After 1 trade: standard error is $110. The mean of $21 is buried in noise of $110. You know nothing about the system from one trade.
After 25 trades: standard error is $110 / √25 = $22. The mean of $21 sits at the boundary of one standard error from zero. The system might be profitable, might not. You still know almost nothing.
After 200 trades: standard error is $110 / √200 = $7.8. The mean of $21 sits at about 2.7 standard errors above zero. Now you can say with reasonable confidence that the edge is real and positive.
This is the gap between certainty and probability. After 1 trade, the trader who fires the "system doesn't work" decision is acting on noise that is 5x the signal. After 200 trades, the trader has earned the right to update their view.
Visualizing the noise
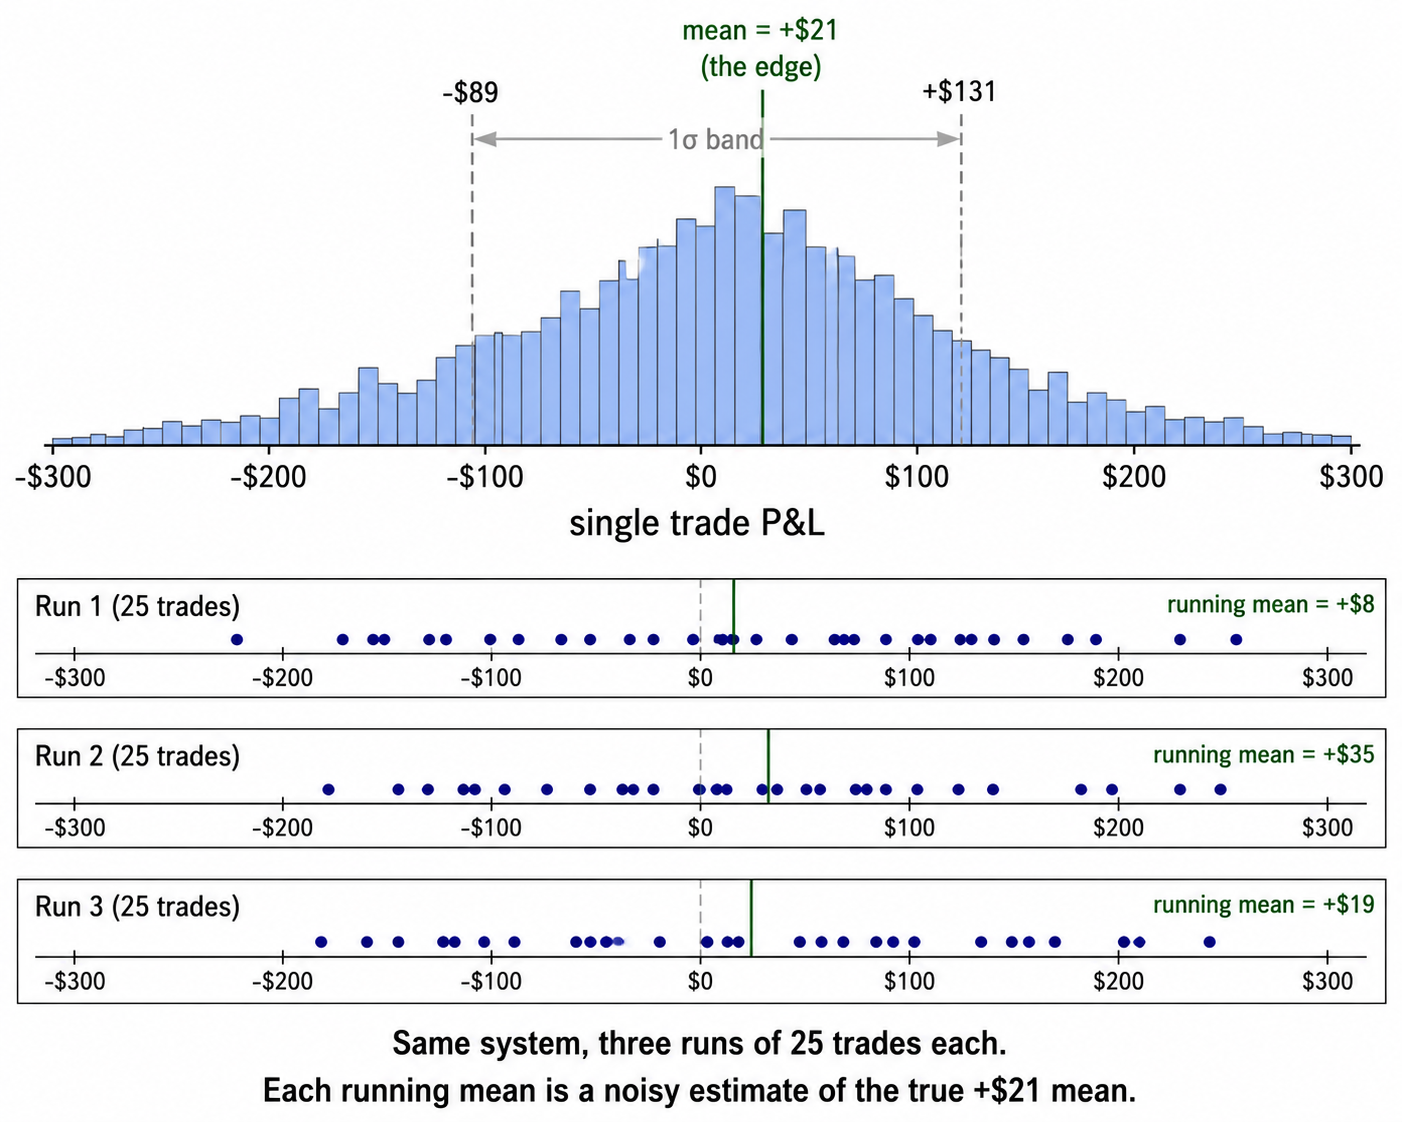
The visual makes the noise concrete. The single-trade outcome can land anywhere across that distribution. The mean of 25 trades is also noisy, often by 50% or more in either direction. Only at 200+ trades does the running mean stabilize close to the true edge.
The behavioral implications
Once you accept that a trade is a draw, several common retail behaviors look wrong.
Adjusting parameters after a losing trade. The losing trade was a draw from the distribution. The distribution did not change because the draw was negative. Adjusting parameters fits the rule to the most recent few draws, which is fitting to noise.
Sitting out a signal after a losing streak. The next signal is a fresh draw. The fact that the last three draws were below the mean does not change the distribution of the next draw. Skipping the next signal removes one positive-expectancy event from your sample. Done enough times, this is the dominant source of underperformance versus the backtest.
Scaling up size after a winning streak. The next signal is still drawn from the same distribution. The fact that the last four draws were above the mean does not change the distribution. Scaling up size at the top of a normal positive run sets you up to take an oversized loss on the next normal negative run.
Judging a month or a quarter by its result. Twenty trading days at 1 trade per day is 20 draws. Twenty draws has a standard error of σ/√20 ≈ 0.22σ. For a system with an edge of 0.1σ per trade, the monthly result will be negative around 30% of the time even though the edge is real. Quarterly results are tighter but still dominated by noise.
The shorter the evaluation window, the more the result is noise. The longer the window, the more the result is signal. Most retail traders evaluate on windows that are too short to be informative, then react to the noise as if it were signal, then wonder why the live results diverge from the backtest.
Operational implications
The probability mindset translates into specific rules of thumb.
Do not change anything in the system based on fewer than 50 trades of new data. Below 50, the standard error of your estimate is too large for any change to be justified.
Do not increase position size after winning streaks or decrease after losing streaks. Position size should be a function of the distribution's properties, not the recent draw history.
Do not interpret a drawdown as evidence the system is broken until the drawdown is outside the 95th percentile of historical drawdowns for the system. Below that threshold, the drawdown is a normal sample. Above it, you have evidence to investigate.
Do report performance with confidence intervals, not point estimates. A backtest Sharpe of 1.2 with a 95% confidence interval of [0.6, 1.8] means something different from a backtest Sharpe of 1.2 with an interval of [1.1, 1.3]. The first is "the system might work." The second is "the system works."
Do think about every trade decision as expected value plus variance, not as a guess about direction. The signal carries predictive content. The single outcome carries close to none.
KEY POINTS
- A trade is a draw from a distribution. The distribution decides whether the system works. The single draw carries almost none of the information about the distribution.
- The expected value of a trade is E[X] = p·W − (1−p)·L. The standard deviation σ of trade returns runs 5x to 10x the absolute value of E[X] for most retail systems.
- The standard error of the mean shrinks as σ/√N. To halve uncertainty, you need four times the trades.
- One trade contains no information. 25 trades contain little. 200 trades contain enough to update on the system's edge.
- Adjusting parameters after a few losing trades, sitting out signals after streaks, and scaling up after wins are all responses to noise treated as signal.
- Monthly and quarterly returns for retail systems are dominated by noise. Do not interpret a negative month as a broken system unless the drawdown exceeds the 95th percentile of the system's historical drawdown distribution.
- Report performance with confidence intervals, not point estimates. A point Sharpe with no interval is a non-answer dressed up as one.
- Treat every trade as expected value plus variance. The signal carries predictive content. The single outcome carries close to none.
References
- Evidence-Based Technical Analysis - David Aronson (Amazon)
- Systematic Trading - Robert Carver (Amazon)
- Comparing Discretionary and Systematic Hedge Fund Performance
- Systematic Funds Outperform Discretionary Funds
- Systematic Hedge Fund Risk Management: An Overview
- Performance, Risk and Persistence of the CTA Industry: Systematic vs Discretionary Trading
- A Hybrid Systematic-Discretionary Channel Breakout Framework for Nasdaq E-mini Futures
- Dissecting Retail Investor Trading Tendencies
- A Comparative Analysis of Quantitative vs. Discretionary Strategies in Equity Markets
- Can Retail Investors Beat the Market by Using Technical Trading Rules?