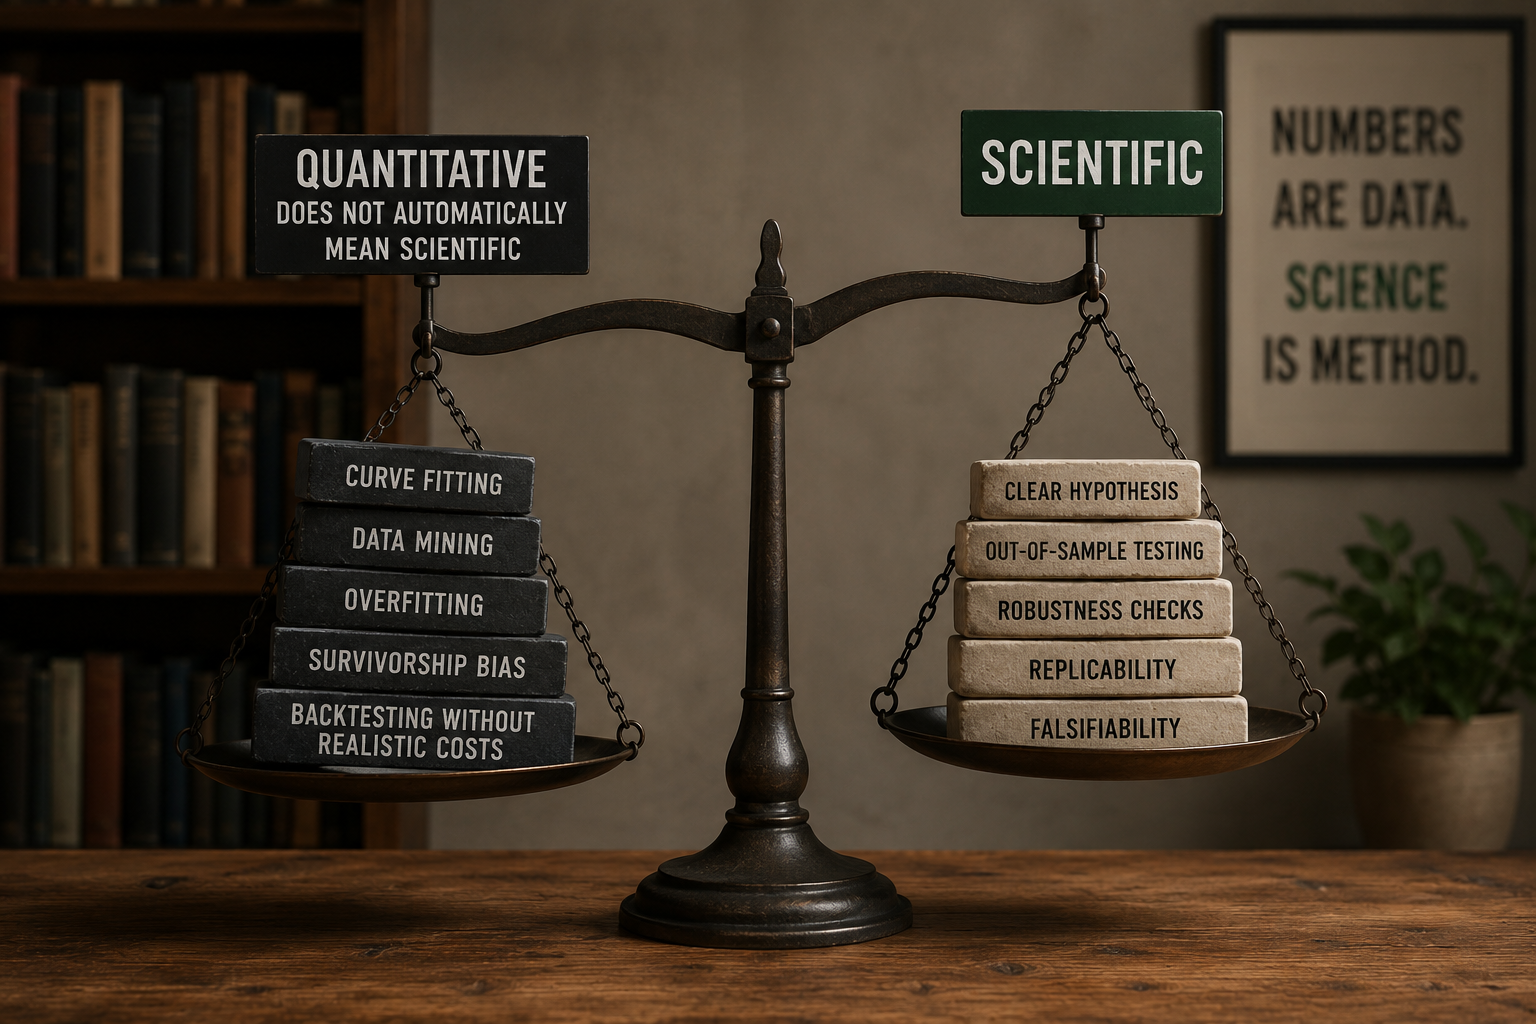
1.4 Why "Quantitative" Does Not Automatically Mean Scientific
Using math, code, or machine learning does not automatically make trading scientific. A strategy becomes scientific only when it is falsifiable, benchmarked, tested against a null hypothesis, and replicable. Most retail “quant” content fails all four.
A backtest in Python is not a scientific result. An equation is not a hypothesis, and a 90% win rate is not evidence. The aesthetics of math have become a marketing surface, and most retail quant content is decorative arithmetic wrapped around the same wishful thinking that lives in chart-pattern content.
Quantitative means using numbers. Scientific means something stronger. The two overlap, often by accident, but they are not the same set. A piece of trading content is scientific only if it satisfies four properties, and most quant-flavored content fails at least two of them.
The four properties
A trading claim is scientific when:
- It is stated as a falsifiable hypothesis. The claim has a specific prediction that can be wrong. "Going long the SPX 7 days after it crosses above the 200-day MA produces a positive return after costs" is falsifiable. "Markets move in cycles" is not.
- It is tested against a null hypothesis. The default assumption is that the claim has no edge. Evidence must clear a bar high enough to reject that default. Without an explicit null, every backtest result looks like edge, because random data with enough rules will produce a winning rule by luck alone.
- It is benchmarked. Performance is relative. A long-biased rule in an up-trending market has to outperform a random rule with the same long bias before the rule itself gets credit.
- It is replicable. Hand the same data, the same rules, and the same evaluation procedure to another person. They get the same numbers. If the procedure depends on hand-tuning or undocumented choices, replication breaks and so does the claim.
Math has nothing to do with any of this. You can satisfy all four properties with a hand calculator and a long evening. You can satisfy zero of them with a neural network and a CUDA cluster.
The standard failure modes
Walk through the standard retail quant post.
The opening shows an equity curve going up and to the right. Strong Sharpe. No mention of the null hypothesis the rule was tested against. Fail point one.
The methodology section describes the rule in prose. Three indicators, two thresholds, a stop, a trailing stop, a session filter. No statement of what would falsify the rule. A losing live year would prompt a re-optimization, not a retraction. Fail point two.
The backtest shows 42 trades over four years. Win rate 73%. Profit factor 2.8. No null benchmark. No bias-stripped comparison. The market spent most of those four years in an uptrend. The rule is long 80% of the time. The author claims edge. The market gave away the return. Fail point three.
There is no mention of how many parameter combinations were tested before this one. The reader has no way to estimate the data-mining bias. Fail point four.
Then comes the ML model. The author trains a gradient boosting machine on a feature set, reports a 0.6 AUC, calls it "predictive," and never out-of-samples it on the period after the model was built. Fail point five.
The post is quantitative in the sense that it uses numbers. It is not scientific in the sense that the numbers cannot tell you whether to risk capital on the rule.
The litmus test
A single question separates scientific quant work from decorative quant work.
State, before running the backtest, the exact result that would prove the rule wrong.
A scientific answer sounds like: "If the bootstrap-resampled p-value of the Sharpe ratio is above 0.10 against a bias-matched random benchmark on 1,000 trades, I reject the rule." That is a falsifiable claim. The data either clears the bar or does not.
A non-scientific answer sounds like: "I will look at the equity curve and see if it looks good." That is not a test. It is a vibe check.
Most retail quant content cannot answer the question because the author never set the bar before running the experiment. The bar gets set after the result is in, which is the same as having no bar.
Five anti-patterns dressed up as science
The retail quant ecosystem produces the same five mistakes on rotation.
The ex-post story. A rule worked. The author writes an explanation for why it worked. The explanation was not the hypothesis that generated the rule; the rule came from optimization and the story was retrofitted. Ex-post stories have no predictive content. They survive the past by construction. They do nothing for the future.
The benchmark-free backtest. A 0.05% daily edge looks impressive until you notice that the SPX delivers 0.035% per day with no rule attached. Most "edges" in long-biased equity strategies are 70% to 100% drift. Anything not compared to a bias-matched random benchmark is selling you the index.
The undocumented parameter sweep. The author tested one set of parameters. The post does not tell you what else was tested before that one. With 200 variants tried and the best one published, the displayed Sharpe is inflated by selection. Enough variants and any rule looks like a winner on the training set.
The single-sample claim. A backtest covers one path through one market history. The realized drawdown is one number from a distribution of possible drawdowns. Reporting only the realized one, without a Monte Carlo distribution or a bootstrap confidence interval, treats one sample as the population. It is not.
The complex model with no held-out window. Any sufficiently parameterized model fits its training data. The question is whether it generalizes. A model trained on 2015 to 2022, evaluated on 2023 to 2025, and reported with both numbers, is a real test. A model trained on 2015 to 2025 and reported only on 2015 to 2025 is a fitting exercise. Calling the second one "ML alpha" does not change what it is.
Requirements for a scientific result
A scientifically tested trading claim looks like five things together.
A hypothesis specified before the data is touched. The predicted relationship written down in advance: "the t-statistic of forward 5-day returns conditional on signal X exceeds 2.0 on the held-out set."
A null hypothesis specified at the same time. "The forward returns conditional on signal X are drawn from the same distribution as forward returns conditional on a bias-matched random signal."
A test statistic and a rejection threshold specified at the same time. P-value below 0.05, or an equivalent bootstrap-based threshold.
A held-out sample the model never saw and was not allowed to see during parameter selection.
A pre-registered count of candidate rules tested, so the multiple-testing correction can be applied.
If any of these five are missing, the claim is not a scientific result. It is at best a hypothesis worth testing. At worst it is a curve-fit dressed as evidence.
Stakes for retail traders
Retail traders allocate capital based on quant-flavored content. The cost of confusing decorative math with scientific evidence shows up in the account, not in the blog post.
Two practical moves follow.
First, run the litmus test on quant content you read. If you cannot find an ex-ante hypothesis, a null benchmark, and a statement of what would have proven the rule wrong, treat the equity curve as marketing rather than evidence. The author is selling. You are buying. Price it as marketing.
Second, run the same protocol on your own systems. Write the hypothesis, the null, the rejection threshold, and the held-out window down before the backtest runs. Commit them to a file with a timestamp. The discipline costs nothing. The version of you that wants to move the bar after seeing the result will find the bar pre-committed.
Quantitative finance is not a synonym for scientific finance. The math is the easy part. The structure that makes the math mean something is the work.
KEY POINTS
- Quantitative means using numbers. Scientific means falsifiable, null-tested, benchmarked, and replicable. The two overlap by accident.
- A trading claim is scientific when it states what would prove it wrong before the data is touched.
- An equity curve without a null benchmark is marketing, not evidence.
- An ex-post story is not a hypothesis. The story has to come before the data, not after.
- Long-biased rules in up-trending markets capture drift for free. Bias-strip every return before claiming edge.
- An undocumented parameter sweep inflates Sharpe through selection. Report the candidate count, not just the winner.
- A single backtest is one sample from a distribution. Confidence intervals and Monte Carlo paths are required, not optional.
- A complex model without a held-out window is a fitting exercise. ML changes nothing about that.
- Pre-commit the hypothesis, the null, the rejection threshold, and the held-out window in writing before the backtest runs. Timestamp the file.
References
- Evidence-Based Technical Analysis - David Aronson (Amazon)
- Systematic Trading - Robert Carver (Amazon)
- A Comprehensive Review of Statistical Methods in Quantitative Finance
- Spurious Predictability in Financial Machine Learning
- Technical Analysis: Evidence-Based Technical Analysis: Applying the Scientific Method and Statistical Inference to Trading Signals
- 151 Trading Strategies
- The Power Of Price Action Reading
- Quantitative Trading, Discretionary Trading, Hedge Funds, Market Efficiency, and the Future of Financial Markets
- A Momentum-Gated Hierarchical Optimisation Framework for
- 1 Hypothesis Testing Ordinary Meaning Daniel Keller – Northern