5.5 Why Forecast Accuracy Is Not Enough in Market Making
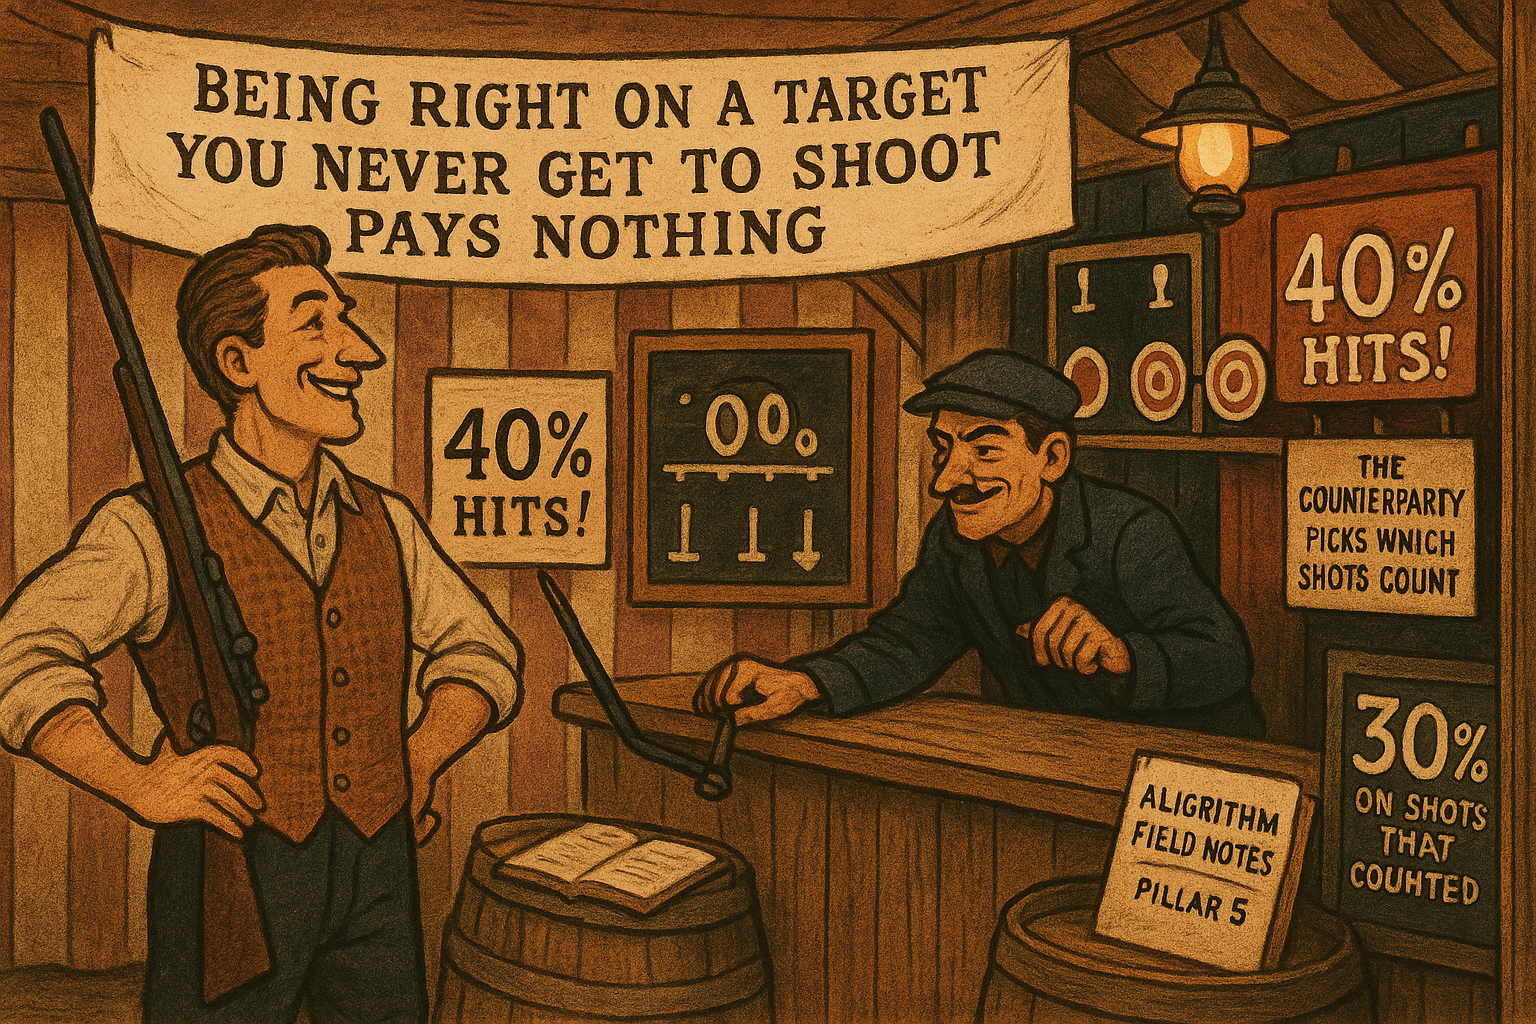
A maker's forecast is graded only on the fills it gets, and counterparties hand you the adverse ones. A 40% model across all moves can be a 30% model on the trades you actually make.
A taker who builds a price forecast measures it the obvious way: R-squared, mean squared error, directional accuracy across all the moves in the sample. A higher number is a better forecast. For a market maker that scoring is not just incomplete, it is measuring the wrong sample, and a model that looks excellent by it can lose money in production. The reason is brutal and simple: most of the moves your forecast gets right are moves you will never get filled on.
This article is the warning that "Why Fair Value Is the Core of Market Making" deferred. It changes what "a good forecast" means once the forecast is attached to passive quotes rather than aggressive orders.
The fill is conditional, and the conditioning is adverse
A taker who likes a forecast crosses the spread and gets the trade. A maker posts a quote and waits, and whether the quote fills is decided by someone else, the trader who chooses to hit it. That someone tends to hit you precisely when they think the price is about to move against your fill. The fills you get are not a random sample of the moves your model predicted. They are a sample selected by counterparties to be the ones where you are wrong.
So the relevant accuracy is not your accuracy across all moves. It is your accuracy conditional on getting filled, and the conditioning event is hostile. Optimizing R-squared over the full distribution optimizes performance on a population you mostly do not trade, while ignoring the population you do.
The arithmetic of conditional accuracy
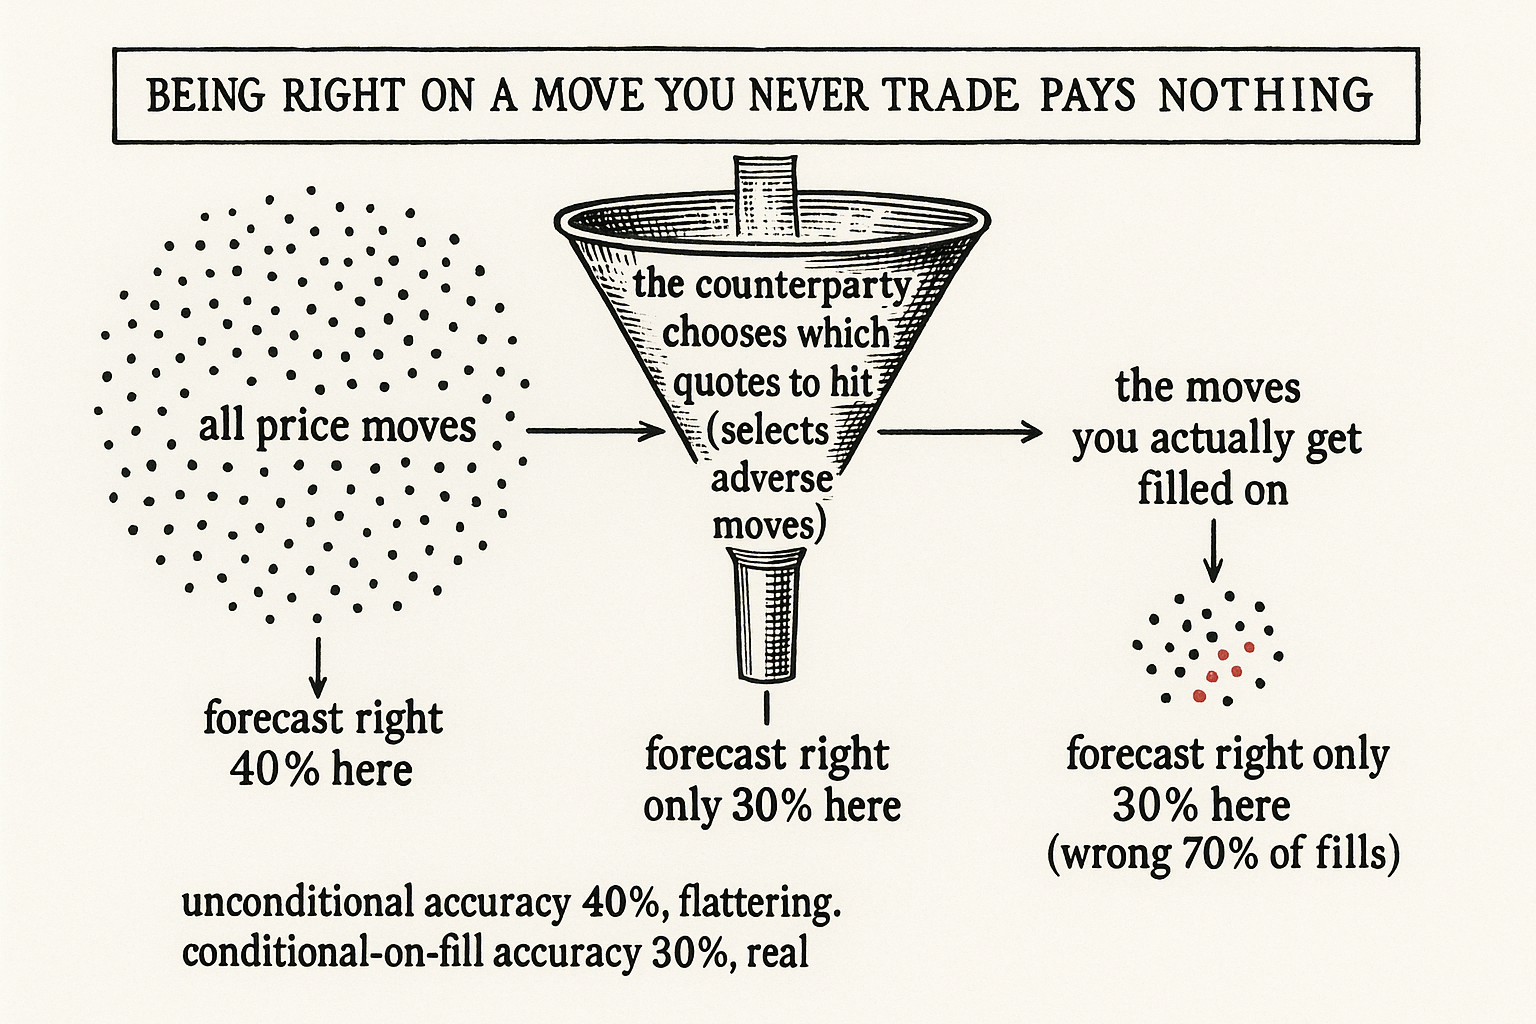
Put numbers on it. Suppose your forecast is right 40% of the time across all moves, which sounds like a real edge for a directional model. Now look only at the fills you actually get. On those fills, the forecast is wrong 70% of the time, because the people hitting you selected the adverse ones.
$$ \text{accuracy}_{\text{unconditional}} = 40\%, \qquad \text{accuracy}_{\text{on fills}} = 100\% - 70\% = 30\% $$
Your real accuracy is 30%, not 40%, because being right on a move you never traded pays nothing. The full-sample number flattered you by ten points, and those ten points were exactly the moves you missed. A forecast that scores worse on R-squared but is right more often on the fills it actually receives is the better market making forecast, full stop.
What to optimize instead
Two changes follow. First, score the forecast on the conditional sample. Simulate or record which quotes would have filled, and evaluate accuracy and markout on that subset alone. The markout, the change in price after a fill from "Markouts: The Truth Serum of Market Making", is the natural objective here because it is already conditioned on fills by construction. A forecast that produces good average markouts is by definition right on the moves you trade.
Second, build forecasts you get filled into, not forecasts that are merely correct. The goal is a model whose predictions line up with the conditions under which your quotes actually trade, even at the cost of being blind to large moves you would never have caught passively anyway.
Blending horizons by their markout curves
A practical consequence: you usually run several forecasts on different horizons, and you blend them by their markout contribution per unit time rather than by their headline accuracy. Take each forecast's markout curve, its edge measured second by second after a fill, and average the curves.
A worked blend: one forecast carries 2 bps of edge but only fires on moves of at least 30 bps, which over a one-minute horizon averages to roughly 0.5 bps per second of usable edge; another forecast contributes around 2 bps per second on the first parcel of the move. Layer them and you stack many forecast horizons into one quoting decision, each weighted by the edge it delivers on fills per second rather than by how well it fits the full sample. The headline accuracy of any single model is not the input. The per-second markout it earns on real fills is.
Visualizing the conditional sample
KEY POINTS
- Takers score a forecast on R-squared, MSE, or accuracy across all moves. For a maker that scores the wrong sample, because most moves you predict correctly are moves you never get filled on.
- A maker's fills are not a random sample. The counterparty chooses to hit you when the price is about to move against your fill, so the fills you receive are selected to be the adverse ones.
- The relevant metric is accuracy conditional on getting filled, and the conditioning event is hostile. Optimizing full-sample R-squared optimizes a population you do not trade.
- Worked example: 40% accuracy across all moves can become 30% on the fills you actually get when the forecast is wrong 70% of the time on those fills. The ten-point gap is the moves you missed.
- Score forecasts on the conditional (filled) sample, and use markout as the objective since it is already conditioned on fills by construction.
- Build forecasts you get filled into, not forecasts that are merely correct across the full distribution, even at the cost of missing large moves you would never catch passively.
- Blend multiple-horizon forecasts by their markout edge per second on real fills, not by headline accuracy. A 2 bps edge that fires only on 30 bps moves averages to about 0.5 bps/sec over a minute.
References
- The Art of Currency Trading - Brent Donnelly (Amazon)
- Navigating the Fill Probability vs. Post-Fill Returns Trade-Off
- Optimal High-Frequency Trading in a Pro-Rata Microstructure with Predictive Information
- Market Making with Fads, Informed, and Uninformed Traders
- Short-Horizon Excess Returns in Liquid Equities
- Market Simulation under Adverse Selection - arXiv
- Integrating Tick-level Data and Periodical Signal for High-frequency
- Deep Limit Order Book Forecasting A microstructural guide - arXiv
- Optimal Quoting under Adverse Selection and Price Reading - arXiv
- High-Frequency Market Making: Liquidity Provision, Adverse Selection, and Competition
- High frequency market making: The role of speed
- Market Simulation under Adverse Selection
- Navigating the Fill Probability vs. Post-Fill Returns Trade-Off
- The Impact of Market Informedness on Market Makers' Profitability
- Event-Based Limit Order Book Simulation under a Neural Hawkes Process: Application in Market-Making
- Market Making with Deep Reinforcement Learning from Limit Order Books
- When AI Trading Agents Compete: Adverse Selection of Meta ... - arXiv
A note on AI. The ideas, research, analysis, and conclusions in this article are my own. I use AI tools to help with editing and wordsmithing, because English is not my first language, and I am not shy about that. AI-generated ideas and AI-assisted writing are not the same thing: the first is empty slop from a generic prompt, the second is a tool for communicating years of real research more clearly. Judge the work by its substance, not by whether software helped polish the prose.