6.5 When an Alpha Metric Is U-Shaped
Ranking assumes more-of-the-metric means more return. When the metric is U-shaped, both extremes are good and a naive rank buys the worst names. Plot the shape, then fold it monotone before you sort.
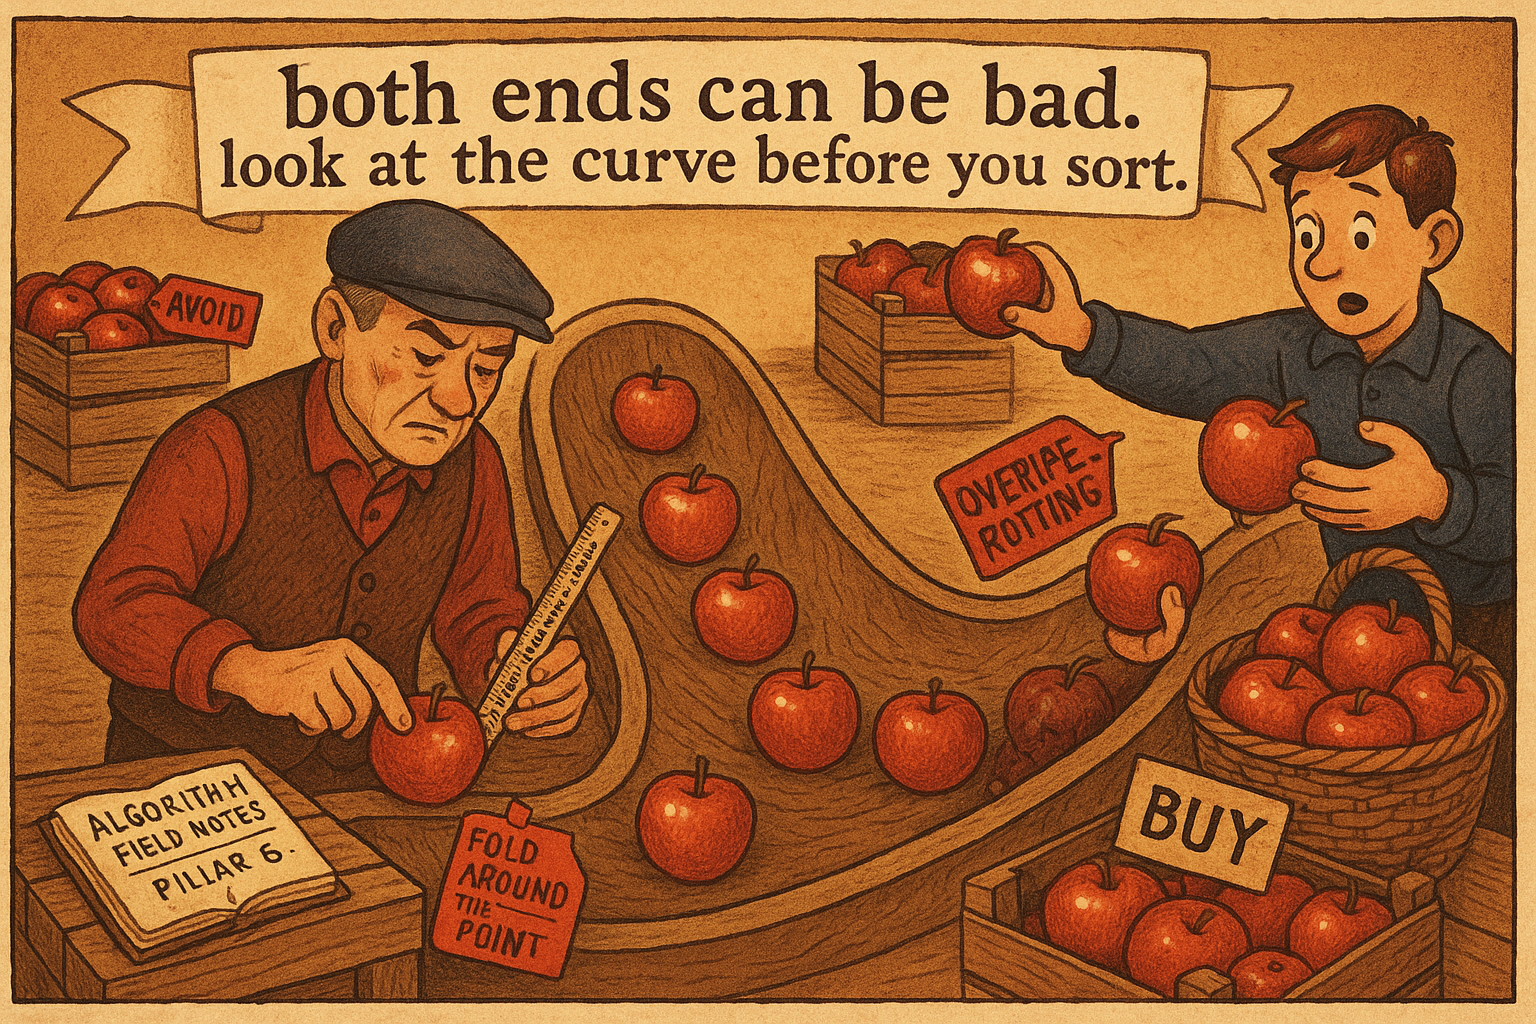
Ranking assumes your signal is monotone: more of the metric means more expected return, all the way up. Sort by it, buy the top, short the bottom, done. That assumption is a trap, because plenty of real signals are not monotone at all. Some are U-shaped, where both extremes predict the same thing and the middle predicts the opposite, and if you feed a U-shaped metric into a linear ranking you will systematically buy the worst names and call it alpha. "Ranked Long/Short Systems Explained" took monotonicity for granted; this is what you check before you trust it.
The shape you assume versus the shape you have
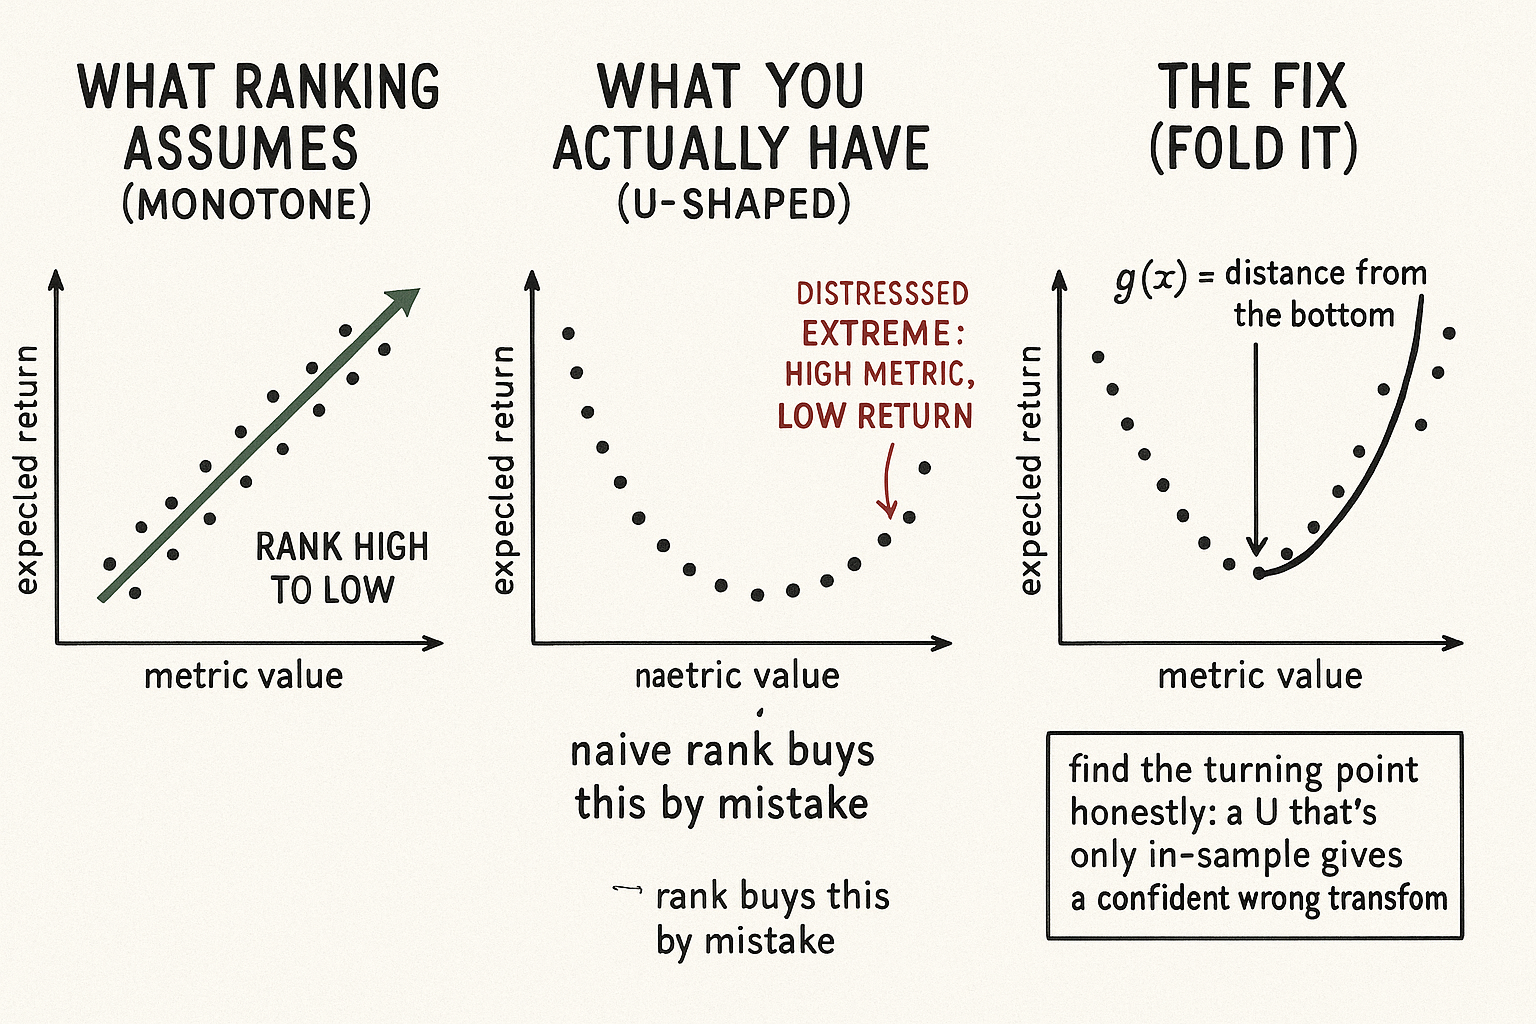
A monotone alpha metric draws a straight-ish upward line: low metric, low return; high metric, high return. Ranking is the right tool because the order of the metric is the order of expected return. A U-shaped metric draws a valley: the lowest values and the highest values both sit at high expected return, and the middle sits at low expected return. Value can look like this. A moderately cheap stock outperforms, but the very cheapest names are often cheap because they are distressed, so the relationship bends back down at the extreme and the deepest-value bucket underperforms the merely-cheap one. Volatility can look like this too, and so can many sentiment and flow metrics where both crowding extremes mean something and the middle is noise.
Rank a U-shaped metric naively and the system does exactly the wrong thing at one end. It puts the distressed extreme in your long slice because the raw metric is highest there, when that extreme is the part you wanted to avoid. The ranking is faithfully sorting a number whose relationship to return reverses inside the range, so the top of your sort is a mix of genuine alpha and a pocket of names that predict the opposite.
See the shape before you rank
The discipline is to plot expected return against the metric before assuming a direction, in buckets. Slice the universe into deciles of the raw metric, compute the realized forward return in each decile, and look at the shape. A clean upward staircase says monotone, rank away. A valley says U-shaped, and a naive rank is broken. A hump (inverted U) says the middle is best and both extremes are bad, which breaks ranking the other way. You cannot know which case you are in from the name of the signal; you have to look, and the bucket plot is the cheapest way to look.
Folding the metric back into something monotone
Once you see a U, the fix is to transform the metric so it becomes monotone in expected return again.
$$ g(x) = |x - x^*| \quad\text{where } x^* = \arg\min_x \, \mathbb{E}[\,\text{return} \mid x\,] $$
If the expected return is lowest at some interior value and rises toward both ends, fold the metric around that low point by taking the distance from it. The transformed metric is now monotone, both extremes map to a large value, the dead middle maps to a small value, and ranking on it puts the genuinely high-return names at the top. For a hump you flip the sign, ranking on negative distance from the peak. The transform is the operational repair: you keep the ranking machinery, you just feed it a metric that actually increases with expected return instead of one that bends. Estimate the turning point carefully, because a turning point fit to noise is one more way to overfit, and a U that only exists in-sample will hand you a confident, wrong transform.
Visualizing the U-shape
KEY POINTS
- Ranking assumes the metric is monotone in expected return. Many real signals are not, and a U-shaped metric, where both extremes are high-return and the middle is low, breaks the assumption.
- Feed a U-shaped metric into a linear ranking and it buys the wrong extreme. The distressed deep-value or deep-vol names sit at the top of the raw sort while predicting the opposite of what you want.
- Examples: value bends back down at the distressed extreme, and volatility, sentiment, and flow metrics often carry information at both crowding extremes with a noisy middle.
- See the shape before ranking. Bucket the universe into deciles of the raw metric, plot realized forward return per decile, and look. An upward staircase is monotone; a valley is U-shaped; a hump is inverted.
- Fix a U by folding the metric around its turning point, ranking on distance from the low point so both extremes map high and the dead middle maps low. Flip the sign for a hump.
- Estimate the turning point honestly. A U that exists only in-sample hands you a confident, wrong transform, so treat the fold as another place overfitting hides.
References
- Systematic Trading - Robert Carver (Amazon)
- Trading Systems - Urban Jaekle Emilio Tomasini (Amazon)
- The Carry Trade: Risks and Drawdowns
- Trade Sizing Techniques for Drawdown and Tail Risk Control
- AlphaCrafter: A Full-Stack Multi-Agent Framework for Cross ... - arXiv
- Signature Decomposition Method Applying to Pair Trading - arXiv
- Monotonic warpings for additive and deep Gaussian processes - arXiv
- Spurious Predictability in Financial Machine Learning - arXiv
- Doubly Robust Meta-Learners for Ratio-Based Treatment Effects
- FACTOR INVESTING AND ASSET ALLOCATION
- Volatility-Managed Portfolios
- The Impact of Volatility Targeting
- Target Volatility: Are there Benefits for Domestic and International Equity Investors?
- Tail Risk Targeting: Target VaR and CVaR Strategies
- Refining Portfolio Construction When Alphas and Risk Factors are Misaligned
- Regime-Aware Statistical Arbitrage
- U-Shaped Returns and Long–Short Profits from Market Order Imbalance
- QUANTS AND MARKET EFFICIENCY
A note on AI. The ideas, research, analysis, and conclusions in this article are my own. I use AI tools to help with editing and wordsmithing, because English is not my first language, and I am not shy about that. AI-generated ideas and AI-assisted writing are not the same thing: the first is empty slop from a generic prompt, the second is a tool for communicating years of real research more clearly. Judge the work by its substance, not by whether software helped polish the prose.