3.38 The Signal Ceiling: Why No Single-Bar OHLCV Edge Beats Costs in MNQ
Fourteen popular intraday MNQ setups, 947 days, one honest test. Zero cleared costs. The gross edge tops out near 1.5 points and two points of friction eats it. The signal ceiling is real.
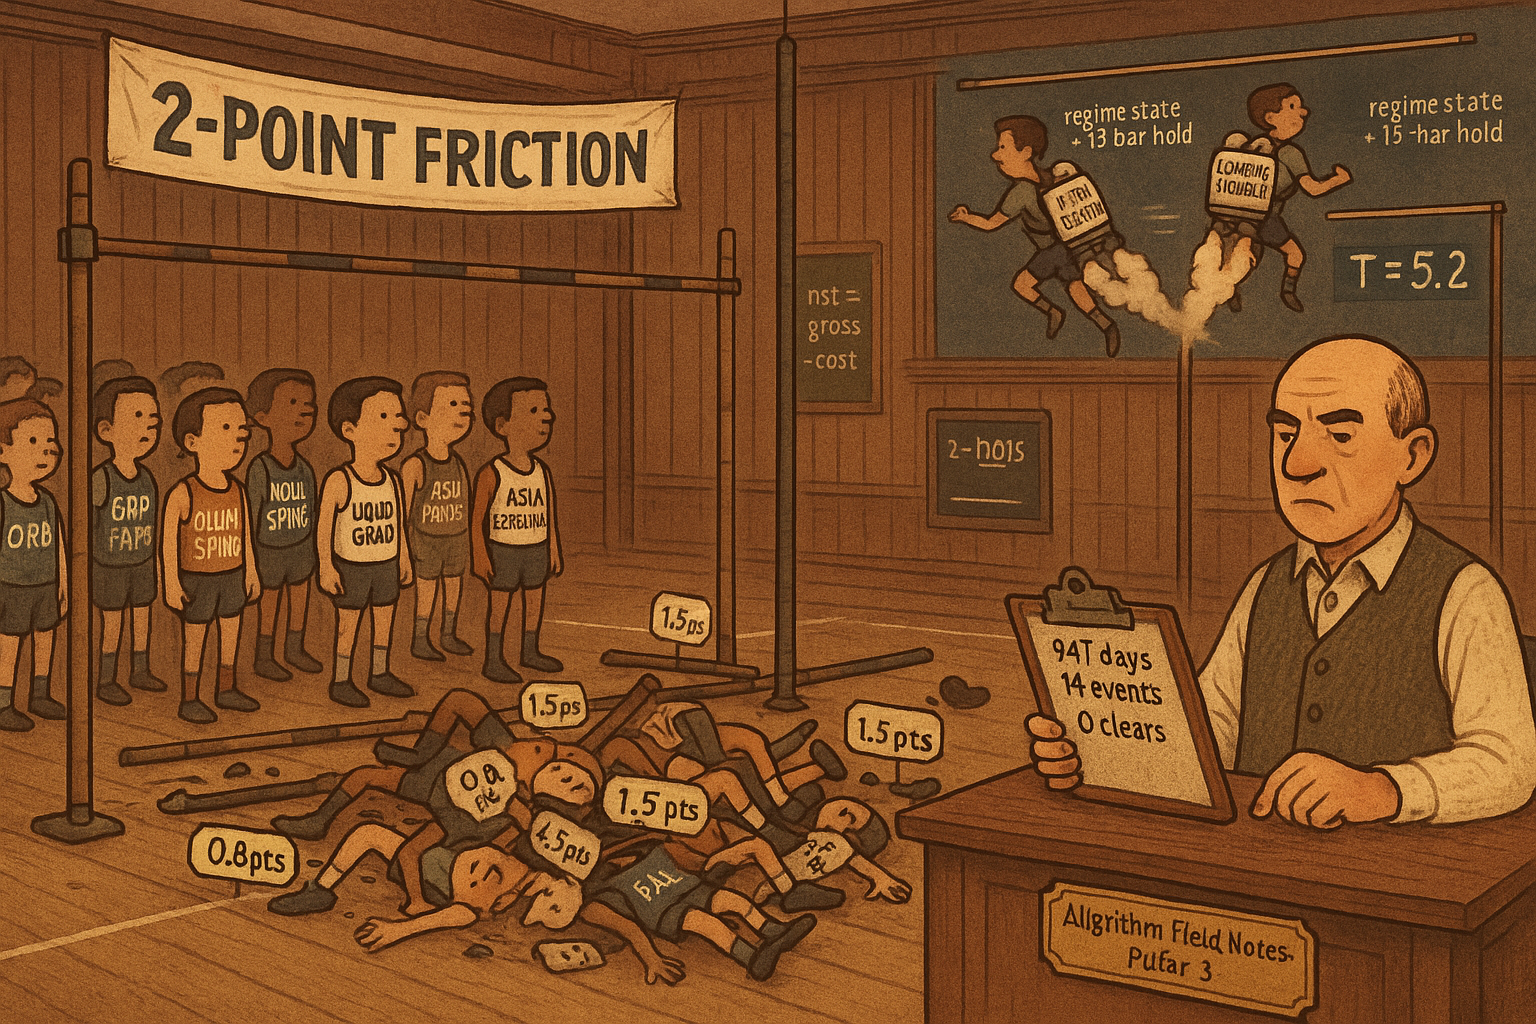
Open any retail futures forum and you will find the same fourteen setups traded as gospel: the opening range breakout, the gap fade, the gap continuation, the volume spike, the liquidity grab reversal, the Asia session expansion. Each comes with a chart, a win rate, and a story about why it works. Mathias Mesfin took the whole list, wired it to a bar-close signal and next-bar-open fill on Micro E-Mini Nasdaq futures, and ran it across 947 trading days of five-minute data. Fourteen signal families. Zero survived a serious test. Not one cleared a T-statistic of 2.0 out of sample with enough trades to trust and a positive return after two points of cost.
That is not a bad backtest. That is the answer. This is the article the whole robustness pillar has been building toward, so read the null result as the finding, not the disappointment. The old article "The Backtest Integrity Checklist" gave you the 32 items a strategy has to pass before deployment. This article shows what happens when you run an honest gauntlet against the most popular intraday patterns on one of the most liquid instruments a retail trader can touch. They die, and they die for a reason with a number attached.
The setup that makes the test honest
Start with the data because the design is where most retail backtests already lost. The primary dataset is 72,604 five-minute OHLCV bars for MNQ continuous front-month futures, regular trading hours only, 09:30 to 16:00 ET, December 2021 through August 2025. After dropping partial days and session-boundary junk, 947 clean trading days remain. A second instrument, Micro Gold (MGC), gets 1,091 days for a cross-instrument check.
Two design choices carry the whole study. First, every signal is computed at bar close, and every entry fills at the open of the next bar. No signal touches the bar it fires on for its entry price. That single rule kills same-bar fill bias, the quiet lookahead that inflates most retail results, where the "entry" secretly happens at a price you could never have gotten. Second, a fixed two-point round-trip friction cost hits every MNQ trade, about $4.00 per micro contract, covering the bid-ask spread, exchange fees, and conservative slippage. In high-volatility windows where the MNQ spread widens to two ticks or more, two points understates the real cost, so the assumption leans generous to the strategies, not to the conclusion.
Parameter selection runs on an expanding walk-forward: train on 2022 and test on 2023, then train on 2022 to 2023 and test on 2024, then train on 2022 to 2024 and test on 2025. The test window is never touched until the final scoring step. The old article "CSCV: A Direct Probability of Backtest Overfit" showed why a single in-sample-best pick lies to you about capacity. Walk-forward is the cheaper defense: you never let future data choose your parameters, so the out-of-sample number is a genuine estimate instead of a flattering one.
The five-gate gauntlet
A signal passes only if it clears all five criteria at once. Clearing four is a fail.
| Criterion | Threshold | Why it is there |
|---|---|---|
| T-statistic | T >= 2.0, out-of-sample only | Minimum statistical significance; in-sample T-stats count as zero evidence |
| Trade count | N >= 30, out-of-sample | Below 30 trades the variance is too wide for any inference |
| Net return | Positive after 2-pt friction | Gross edge is not economic edge; costs come out first |
| Year stability | Consistent across all years | A single good year is treated as a fluke until proven otherwise |
| Permutation test | p < 0.05 where applicable | Confirms the result is not a random-sequence artifact |
The permutation gate is the same idea from the old article "Permutation Tests for Indicator Significance": shuffle the labels, rebuild the null distribution, and ask whether the observed edge sits outside what randomness produces. The trade-count floor of 30 echoes the old article "The Trade-Frequency Floor: Choosing a Threshold Honestly," where tightening a rule until it fires ten glorious times is how you manufacture a profit factor out of luck. These gates are deliberately harsh. In a market as competitive as MNQ, the prior probability that free OHLCV data hides a deployable edge is low, so a loose bar would just print false positives.
The body count
Fourteen families, run through the gauntlet. The verdicts, in net T-statistic terms, look like this.
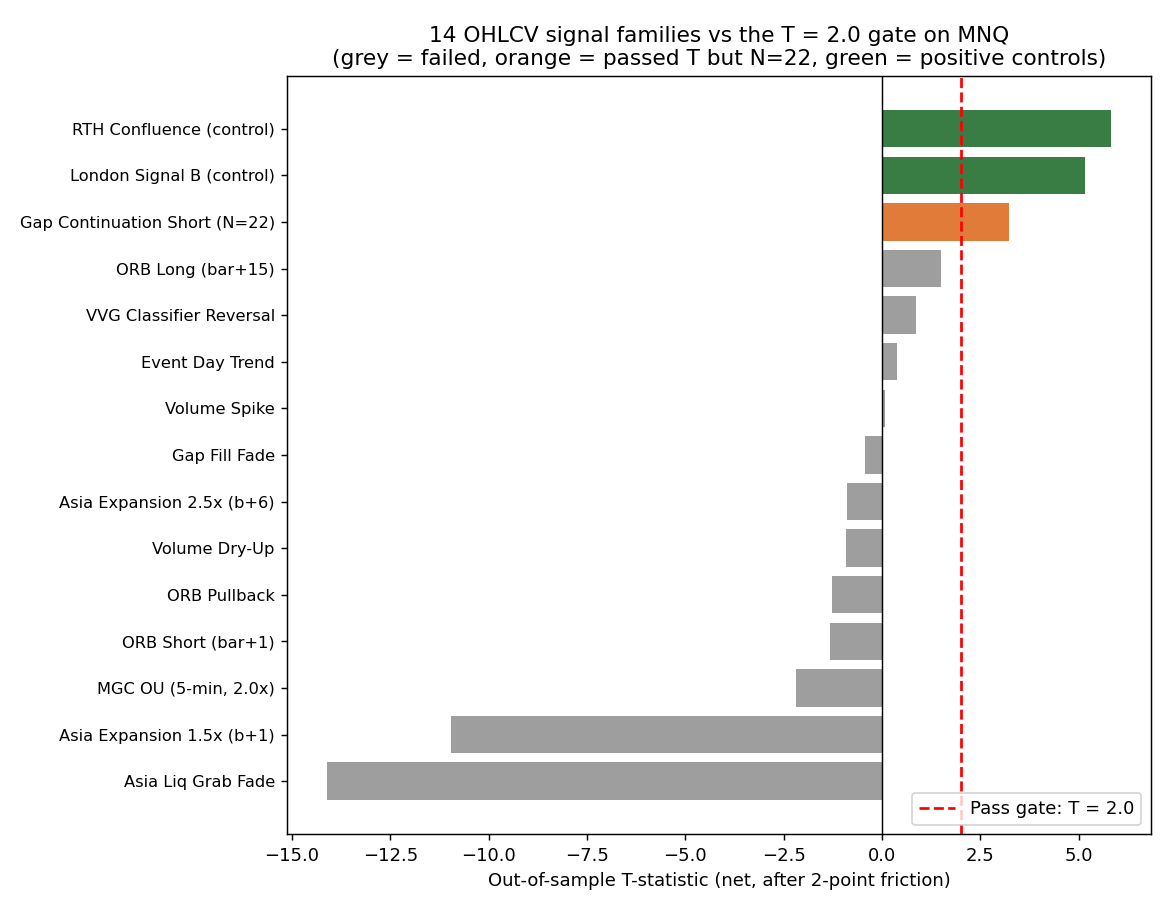
Walk the list. The opening range breakout, immediate entry, produces a net T of 1.17 long and negative short. Stretch the hold to fifteen bars and the long breakout climbs to T = 1.50, the best of the genuine OHLCV signals, still short of the gate. The pullback-entry variant, waiting for price to retrace to within five points of the breakout before entering, stops out 80.7% of the time at a twenty-point stop and returns net -4.44 at T = -1.27. In MNQ a large share of breakouts fail and reverse, so the pullback entry is systematically wrong, not merely weak.
The Asia session expansion signal is worse than useless, and instructive about why. Fading nothing, just trading continuation on bars whose range exceeds 1.5x the rolling mean, gives T = -10.96 at the next bar. That is one of the strongest directional results in the entire study, pointing the wrong way. The expansion burst is real, but it lives and dies inside the expansion bar. By the time the bar closes, the signal fires, and you fill at the next open, the move is spent, and you are buying the top of a spike that is already reversing. The liquidity grab reversal has the same disease: 6,442 events, fade direction net -2.20 at T = -14.12, continuation direction net -1.80 at T = -13.24. Both directions lose. The signal carries 0.20 to 0.80 points of real directional content, and friction of two points eats it whole regardless of which way you lean.
Gaps split into two hypotheses and both fail. The gap fill fade, betting overnight gaps close during RTH, returns net -1.31 to -2.24 across entry times at 09:30, 09:45, and 10:00, with T-stats of -0.32 to -0.59, indistinguishable from noise. MNQ gaps do not reliably fill. Volume tells the same null: the volume spike momentum signal on 2,119 up-spike bars returns T = +0.07, and the down-spike variant on 2,409 bars returns T = -0.64. With samples over two thousand trades, those near-zero T-stats are precise estimates of nothing, not small-sample scatter. Volume magnitude at the bar level does not predict next-bar direction. The volatility-volume-gap classifier fires on 4.4% of days and flags genuinely distinct behavior, a 25.6 basis point next-day return spread and a 77.6% peak-reversal rate, but every directional rule built on it fails the gauntlet. Event-day trend on 993 high-impact releases dies because the drift is fully contained in bars one to five, the news spike itself; measured from bar six, T sits between 0.14 and 0.69, and the two biggest releases (NFP and CPI at 08:30 ET) are outside RTH prop-firm rules anyway. Even the cross-instrument check fails: Ornstein-Uhlenbeck mean reversion on MGC gold returns T = -4.49 at the tightest threshold, and the 60-minute version has an 7.85-bar half-life that overruns a single session.
The gross edge ceiling
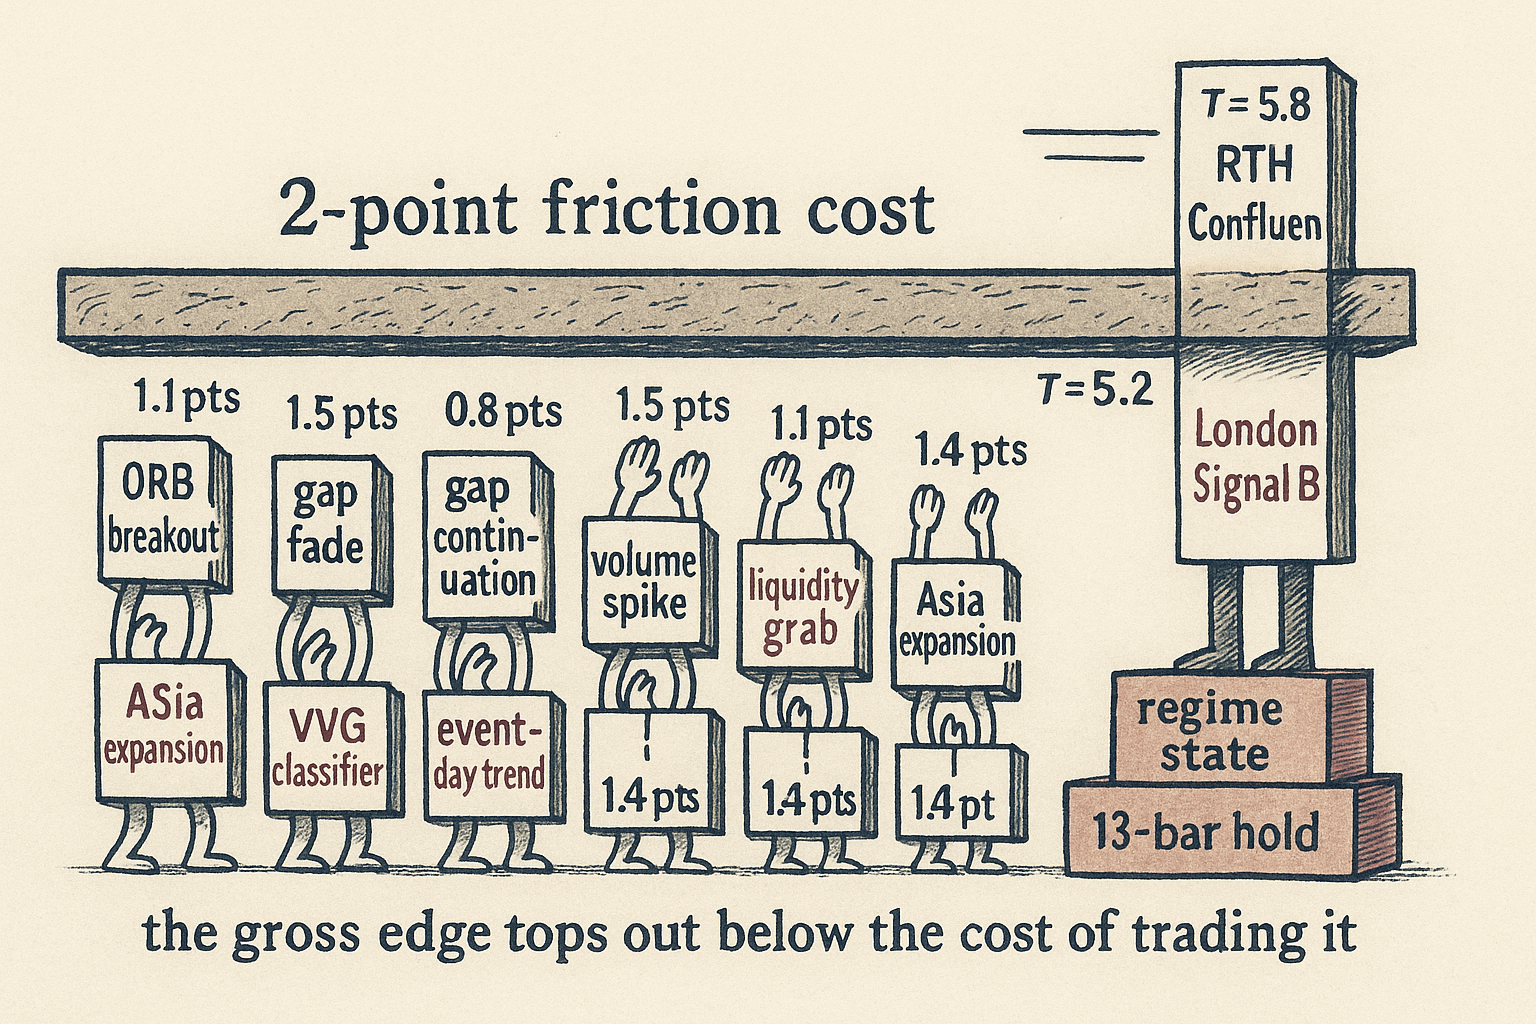
Strip out the friction and look at the raw directional content, because that is where the structural finding lives. Across all fourteen families, the best gross return per trade at the most favorable horizon lands between roughly 1.05 and 1.50 points for the signals that trade often enough and consistently enough to count. The round-trip friction is 2.0 points. The math is not subtle.
$$ \text{Net}_{\text{trade}} = \text{Gross}_{\text{trade}} - \text{Friction}_{\text{round-trip}} $$
Net per trade is the gross directional move the signal captures minus the cost of getting in and out once. Work a real one: the fifteen-bar ORB long, the best-behaved OHLCV signal in the study, captures +4.82 points gross at its best horizon. Subtract two points of friction and you keep +2.82 net. That sounds fine until you remember it still fails, because 2.82 net across 447 trades only produces T = 1.50, and the year split (net -1.3 in 2022, +4.5 in 2023, +2.3 in 2024) shows the pooled positive number leans on one strong year. Now run the same subtraction on a signal near the true ceiling: the Asia expansion 2.5x captures +1.06 gross, and 1.06 minus 2.0 is -0.94 net. Negative before you account for anything else. Most of the fourteen families sit right there, with a gross edge smaller than the cost of trading it.
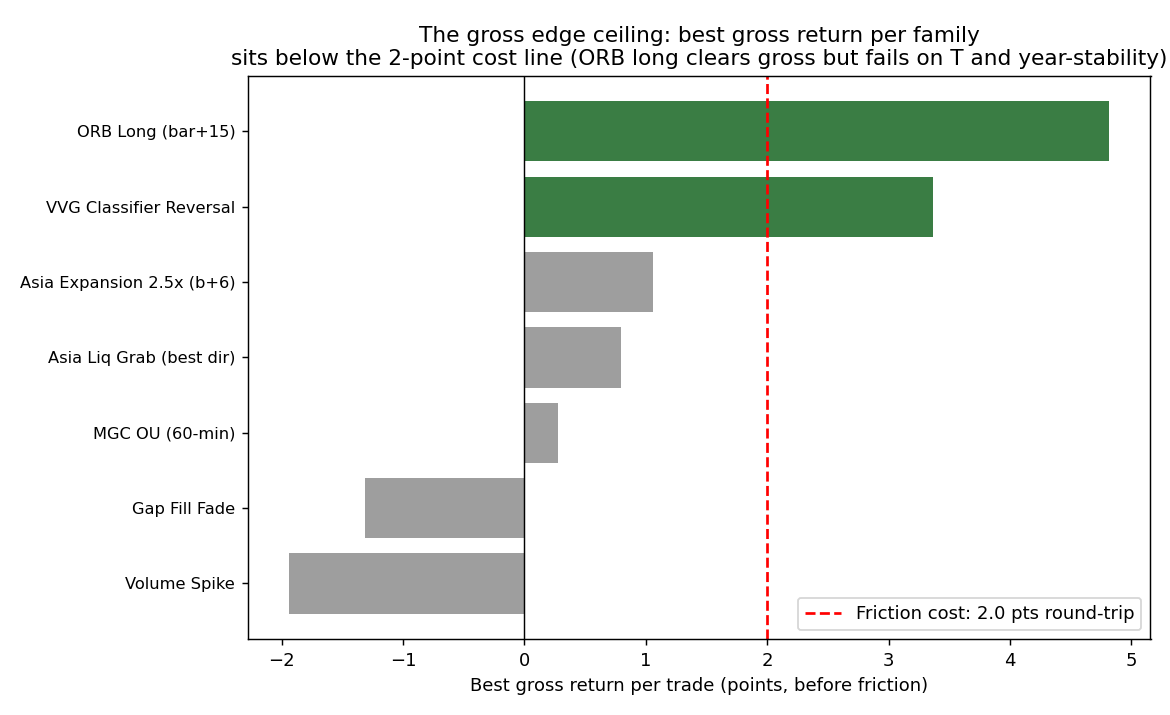
Two bars in that chart clear the friction line, and both are traps the gauntlet catches. ORB long at +4.82 gross fails on T and year-stability, as above. The gap continuation short prints +16.52 gross and +14.52 net at T = 3.23, the single most tempting result in the paper, and it dies on the trade-count floor: 22 trades across three years, twelve in 2022, six in 2023, four in 2024, a signal decaying toward extinction. That is exactly the failure mode the old article "The Trade-Frequency Floor: Choosing a Threshold Honestly" warned about, a gorgeous T-stat resting on a sample too thin to bet on and shrinking every year.
Why does the ceiling sit near the friction cost instead of somewhere higher or lower? Competition sets it. MNQ is one of the most heavily traded futures on earth. Any OHLCV-visible pattern that predicts next-bar direction is an arbitrage that faster participants with lower costs will trade until the gross edge shrinks to roughly the friction cost of the marginal player. For a retail-accessible instrument that clearing level lands around one to two points gross on five-minute bars. The market does not leave a free point on the table for a signal every forum already knows.
Why the trade-count floor is not optional
The gauntlet's second gate, thirty trades minimum, is the one traders resent most, because it kills their prettiest signals. The T-statistic is why it cannot bend.
$$ T = \frac{\bar{x}_{\text{net}}}{s_{\text{net}}} \times \sqrt{N} $$
The T-statistic is the mean net return per trade divided by the standard deviation of net returns, scaled by the square root of the trade count. The mean over the standard deviation is the per-trade signal-to-noise; the square-root-of-N term is how much you trust it after seeing N samples. Push the gap continuation short through it. Mean net is +14.52 and T is 3.23 on 22 trades, so the standard deviation implied is 14.52 times the square root of 22 divided by 3.23, about 21.1 points. A per-trade edge of 14.52 against a swing of 21.1 is genuine, but the square root of 22 is only 4.69, so the sample barely lifts it over the line. Add a handful of losing trades from a fourth year and that T collapses. The square-root scaling is unforgiving in both directions: it means a real edge needs volume to prove itself, and it means a thin sample can fake significance until the next drawdown arrives. Thirty is the floor because below it the standard error on the Sharpe and the T is too wide to separate skill from a good run.
Instability is the real killer
One pattern shows up again and again once you split the results by year. A signal looks alive because a single strong year drags the pooled number positive, while the other years sit flat or negative.
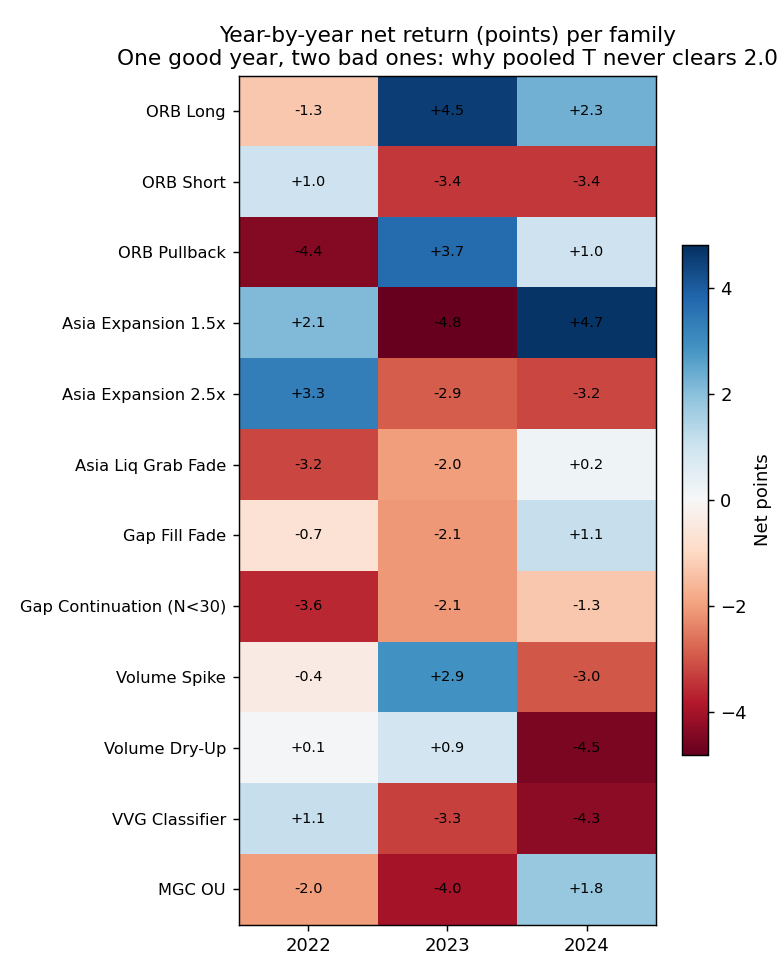
Read the ORB long row: net -1.3 in 2022, +4.5 in 2023, +2.3 in 2024. The 2023 and 2024 numbers look tradeable in isolation, and a researcher who ran 2024 alone would report T = 2.07 with +9.14 net on the VVG continuation strategy and call it an edge. The full picture undoes it: that same VVG rule prints -9.51 in 2022 and a weak 2023, so the pooled result is noise wearing a good year as a costume. The heatmap is a field of red and blue with no column that stays one color, which is the visual signature of a market whose behavior shifts regime to regime rather than a durable structural effect. This is the single most common reason a signal fails the gauntlet, and it is invisible to anyone who reports one aggregate number.
The controls that prove the harness works
A falsification study has an obvious failure mode of its own: maybe the test is so strict it rejects everything, edge or not. So the paper plants two known-good signals as positive controls, the same move a lab runs when it spikes a sample with a substance it knows the assay should detect. The RTH Confluence signal returns mean net +15.77 points at T = 5.83 on 538 trades, with a walk-forward out-of-sample T of 3.11. London Session Signal B returns net +5.77 at T = 5.15 on 289 trades, profit factor 2.42. Both clear all five gates with T-stats near three times the threshold, which proves the gauntlet accepts real edge and rejects the rest.
What separates the survivors from the fourteen corpses is the interesting part. The controls do not trade single-bar price patterns. They fire on regime classification, a GMM label plus a Markov transition probability plus a volume z-score, and they hold for twelve to fifteen bars, sixty to seventy-five minutes, not one to six. That longer hold lets a structural state transition accumulate enough points to clear friction, where a single-bar breakout never can. The ceiling applies to single-bar directional guesses from features every participant can see. It does not apply to slower, structural signals that read market state instead of the last candle.
What this means if you trade the forum playbook
The uncomfortable read for a retail trader: if your intraday MNQ strategy fires on a bar-close pattern and holds for a few bars, the study says your gross edge is too small to survive the cost of trading it, and the backtest that told you otherwise probably leaned on one of four confounds. It filled at bid-mid or some price you could not get. It skipped the full round-trip cost. It optimized on in-sample data that will not generalize. Or it reported the one winner out of a pile of tests and buried the losers, the survivorship bias the old article "The Backtest Integrity Checklist" spends whole sections guarding against. The paper's whole value is that it logged every rejection instead of publishing only the survivor.
None of this proves MNQ has no intraday edge. It proves a narrower, sharper thing: single-bar directional signals from public OHLCV features do not clear costs at five-minute resolution on this instrument under honest execution. Edge above the ceiling exists, but it lives in tick-level order flow, in structural regime detection, or in execution advantages retail does not have. That is where the next Pillar 3 work points, and it is a more honest map than the fourteen setups you started with.
KEY POINTS
- Fourteen popular intraday OHLCV signal families were tested on 947 days of five-minute MNQ data with honest bar-close signals, next-bar-open fills, and two points of friction. None cleared the five-gate gauntlet.
- The gauntlet requires all five at once: out-of-sample T >= 2.0, at least 30 trades, positive net after friction, stability across every year, and a permutation p below 0.05. Passing four is a fail.
- The gross edge ceiling is the finding. The best-behaved signals capture roughly 1.0 to 1.5 points gross per trade, and a two-point round-trip cost erases it. Net per trade equals gross minus friction, and for most families that number is negative before anything else.
- The ceiling sits near the friction cost because competition arbitrages any public single-bar pattern down to the marginal participant's cost. The market leaves no free point for a setup every forum knows.
- The trade-count floor is not bureaucracy. Because T scales with the square root of N, a thin sample can fake significance; the gap continuation short printed T = 3.23 on 22 trades and dies the moment the sample grows.
- Year instability is the most common failure mode. One strong year drags the pooled number positive while the others sit red, and a single-year backtest would have called several dead signals tradeable.
- The two positive controls (T = 5.83 and 5.15) prove the test can find real edge. They win by reading regime state and holding twelve to fifteen bars, not by trading single-bar price patterns, which is exactly the category the ceiling constrains.
References
- Testing and Tuning Market Trading Systems - Timothy Masters (Amazon)
- Data Mining Algorithms in C++ - Timothy Masters (Amazon)
- Structural Limits of OHLCV-Based Intraday Signals in MNQ Futures: A Systematic Falsification Study (ssrn-6709401)
A note on AI. The ideas, research, analysis, and conclusions in this article are my own. I use AI tools to help with editing and wordsmithing, because English is not my first language, and I am not shy about that. AI-generated ideas and AI-assisted writing are not the same thing: the first is empty slop from a generic prompt, the second is a tool for communicating years of real research more clearly. Judge the work by its substance, not by whether software helped polish the prose.