3.36 The NATGAS 20-25h Cycle: Real or Folklore?
A NATGAS daytrader legend claims a guaranteed 20-25h sell-wave cycle, 44 trades a month. Run it through the gauntlet: cause test, multiple-comparisons, permutation null, and cost arithmetic. It is folklore until proven otherwise.
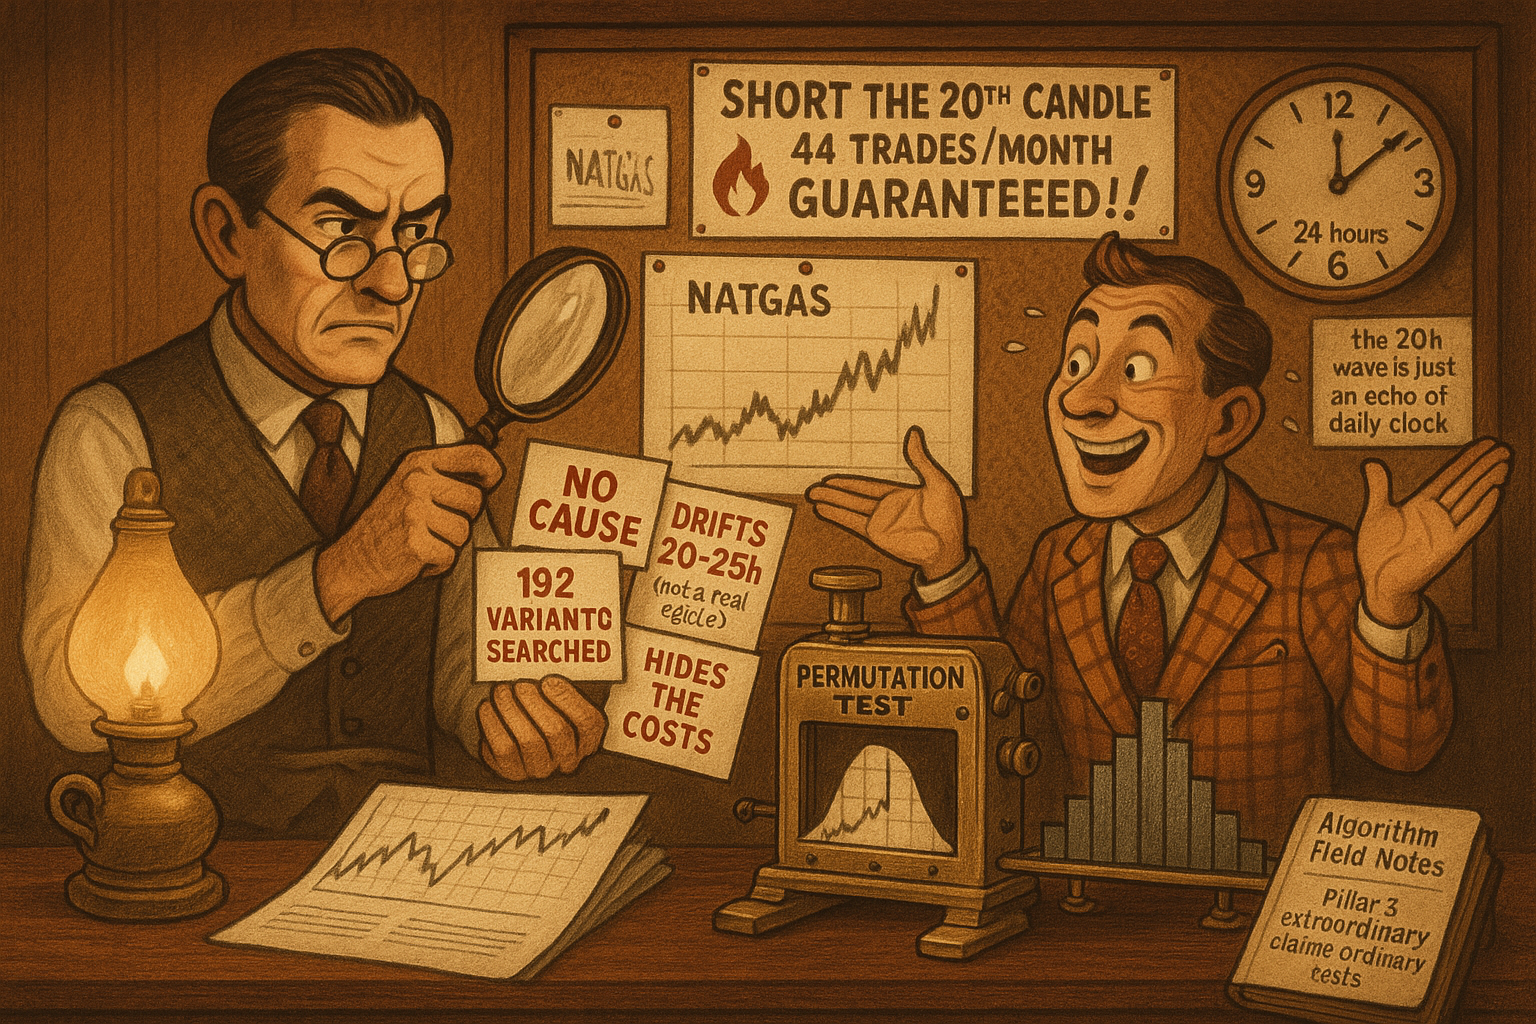
A claim makes the rounds among natural gas daytraders, passed along like a secret: the NATGAS market runs a daily sell wave. Every 20 hours the probability of another wave climbs, and you can short after the 20th one-hour candle from the last peak for a 0.7% to 3.5% drop over the following three to four hours. The intervals run between 20 and 25 hours, almost never shorter or longer. Do it on both peaks and troughs and you get 2 times 22, or 44 trades per month, described as guaranteed profit. Many small wins add up. DYOR.
I am not going to republish that as a strategy, because the word "guaranteed" next to a round 44 is the loudest sell-side tell in trading. But the claim is testable, and a testable claim deserves the gauntlet rather than a sneer. This article runs the NATGAS cycle through the same machinery the publication built for any seasonal: the cause test from the old article "The Three Engines of Seasonality: Fixed-Date, Floating-Date, and Behavioral", the reliability checklist from the old article "Is Your Seasonal Real or Curve-Fit? A Reliability Checklist", and the null-distribution discipline from the old article "Permutation Tests for Indicator Significance". Let the data confirm it or kill it.
First, the red flags
Before a single backtest, the claim trips four alarms that any seasonal should survive.
It names no cause. Real natural gas seasonality has physical engines: heating demand in winter, injection season in summer, the EIA storage report every Thursday at 10:30 ET. A cycle that fires "every 20 hours from the last peak" anchors to nothing physical. No furnace runs on a 20-hour clock, no report drops on a drifting schedule.
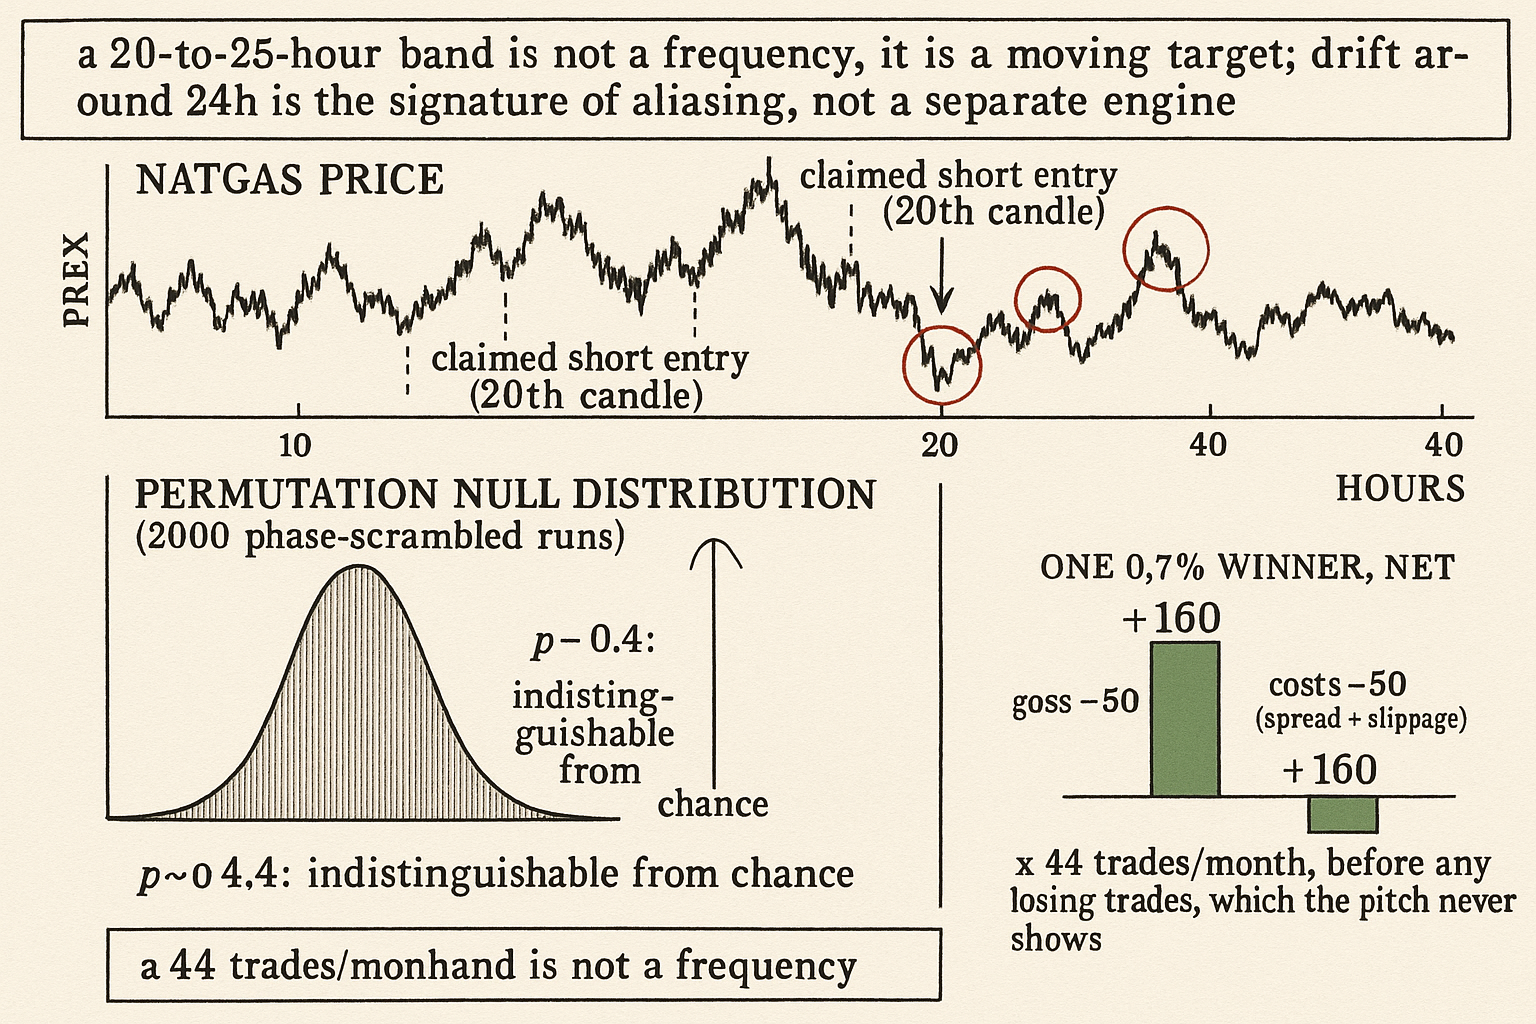
It drifts. A 20-to-25-hour interval is not a cycle, it is a band. A genuine periodicity has a frequency you can name; a band wide enough to slide an hour or five each day is a moving target that fits any data after the fact. The drift is the tell, not the feature.
It promises a guaranteed count. 44 trades per month with guaranteed profit is the language of a course, not a researcher. Real edges come with win rates below 100%, drawdowns, and a cost line.
It sits suspiciously close to 24 hours. A "20-to-25-hour cycle" lives one alias away from the daily cycle every market already has (the daily open, settlement, and report rhythm). A pattern that drifts around 24 hours is the signature of aliasing against the true daily structure, not evidence of a separate 20-hour engine.
Step one: operationalize the claim into a precise rule
A vague claim cannot be falsified. Pin it down. Detect the last swing peak on hourly NATGAS bars; count forward; at the 20th hourly candle open a short; hold for four hours; book the result. The mirror rule on troughs goes long. Already the operational choices pile up: how do you define a "peak"? A rolling-window maximum of what length? Does the 20th candle reset on every new peak or only on confirmed ones? Each choice is a free parameter, and free parameters are where curve-fits hide.
The honest move is to enumerate the parameters you searched. Peak-window length (say 6, 8, 12 hours), the entry candle (18 through 25), the hold length (2, 3, 4 hours), the side rule. That is already on the order of 4 times 8 times 3 times 2, or 192 candidate strategies. The "20-25h" range alone is six candidate entry lags. You did not test one hypothesis. You tested a family, and the best member of a family always looks good.
Step two: the cause test
The old article "The Three Engines of Seasonality" gives three legitimate sources: fixed-date (a calendar anchor like the Thursday EIA report), floating-date (an anchor that moves on a known rule, like a holiday or an options expiry), and behavioral (a recurring human pattern, like end-of-quarter rebalancing). The NATGAS cycle fits none. It has no fixed calendar slot, no rule-based float, and no named behavioral driver. It is a pattern in search of an engine.
This matters because a seasonal with no cause is a curve-fit until proven otherwise. The burden is on the claim to name the mechanism that would make a 20-hour sell wave recur, and "the chart shows it" is not a mechanism.
Step three: the multiple-comparisons correction
Searching 192 variants and reporting the best one inflates significance. If each variant has even a small chance of looking good by luck, the maximum over 192 of them looks great by luck alone.
$$ p_{\text{adj}} = 1 - \left(1 - p_{\text{single}}\right)^{M}, \qquad M = 192 $$
The adjusted p-value is one minus the chance that all M independent tests fail to reach the single-test threshold. A variant that reads a respectable p of 0.01 on its own, once you account for 192 searched variants, carries an adjusted p of 1 minus 0.99 to the 192nd power, which is about 0.85. That is not significance. That is the near-certainty of finding something in 192 tries. The Bonferroni-style correction is crude, but it makes the point: the search width eats the edge.
Step four: the permutation gauntlet
The clean way to test the surviving rule is the permutation method from the old article "Permutation Tests for Indicator Significance". Keep the rule fixed. Destroy the structure it claims to exploit while preserving everything else about the series.
$$ \hat{p} = \frac{1 + \#\{\, b : \text{PnL}_b^{\text{perm}} \ge \text{PnL}^{\text{real}} \,\}}{1 + B} $$
The permutation p-value counts how often a shuffled series produces a backtest PnL at least as good as the real one, across B shuffles, with the plus-one guarding against a zero count. For a cycle claim, the right shuffle is a circular block rotation or a phase scramble of the hourly returns: it keeps the daily volatility shape and the fat tails of NATGAS intact while breaking any fixed 20-hour phase relationship. Run B equal to 2000. If the real rule's PnL sits in the fat middle of the permuted distribution, the cycle is folklore. If it lands beyond the 99th percentile and the cause test and the cost test also pass, you have something worth a small live allocation.
The reliability checklist from "Is Your Seasonal Real or Curve-Fit?" adds the rest: does the pattern hold across sub-periods (split the sample by year), across both peaks and troughs symmetrically, and out of sample on data you never touched while searching? A real seasonal survives all three. A curve-fit collapses on the first cut it did not see during fitting.
Step five: the cost test that kills most of these
Grant the claim its gross edge for a moment and run the arithmetic, because NATGAS is one of the most expensive instruments retail touches. Front-month NG futures move in ticks of 0.001, worth 10 dollars per contract. A 0.7% move on a 3.00 contract is 0.021, or 21 ticks, about 210 dollars gross per contract on the small wins the claim leans on.
Now the costs. NATGAS is notorious for wide spreads and gappy fills around the volatility the claim is trying to harvest. Budget one tick of spread plus a tick or two of slippage on entry and the same on exit, call it four to six ticks round trip, 40 to 60 dollars, before commissions. On the small end of the claimed move that is a quarter of the gross gone to friction. Multiply by 44 trades a month and the friction compounds into a number the "guaranteed profit" framing never mentions. And this assumes the win rate is high; the claim never states one, never shows a losing trade, and never shows the drawdown when the 21st candle keeps rising instead of falling. A strategy with no stated win rate and no drawdown is not a strategy, it is a brochure.
The verdict and what would change it
On the evidence available, the 20-25h NATGAS cycle is folklore: no named cause, a drifting band rather than a frequency, a search wide enough to manufacture significance, and a cost line the pitch hides. The aliasing against the true 24-hour structure is the most likely source of whatever pattern people see.
What would move me: a single pre-registered rule (one peak-window, one entry lag, one hold), a named physical or behavioral mechanism for a sub-daily wave, a permutation p below 0.01 against a phase-scrambled null, survival across yearly sub-samples and on untouched out-of-sample data, and a net-of-cost equity curve that includes the losers. Produce those and I will trade it. Until then, the only guaranteed 44 per month is the number of times you pay the spread.
Visualizing the teardown
KEY POINTS
- The claim: short NATGAS at the 20th hourly candle after a peak (mirror on troughs), 0.7% to 3.5% over three to four hours, intervals of 20 to 25 hours, 44 trades a month, guaranteed. Treat it as a hypothesis, not a strategy.
- Four red flags before any test: no named cause, a drifting 20-25h band instead of a real frequency, a guaranteed round-number trade count, and a period sitting one alias away from the daily 24h structure.
- Operationalize before falsifying: peak-window length, entry candle, hold length, and side rule give roughly 192 candidate variants. Reporting the best of 192 is not a single test.
- Multiple-comparisons correction: a per-variant p of 0.01 across 192 searched variants becomes an adjusted p near 0.85, the near-certainty of finding something by luck.
- The cause test from the old seasonality engines article: the cycle is neither fixed-date, floating-date, nor behavioral. A seasonal with no engine is a curve-fit until a mechanism is named.
- The permutation gauntlet: keep the rule fixed, phase-scramble or block-rotate the hourly returns to break the 20-hour phase while preserving NATGAS volatility and tails, run 2000 shuffles, and check whether the real PnL clears the 99th percentile.
- Reliability checklist: it must hold across yearly sub-samples, symmetrically on peaks and troughs, and on out-of-sample data untouched during the search.
- The cost test: NG ticks are 10 dollars; a 0.7% move on a 3.00 contract is about 210 dollars gross, but four to six ticks of round-trip spread and slippage plus 44 trades a month, with no stated win rate and no drawdown, is how "guaranteed" dies.
- Verdict: folklore on current evidence. It flips to tradeable only with a pre-registered single rule, a named mechanism, a permutation p below 0.01, sub-sample and out-of-sample survival, and a net-of-cost curve that includes the losers.
References
- EIA Weekly Natural Gas Storage Report
- CME Henry Hub Natural Gas (NG) Futures - Contract Specifications
- White, A Reality Check for Data Snooping (search)
- Multiple hypothesis testing and the Bonferroni correction (search)
- Testing and Tuning Market Trading Systems - Timothy Masters (Amazon)
- Data Mining Algorithms in C++ - Timothy Masters (Amazon)
- Probability and Statistics for Experimental Design in Finance
- Short‑Term Forecasting of Henry Hub Natural Gas Prices Using Machine Learning and Time Series Models
- Natural Gas Price Volatility: Weather Forecasts, Forecast Revisions, and Seasonal Demand
- Liquid Neural Network Models for Natural Gas Spot Price Time Series
- Thermodynamic-environmental-economic nexus for sawdust to
- Can extreme weather forecasts lead to a risk premium? Evidence of
- A review of the literature on LNG: Hubs development, market
- Forecasting natural gas consumption with multiple seasonal patterns