7.4 State-Space Models for Price: CryptoMamba vs Transformers (Skeptical)
CryptoMamba, a compact Mamba SSM, forecasts Bitcoin's next close and trades $100 into $262. But it never runs the naive or buy-and-hold baselines, on one bull year of daily bars.
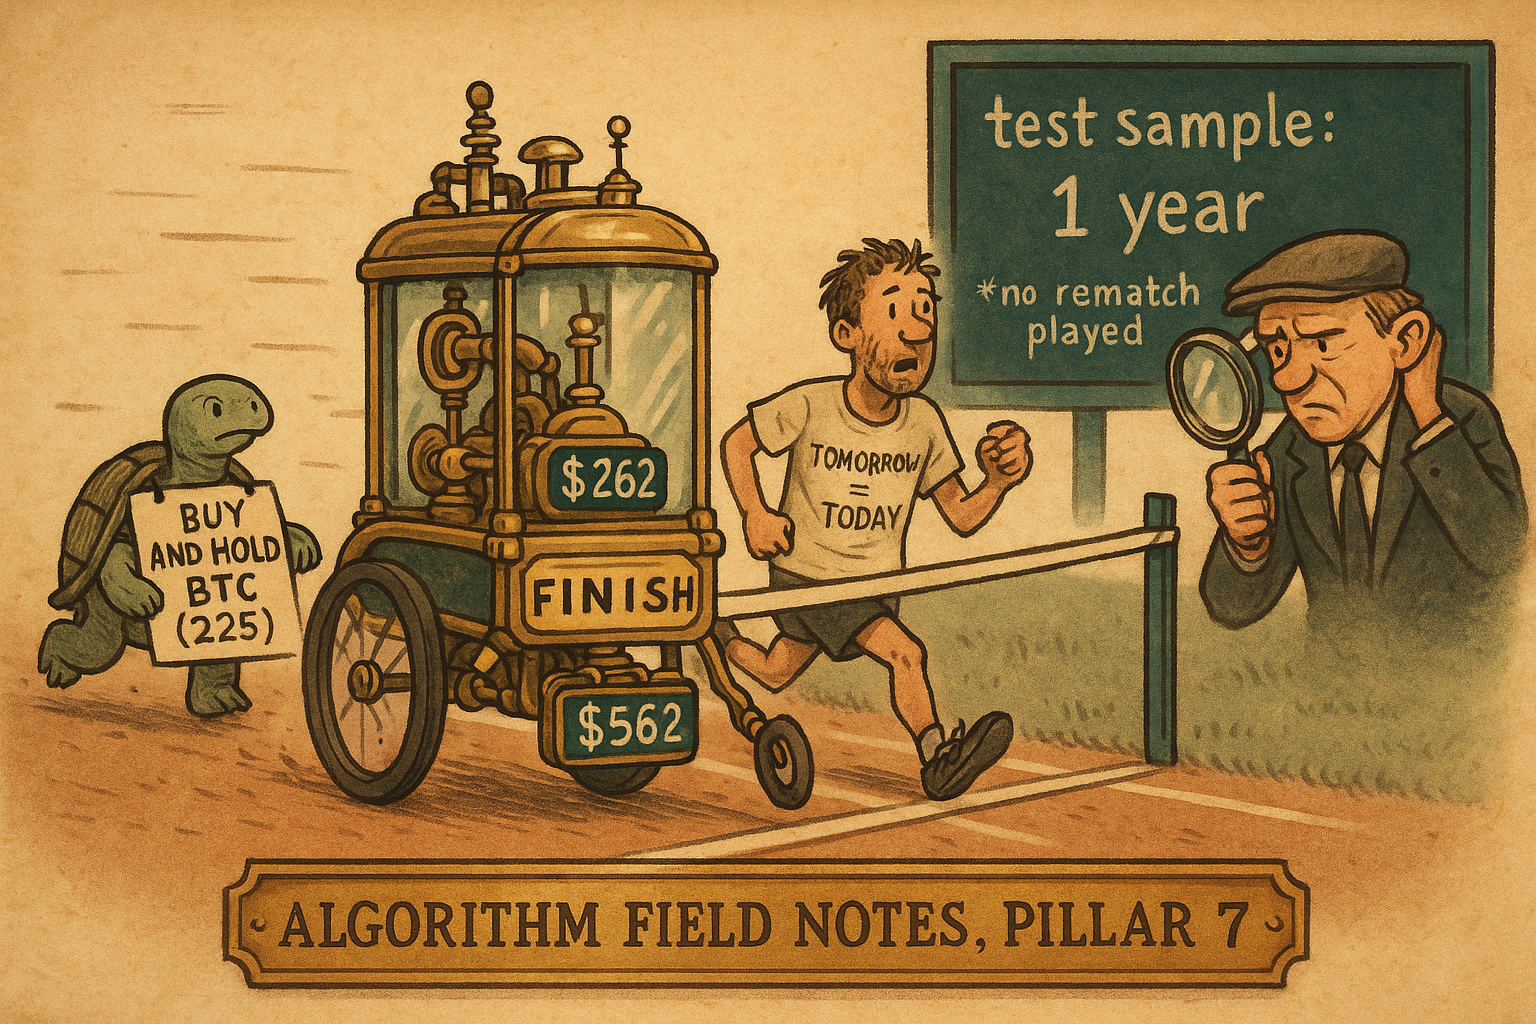
Every few years a new architecture gets pointed at Bitcoin and a paper announces it won. This round it is Mamba, the selective state-space model that is genuinely reshaping language and vision. Sepehri, Mehradfar, Soltanolkotabi, and Avestimehr at USC built CryptoMamba, a compact Mamba network that reads 14 days of Bitcoin OHLCV and predicts the next day's close. The numbers are real and they reported them cleanly: a test-set RMSE of 1598, a 136k-parameter model beating an S-Mamba baseline with 330k, and an Extended Smart trading rule that turns $100 into $262 over a year. The paper concludes there is "a huge advantage for SSMs" in price forecasting.
The architecture is legitimate and the engineering is careful. The evidence for the trading claim is not, and the gap between those two things is the whole point of this teardown. The problem is not the model. It is the benchmark the paper never ran and the sample it ran on: one year of daily bars, no naive baseline, no buy-and-hold line, and a ranking that flips between validation and test. Predicting the level of a near-random-walk is easy and says almost nothing about whether you can trade it.
What a selective state-space model actually is
Strip the branding and an SSM is a linear system with a hidden memory. A small state vector carries information forward, decays part of it each step, absorbs the new input, and emits an output. That is the same machinery Kalman wrote down in 1960, now stacked and trained by gradient descent.
$$ \dot{x}(t) = A\,x(t) + B\,u(t), \qquad y(t) = C\,x(t) + D\,u(t) $$
Read it plainly. The input u is today's scalar feature, the state x is a low-dimensional memory, and A, B, C, D are learned. A controls how fast the memory fades, B injects the new input into the memory, C reads the memory out into a prediction, and D is a direct passthrough usually dropped. Work a scalar case: set A to -0.5 and B to 1. If the state is 2 and the input is 1, then x-dot is -0.5 times 2 plus 1 times 1, which is 0, so the memory holds. Cut the input to 0 and x-dot becomes -1, so the memory bleeds off toward zero. The state is a leaky record of everything it has seen.
To run on daily bars the continuous system is discretized with a zero-order hold over a step size Delta.
$$ x_k = \bar{A}\,x_{k-1} + \bar{B}\,u_k, \qquad y_k = \bar{C}\,x_k, \qquad \bar{A} = \exp(A\,\Delta) $$
The bar terms are the discrete versions of A and B. With A at -0.5 and Delta at 1, A-bar is exp(-0.5), which is 0.607, and B-bar works out to about 0.786. So x-k equals 0.607 times the last state plus 0.786 times today's input. The one trick Mamba adds is selectivity: it makes B-bar, C, and Delta functions of the input itself, so the decay rate and the read-out change with the data instead of staying fixed. That is what lets it react to regime shifts, and because the scan is hardware-aware, cost scales linearly with sequence length rather than quadratically like attention. This is real progress over a plain LTI state-space model, and over the quadratic cost of a Transformer. None of it is in dispute.
The accuracy number, and the baseline they never ran
Here is where the story gets thin. The reported accuracy metric is MAPE, the mean absolute percentage error between predicted and actual next-day close.
$$ \text{MAPE} = \frac{100}{n} \sum_{i=1}^{n} \left| \frac{y_i - \hat{y}_i}{y_i} \right| $$
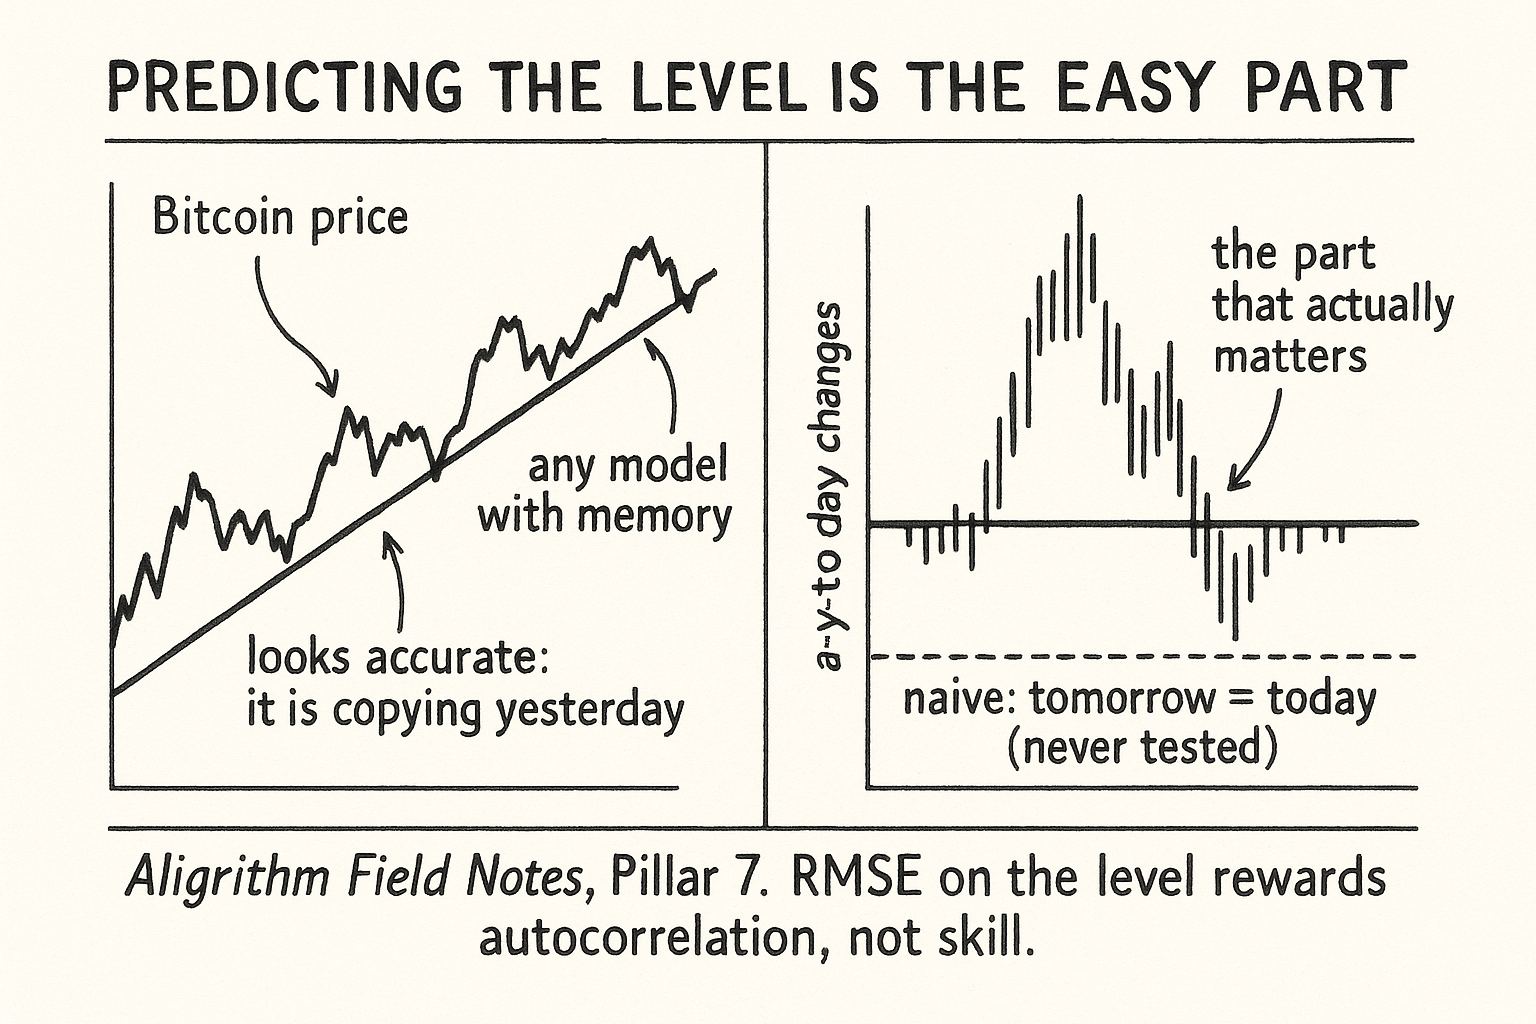
CryptoMamba's volume-inclusive variant posts a MAPE of 2.034%. On a $60,000 Bitcoin that is a typical miss near $1,200, consistent with its reported MAE of 1121. Sounds sharp. Now run the one baseline the paper skips: predict tomorrow's close equals today's close. For that naive rule the error on each day is exactly that day's absolute return, so its MAPE equals the average absolute daily return over the test window. Bitcoin's daily moves across that year ran roughly 2 to 3% (an estimate from the price path, not a paper number). That puts naive persistence at a MAPE somewhere around 2 to 3%, sitting right on top of CryptoMamba's 2.034%.
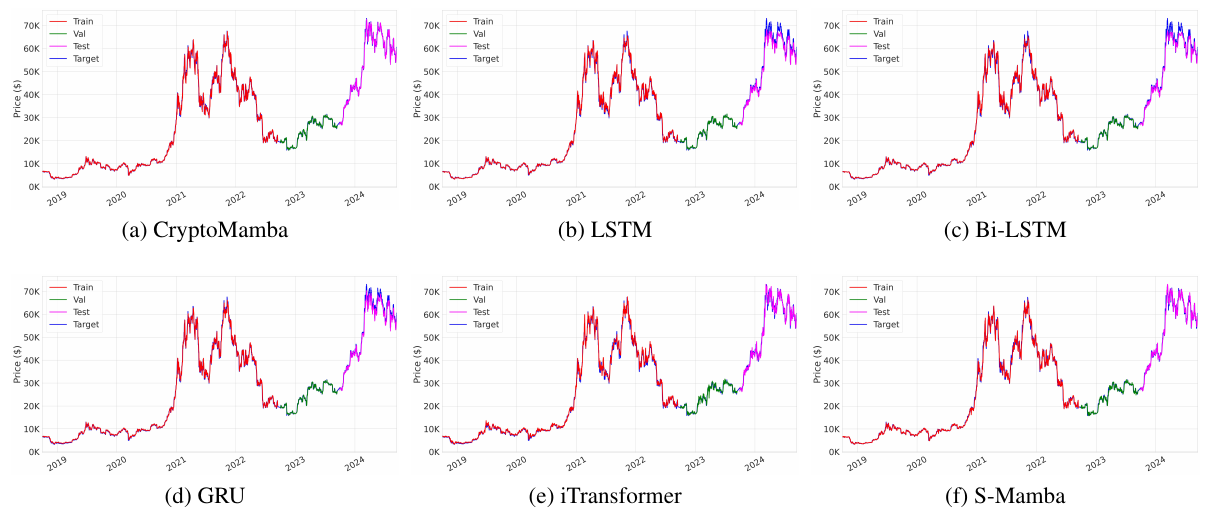
Look at the figure and the tell is obvious: all six models, from a plain LSTM to CryptoMamba, produce prediction lines that hug the actual price. They look almost identical because they are all doing the same easy thing, echoing a level that is dominated by yesterday's level. The old article "Synthetic Prices: EMA of Random Numbers as a Market Model" made this exact point: prices behave like random numbers with memory, so a model that forecasts the price level will look accurate while telling you nothing about the increment. RMSE and MAPE on the level reward you for the autocorrelation of the level, not for skill on the change. The paper compares CryptoMamba to LSTM, GRU, iTransformer, and S-Mamba, and never to the random walk that would expose how little any of them add.
One year is not a sample
The test set runs from September 2023 to September 2024, and predictions start 14 days in, so the entire out-of-sample record is roughly 350 daily points on a single asset in a single regime. That is one bull market, not a distribution of outcomes.
The instability shows up the moment you read both tables. On validation, CryptoMamba is mediocre: its Vanilla strategy ends at $124 while Bi-LSTM-v hits $157 and GRU-v hits $154. On test, the ranking inverts and CryptoMamba jumps to the top. A model that ranks fifth on one year and first on the next has not demonstrated skill, it has demonstrated that one year of daily data cannot separate these models. The paper also fixes a single random seed, which means there is no run-to-run variance reported at all, so a 1598 versus 1651 RMSE gap between CryptoMamba and S-Mamba has no error bar attached. On 350 points those two numbers are almost certainly inside each other's noise.
The timeframe is the other quiet problem. The old article "Ridge Above 1h, XGBoost Below 5min" argued that the right model depends entirely on the bar size, and that at the daily scale a heavier architecture rarely earns its complexity. This paper is the daily scale, predicting one-step-ahead level, which is close to the easiest and least informative forecasting target there is. The architecture race is being run on the track where architecture matters least.
The trading result barely clears buy-and-hold
The trading section is meant to prove the forecasts are useful, using three rules of rising aggression: Vanilla, Smart, and Extended Smart, the last of which can short up to 0.002 BTC. Risk is measured with maximum drawdown.
$$ \text{MDD} = \max_{t \in [1,T]} \left( \frac{\max_{i \in [1,t]} P_i - P_t}{\max_{i \in [1,t]} P_i} \right) $$
MDD is the worst peak-to-trough drop as a fraction of the peak. Work it: if the portfolio peaks at $130 then falls to $110, the drawdown is 130 minus 110 over 130, which is 15.4%. CryptoMamba-v's Extended Smart run reports an MDD of 11.09%, the best risk control in the field, while LSTM's Extended Smart run blew a 71.46% drawdown. So far so good for the winner. The catch is the missing reference line.
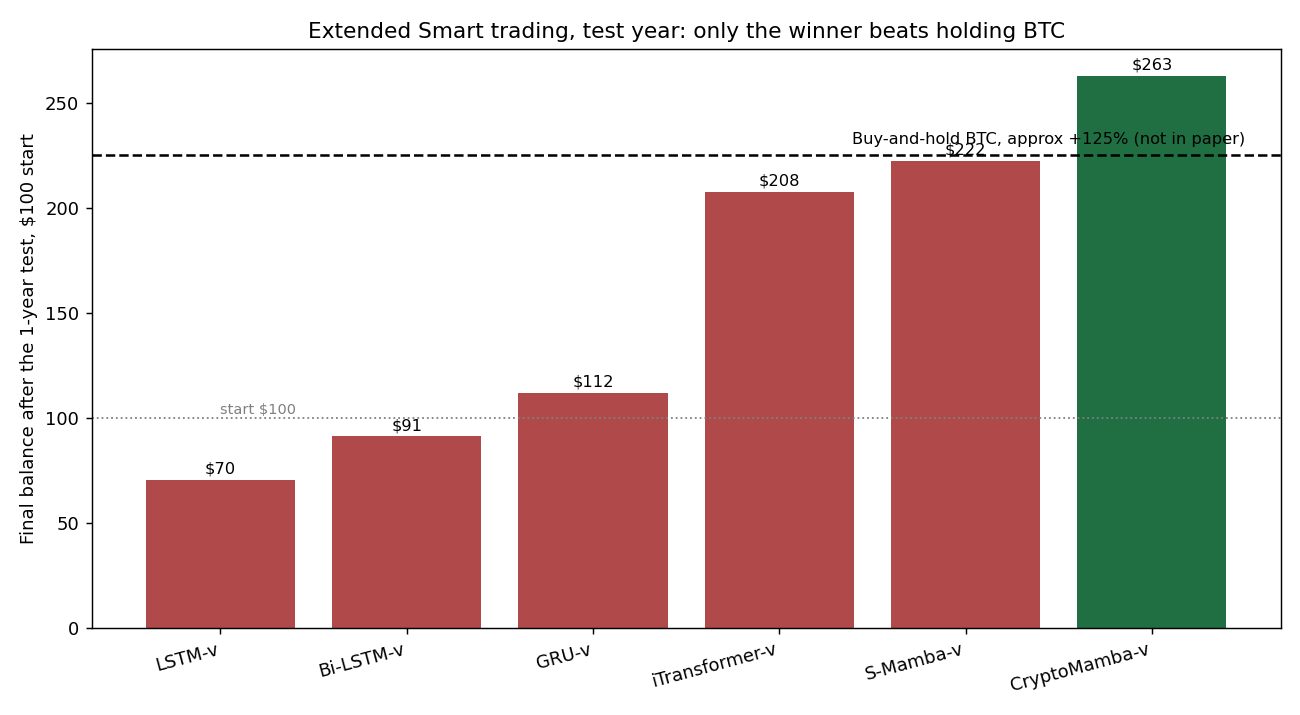
Bitcoin ran from roughly $26,500 to about $60,000 over the test year, near +125%, so a passive $100 in spot BTC would have become about $225 with zero modeling (this line is my estimate, not a paper figure, since the paper never plots it). Against that line the results deflate. CryptoMamba-v's Extended Smart ends at $262.78, a real beat of about 38 points, but its Smart variant ends at $213.20, which loses to just holding. S-Mamba-v lands at $222.50, a tie with spot. iTransformer-v's Extended Smart at $207.67 loses to spot, and its Vanilla at $241.50 sits within a hair of CryptoMamba-v's $246.58. Every recurrent baseline finishes below buy-and-hold. In other words, the single best configuration of the best model, with shorting switched on, beat holding Bitcoin by a modest margin over one bull year, and most of the "winning" trading strategies underperformed doing nothing. That is not a result you lever up on.
What actually holds up
Two things survive the skepticism. The efficiency claim is real: 136k parameters beating a 330k S-Mamba and a 569k Bi-LSTM, with a 29-minute train and 1.17 ms inference, is a genuine argument for selective SSMs as compact sequence models. And using trading algorithms as an evaluation lens, rather than RMSE alone, is the right instinct, because regression error and profit are not the same objective. The authors half-built the honest test. They just left out the two benchmarks that would have graded it: naive persistence for the forecast and buy-and-hold for the trade. Put those back in and CryptoMamba looks like a tidy, efficient model that has not yet been shown to beat the two dumbest strategies in finance by a margin that survives a single year of daily bars.
KEY POINTS
- CryptoMamba is a selective state-space (Mamba) model reading 14 days of OHLCV to predict the next day's Bitcoin close. The architecture is sound: input-dependent decay and read-out, linear-time scan, and only 136k parameters versus 330k for S-Mamba and 569k for Bi-LSTM.
- The headline accuracy, a 2.034% MAPE, is measured on the price level, which is dominated by yesterday's level. A naive "tomorrow equals today" rule has a MAPE equal to the average daily absolute return, roughly 2 to 3% here, so the model's edge over the untested baseline is a few tenths of a percent.
- All six models' prediction lines hug the actual price in the paper's own figure, because forecasting the level of a near-random-walk is easy for anything with memory. The paper never compares to a random walk.
- The out-of-sample test is one bull year, about 350 daily points on one asset. CryptoMamba ranks mid-pack on validation and first on test, and only one seed is run, so key RMSE gaps (1598 vs 1651) carry no error bar.
- The trading win barely clears buy-and-hold. BTC rose about +125% in the test year (a $100 to roughly $225 passive result). CryptoMamba-v's best rule ends at $262.78, but its Smart variant ($213.20) and every recurrent baseline lose to spot, and iTransformer sits within a hair of it.
- What holds up: the efficiency case for compact SSMs, and the instinct to grade forecasts by trading outcomes rather than RMSE alone. What is missing: the naive-persistence and buy-and-hold benchmarks that would decide whether any of it is skill.
A note on AI. The ideas, research, analysis, and conclusions in this article are my own. I use AI tools to help with editing and wordsmithing, because English is not my first language, and I am not shy about that. AI-generated ideas and AI-assisted writing are not the same thing: the first is empty slop from a generic prompt, the second is a tool for communicating years of real research more clearly. Judge the work by its substance, not by whether software helped polish the prose.