5.29 Microstructural Volatility: Three Ways to Measure It
A maker repricing every few hundred milliseconds needs tick-scale volatility, not one-minute bars. Measure it three ways: std of traded prices, the book's churn rate, or the volatility of your own fair price.

Volatility is the single most important input to a spread. The old article "Spread Widening During Volatility Expansion" laid down the rule: blow your quotes out when the market's volatility does, because a fixed markup that is safe in a calm tape is a free gift to informed traders in a moving one. The whole argument rests on having a volatility number to react to. Which raises the question nobody answers cleanly: at the microstructure scale, where you are repricing every few hundred milliseconds, what volatility do you even measure?
Standard realized volatility, the standard deviation of returns over some bars, is built for a slower world. By the time you have enough one-minute bars to estimate it, the burst that would have picked you off is over. You need a volatility that lives at the tick scale and updates as fast as the book does. There are three honest ways to build one, and they measure genuinely different things.
Way one: the standard deviation of an observable
The most direct route is to take something the market hands you tick by tick and compute its rolling standard deviation. Three candidates work, and each has a different bias.
$$ \sigma_{\text{micro}} = \operatorname{std}(X) \qquad X \in \{\text{traded prices},\ \text{volume},\ \text{price impact}\} $$
Standard deviation of traded prices over the last N trades is the obvious one: when prints are scattered widely, the market is volatile. Standard deviation of volume is a stranger choice that works because volume and volatility are nearly the same variable in disguise, swap one for the other in most microstructure formulas and the feature barely changes, so a jumpy volume series flags a jumpy price series. Standard deviation of price impact, the per-trade move from first to last fill, measures how violently each trade is shoving the mid around.
The trade-price version is the most interpretable and the one to start with. The volume version is useful when the tape is thin and prices are sparse, because volume keeps printing even when the price sits still. They will disagree, and the disagreement is informative: high volume-vol with low price-vol means a lot of size is changing hands without moving the market, which is a thick, absorptive book, the opposite of fragile.
Way two: derive it from the flow rates
The second route skips price entirely and reads volatility off the book's churn. The previous article in this cluster, "The Market-Maker Feature Catalog: Arrival, Cancellation, and Update Rates," built three intensity features, and those rates are themselves a volatility proxy. When orders arrive and cancel at high speed, the book is being rewritten violently, and a violently rewritten book produces volatile prices.
The logic: arrival rate plus cancellation rate is how fast the resting liquidity is turning over, and fast turnover is the precondition for a fast price move. You can read the update rate directly as a microstructural volatility, or combine arrival and cancellation into one churn number. The advantage over the price-based estimators is latency. The flow rates lead price, because the book churns before the print moves, so a vol estimate built from arrival and cancellation rates reacts a beat earlier than one built from traded prices. The cost is that it is a proxy, not the thing itself: a frantically churning book usually means a volatile price, but not always, and you are trading directness for speed.
Way three: the volatility of your own fair price
The third route is the one a real maker should reach for, and it only exists if you already run a pricing model. If you quote around a fair value, the old article "Order Book Imbalance: The First Microstructure Feature to Test" pushed imbalance as the core input to that fair value, then take the standard deviation of your own fair price over a rolling window.
This is the cleanest of the three for one reason: it measures volatility in exactly the quantity you care about. You do not get adversely selected on traded prices or on volume; you get adversely selected when your fair value moves between the moment you post a quote and the moment someone fills it. The volatility of your fair price is the direct measure of that risk. It also automatically folds in everything your fair-value model already knows, imbalance, microprice, trade flow, so it is a richer estimate than any single raw observable. The catch is circularity and noise: if your fair-value model is jumpy or mis-specified, its volatility is your model's noise, not the market's, so this estimator is only as good as the price it is measuring.
A worked number
Run a 200-trade rolling window on an alt perp. Traded prices over that window have a standard deviation of 12 basis points around their mean. Your base spread in the calm regime was set to a 6 bps half-width, on the assumption that fair value would not move more than a few bps before you reprice. The micro-vol estimate just told you fair value is scattering twice that far, so a 6 bps half-width means you are quoting inside one standard deviation of where the price is wandering, getting picked off on the moves. Scaling the half-width by current-vol over baseline-vol, roughly 12 over 6, doubles your quote to a 12 bps half-width and restores the cushion. Same mechanism as the discrete and continuous regime models from the spread-widening article, now driven by a tick-scale number instead of a one-minute one.
Which to use
Start with the standard deviation of traded prices because it is honest and interpretable. Add the flow-rate version when you need the vol estimate to lead price rather than lag it, accepting that it is a proxy. Move to the volatility of your own fair price once you trust your pricing model, because it measures adverse-selection risk in its native units. The three are complementary, and a robust desk blends them: the fair-price vol for the core spread, the flow-rate vol as an early-warning overlay that widens you before the first violent print lands.
The usual caution applies harder here than anywhere. Microstructural volatility is wildly non-stationary, it spikes and collapses in seconds, so any window you pick is a compromise between responsiveness and noise. Too short and the estimate jitters and whipsaws your spread; too long and it lags the burst you were trying to catch. There is no correct window, only a tradeoff you tune against markouts, and you should expect to run a fast estimate and a slow one and take the larger when they disagree.
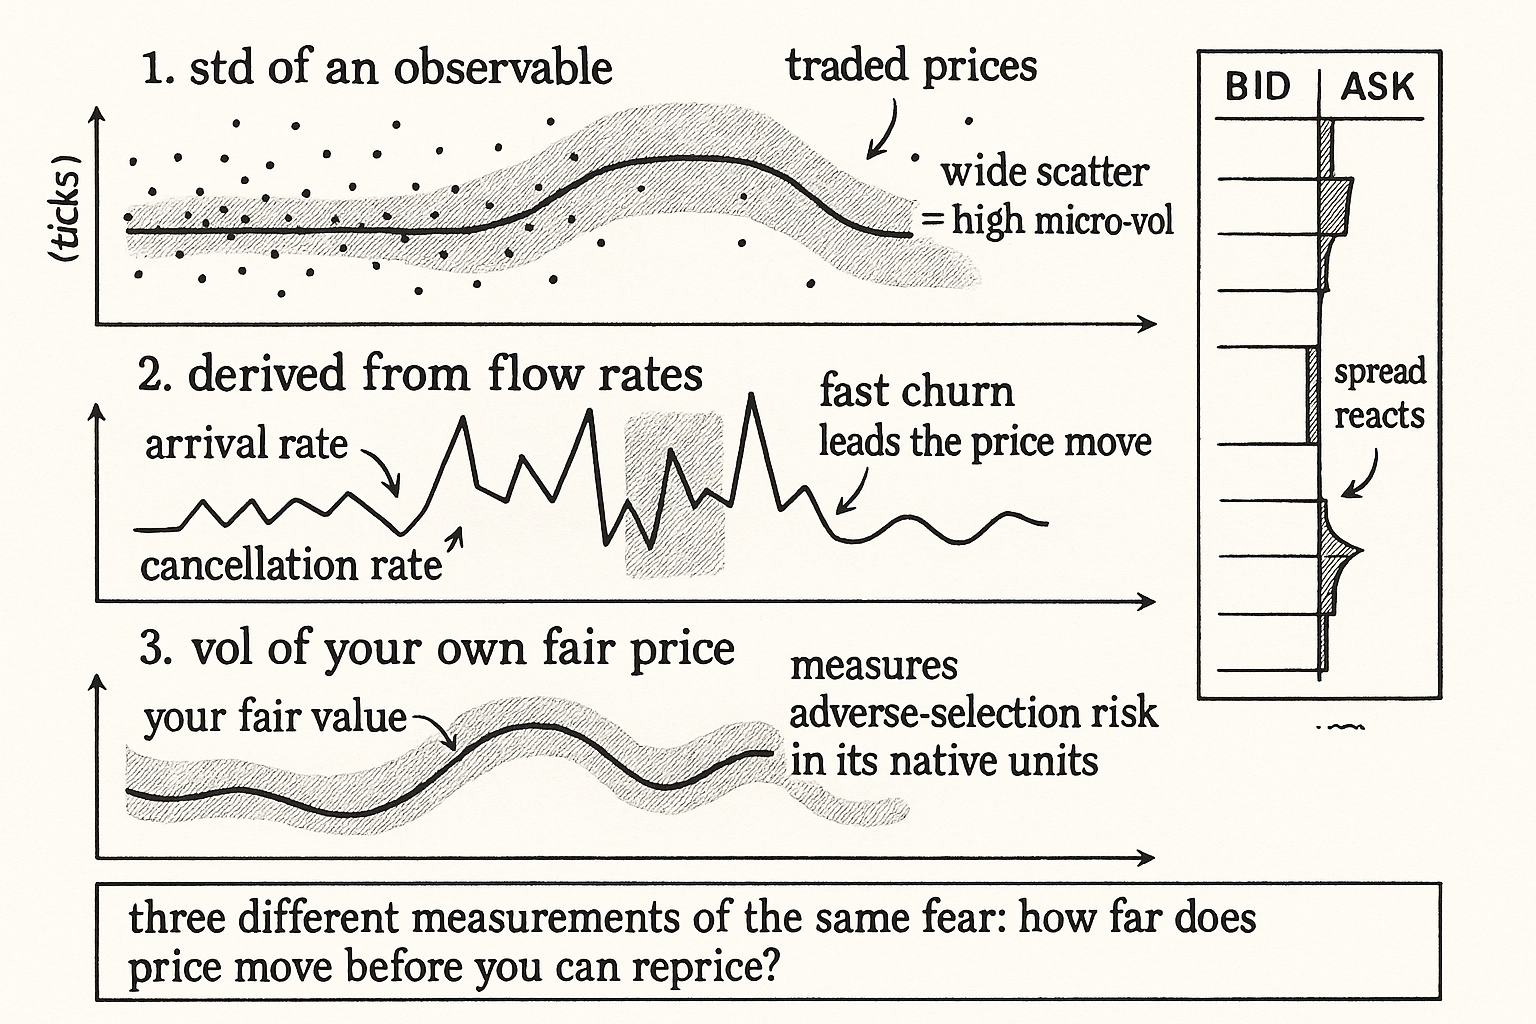
Visualizing the three estimators
KEY POINTS
- Standard realized volatility from one-minute bars is too slow for a maker repricing every few hundred milliseconds; microstructural volatility lives at the tick scale and updates with the book.
- Way one: rolling standard deviation of an observable, traded prices (most interpretable), volume (works on thin tapes because volume tracks volatility), or price impact. Disagreement between price-vol and volume-vol is itself informative.
- Way two: derive volatility from arrival plus cancellation rates. The book churns before the price moves, so this estimate leads, at the cost of being a proxy rather than the thing itself.
- Way three: standard deviation of your own fair price. The best option once you trust your model, because adverse selection happens in fair-value space, so this measures the actual risk in its native units, and it inherits everything the fair-value model already knows.
- Worked size: if traded-price std is 12 bps and your half-width is 6 bps, you are quoting inside one standard deviation of price wander and getting picked off; scale the half-width by current vol over baseline vol to restore the cushion.
- Microstructural volatility is violently non-stationary, so every window is a responsiveness-versus-noise compromise; run a fast and a slow estimate, take the larger when they disagree, and tune against markouts.
References
- Volume, Volatility, and Public News Announcements (Cont and others on volume-volatility link)
- The Microstructure of the Flash Crash and High-Frequency Volatility
- Realized Volatility and Microstructure Noise (Zhang, Mykland, Ait-Sahalia)
- Order Flow, Liquidity, and Securities Price Dynamics
- The Art of Currency Trading - Brent Donnelly (Amazon)
- A Tale of Two Time Scales: Determining Integrated Volatility with Noisy High-Frequency Data
- High Frequency Market Microstructure Noise Estimates and Liquidity Measures
- Separating Microstructure Noise from Volatility
- Realized Volatility Forecasting and Market Microstructure Noise
- Data-based Ranking of Realised Volatility Estimators
- Time and Dynamic Volume–Volatility Relation
- The Relationship Between Trading Activity and Stock Market Volatility
- Estimating the Price Impact of Trades in a High-Frequency Microstructure Model with Jumps