5.35 Market Impact and the Square-Root Law: Walking the Book to Price Your Slippage
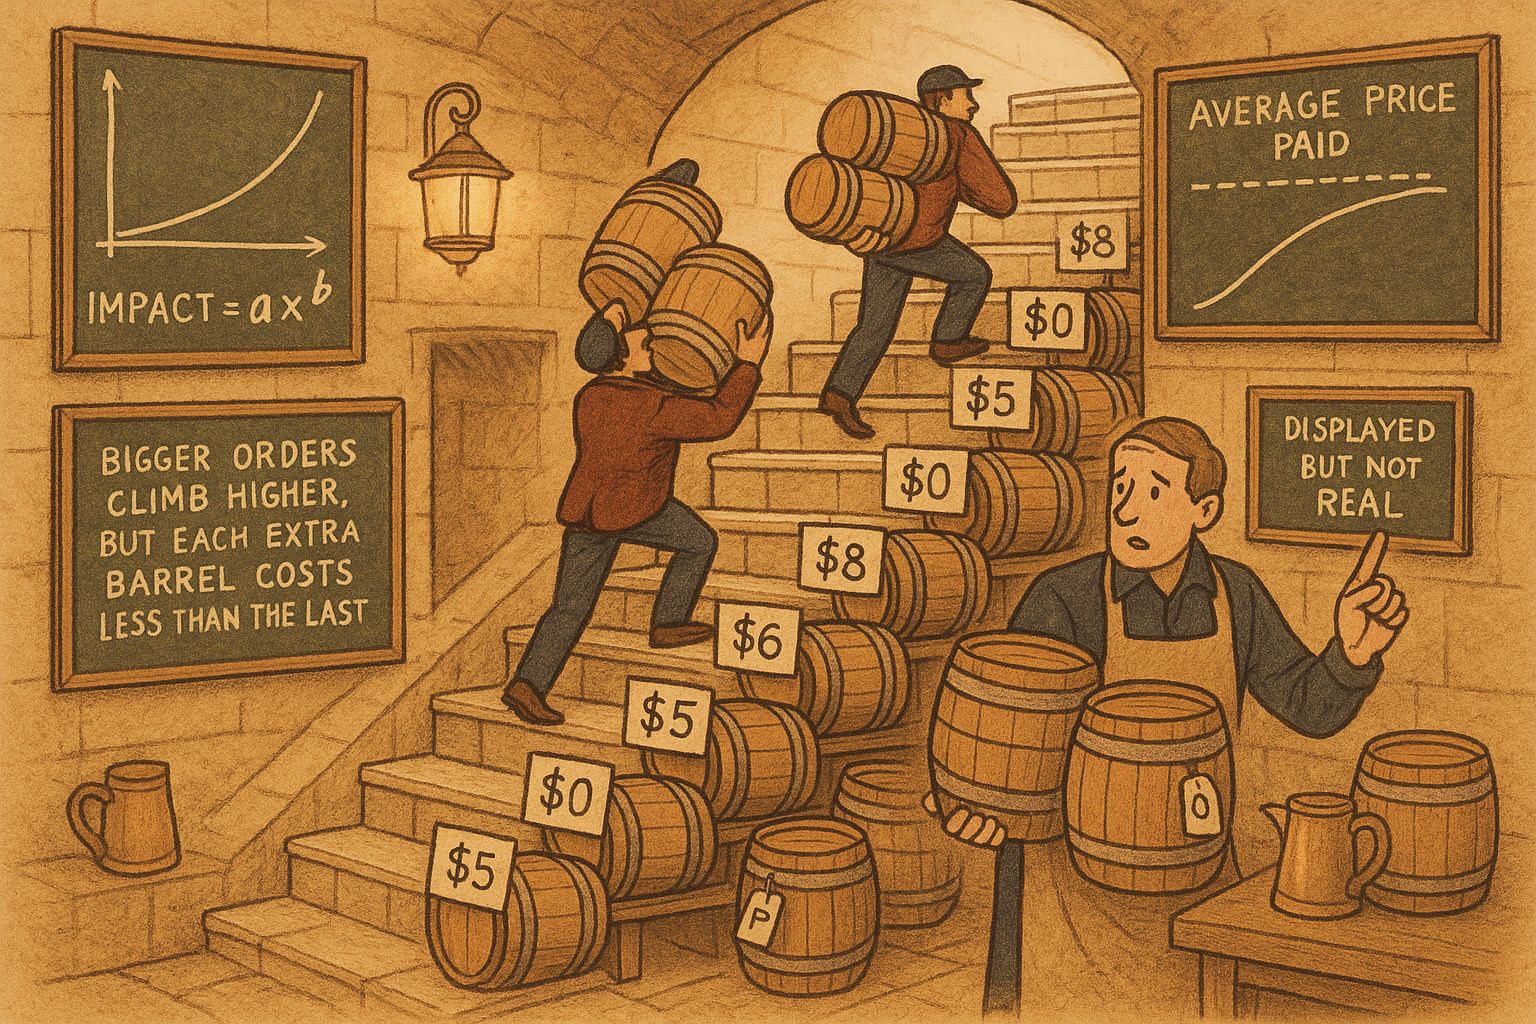
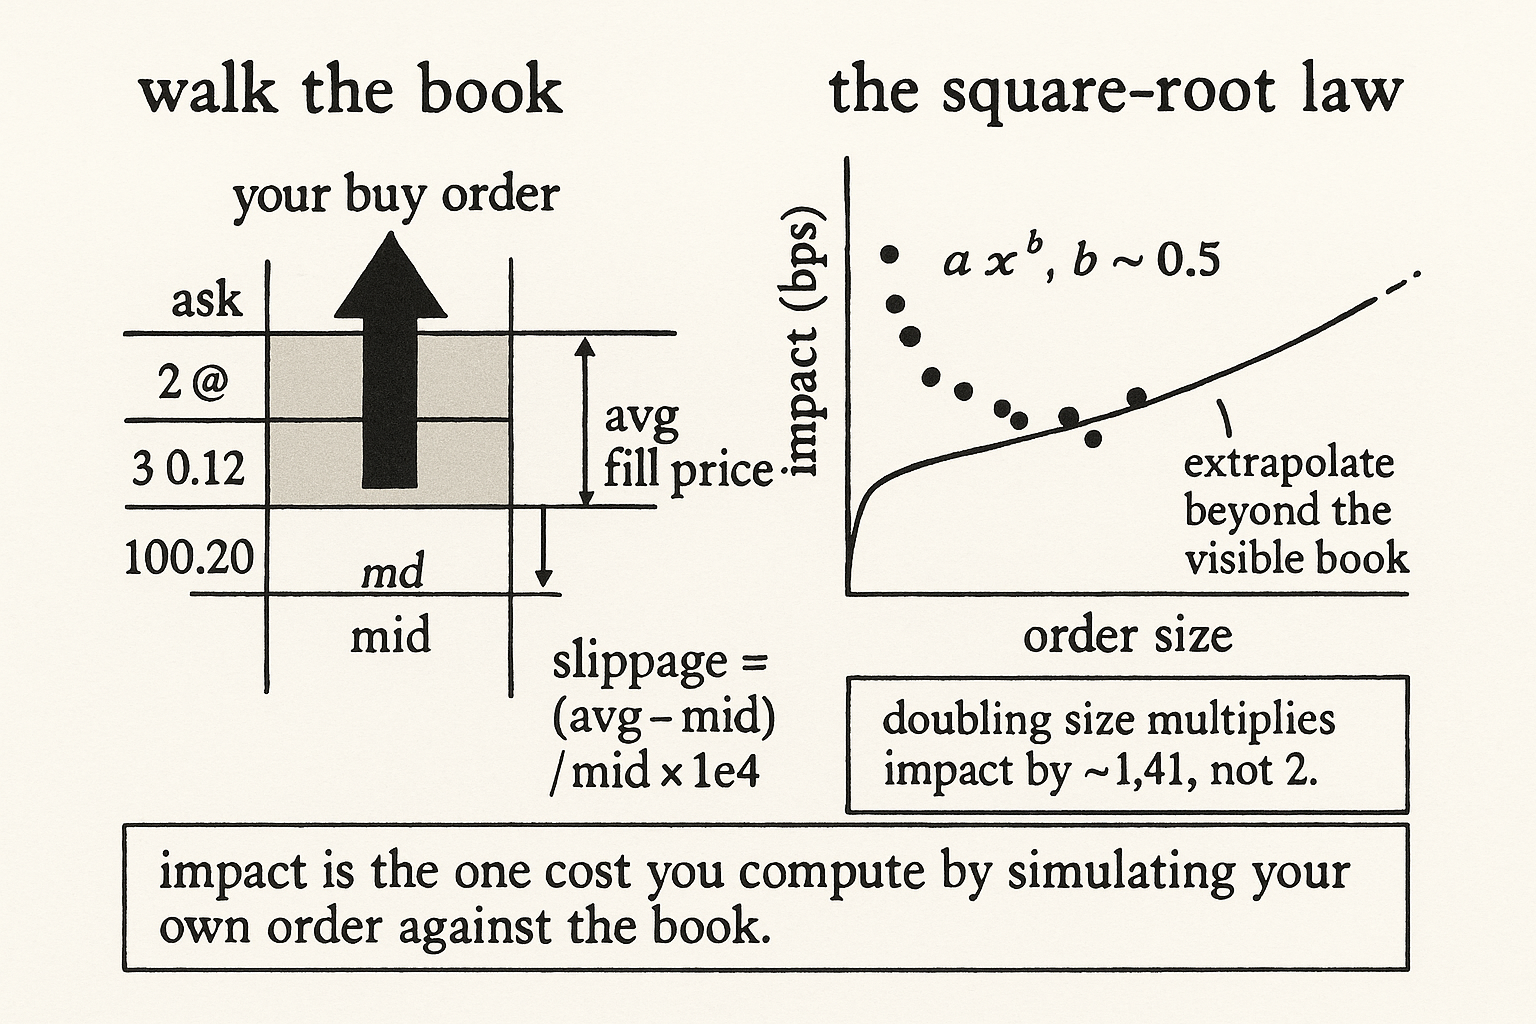
Market impact is the cost you simulate, not look up: walk the book level by level, slippage = (avg - mid)/mid x 1e4, then fit a·x^b. The exponent near 0.5 is the square-root law, and it lets you price sizes past the visible book.
The old article "Why Transaction Costs Should Be Added Before You Fall in Love" listed market impact as one of the five cost categories and warned that a strategy with a pre-cost Sharpe of 2.4 can collapse to negative once thin-instrument costs land. It named the cost. It did not tell you how to measure it. This article does, because impact is the one cost component you cannot read off a fee schedule, you have to compute it from the book by simulating what your order would actually do.
Impact is what happens when your order is bigger than the liquidity at the best price. You do not get filled at the mid. You eat the best level, then the next, then the next, paying a worse price at each step, and the average price you end up with is worse than where the market started. That gap is your slippage, and it grows with size in a specific, measurable shape.
Walk the book level by level
The measurement is a simulation against a real book snapshot. Take the order book at a timestamp, grab the top levels, sort by price, and find the mid. Then pretend to execute your order: consume the size at the best price, and if your order is larger, move to the next level and consume that, continuing until your full size is filled. You are walking the book, removing liquidity level by level the way a real market order would.
Two numbers come out. The average execution price is the size-weighted average of every level you ate, total cash paid divided by total quantity filled. The slippage is how far that average sits from the mid you started at, expressed in basis points.
$$ \text{avg price} = \frac{\sum_i q_i \cdot p_i}{\sum_i q_i} \qquad \text{slippage (bps)} = \frac{|\,\text{avg price} - \text{mid}\,|}{\text{mid}} \times 10{,}000 $$
Read the first as: for each level you consumed, multiply the quantity taken there by that level's price, sum across all levels, divide by total quantity, and you have your blended fill price. Read the second as: take the absolute distance from that blended price to the starting mid, divide by mid to get a fraction, multiply by ten thousand to put it in basis points. A 50-cent slip on a 100-dollar mid is 0.50 / 100 × 10,000 = 50 bps. That is the cost of clearing the book to your size, and it is invisible until you walk it.
The square-root law
Run the walk for many sizes and plot slippage against size. The curve is not a straight line, big orders do not cost proportionally more than small ones, they cost less per unit than a linear model would predict. The shape that fits is a power law, and the exponent lands near one-half, which is why it is called the square-root law of market impact.
$$ \text{impact}(x) = a \cdot x^{\,b}, \qquad b \approx 0.5 $$
Read it as: impact scales with order size x raised to a power b, where b comes out around 0.5, so doubling your size multiplies your impact by roughly the square root of two, about 1.41, not by two. The constant a is the instrument's sensitivity, thin books have a large a, deep liquid books a small one. You fit a and b by running the book-walk at a range of sizes to get empirical impact points, then regressing log-impact on log-size, the slope is b and the intercept gives a.
The square-root shape has a practical payoff: it lets you extrapolate. You can only walk the book as deep as your snapshot has levels, so for sizes larger than the visible book you have no empirical point. The fitted power law extends past the data, giving you an impact estimate for sizes bigger than anything the book shows, which is exactly what you need for capacity planning, the cost-versus-volume relationship the transaction-cost article said you must model.
Tying it to fill probability
Impact and fill probability are the same book read from two directions, which is why this extends the old article "Fill Probability from Trade Size CDFs." That article asked, for a resting quote, how likely a taker order is big enough to reach you, and built the answer from the distribution of taker sizes. Impact asks the mirror question: when you are the taker, how far up the book does your own size reach, and what does it cost. Both come from the same level-by-level structure of the book; one prices your passive fills, the other prices your aggressive ones.
For a maker this matters because you do both. You quote passively most of the time, but when inventory gets dangerous you cross to flatten, and the impact curve tells you what that exit costs. A position you cannot exit without paying 40 bps of impact is more toxic than its markout alone suggests, because the cost of getting out is part of the risk.
A worked number
Take an alt at a 100.00 mid with 2 BTC resting at 100.05, 3 BTC at 100.12, and 5 BTC at 100.20. You need to buy 4 BTC. You eat all 2 at 100.05 and 2 of the 3 at 100.12. Your average price is (2·100.05 + 2·100.12) / 4 = 100.085. Slippage is |100.085 − 100.00| / 100.00 × 10,000 = 8.5 bps. Now walk 8 BTC: 2 at 100.05, 3 at 100.12, 3 at 100.20, average (200.10 + 300.36 + 300.60) / 8 = 100.1325, slippage 13.25 bps. Doubling size from 4 to 8 BTC raised impact from 8.5 to 13.25 bps, a factor of about 1.56, in the neighborhood of the square-root's 1.41 rather than a linear 2.0. Fit a·x^b through these and more points and you have a function that prices any size, including ones deeper than the book you can see.
Cautions
The book-walk assumes the displayed book is the book, which the spoofing thread throughout this pillar says is dangerous in crypto, size that vanishes when you reach for it makes your simulated impact optimistic. It also assumes you take everything instantly in one sweep; spreading the order over time changes the cost, usually lowering it, because the book refills between your child orders, so the single-sweep walk is a worst-case snapshot, not the cost of a patient execution. And the fitted a is non-stationary, it tracks current liquidity, so a square-root law fit last week understates impact in this week's thinner book. Refit on recent snapshots, and treat the extrapolated tail as a planning estimate, not a promise.
Visualizing market impact
KEY POINTS
- Market impact is the cost you cannot read off a fee schedule; you compute it by walking the book, simulating your order eating liquidity level by level until filled.
- Two outputs: the size-weighted average execution price, and slippage = absolute distance from the starting mid over mid, times ten thousand, in basis points.
- Plot slippage against size and it bends: impact follows a power law a·x^b with b near 0.5, so doubling size multiplies impact by about 1.41, not 2. Fit a and b by regressing log-impact on log-size.
- The fitted square-root law lets you extrapolate impact for sizes deeper than the visible book, which is what capacity and cost-versus-volume planning need.
- Impact is the mirror of fill probability: same book, read as how far your aggressive order reaches instead of whether a taker reaches your passive quote. A maker needs both because crossing to flatten toxic inventory pays the impact cost.
- The walk assumes the displayed book is real (spoofing makes it optimistic) and assumes a single instant sweep (patient execution costs less as the book refills). The constant a is non-stationary, so refit on recent snapshots.
References
- Why Market Impact Follows a Square-Root Law (Bouchaud, Toth, and others)
- Trades, Quotes and Prices: Financial Markets Under the Microscope (Bouchaud, Bonart, Donier, Gould)
- The Price Impact of Order Book Events (Cont, Kukanov, Stoikov)
- Optimal Execution and Market Impact Models (Almgren, Chriss)
- The Art of Currency Trading - Brent Donnelly (Amazon)
- The Impact of Metaorders (Chapter 12, Trades, Quotes and Prices)
- How Efficiency Shapes Market Impact
- Slow Decay of Impact in Equity Markets: Insights from the ANcerno Database
- Strict Universality of the Square-Root Law in Price Impact Across Stocks
- The Two Square Root Laws of Market Impact and the Role of Sophisticated Market Participants
- The Subtle Interplay Between Square-root Impact, Order Imbalance and Price Diffusion
- Order Flows and Limit Order Book Resiliency on the Meso-Scale
- Quantifying Long-Term Market Impact