6.34 Lévy Distributions and Market Extremes
The Lévy distribution fits the body of returns far better than the Gaussian, with real power-law tails, and still misses the crashes. No single elegant curve captures the tail that kills you.
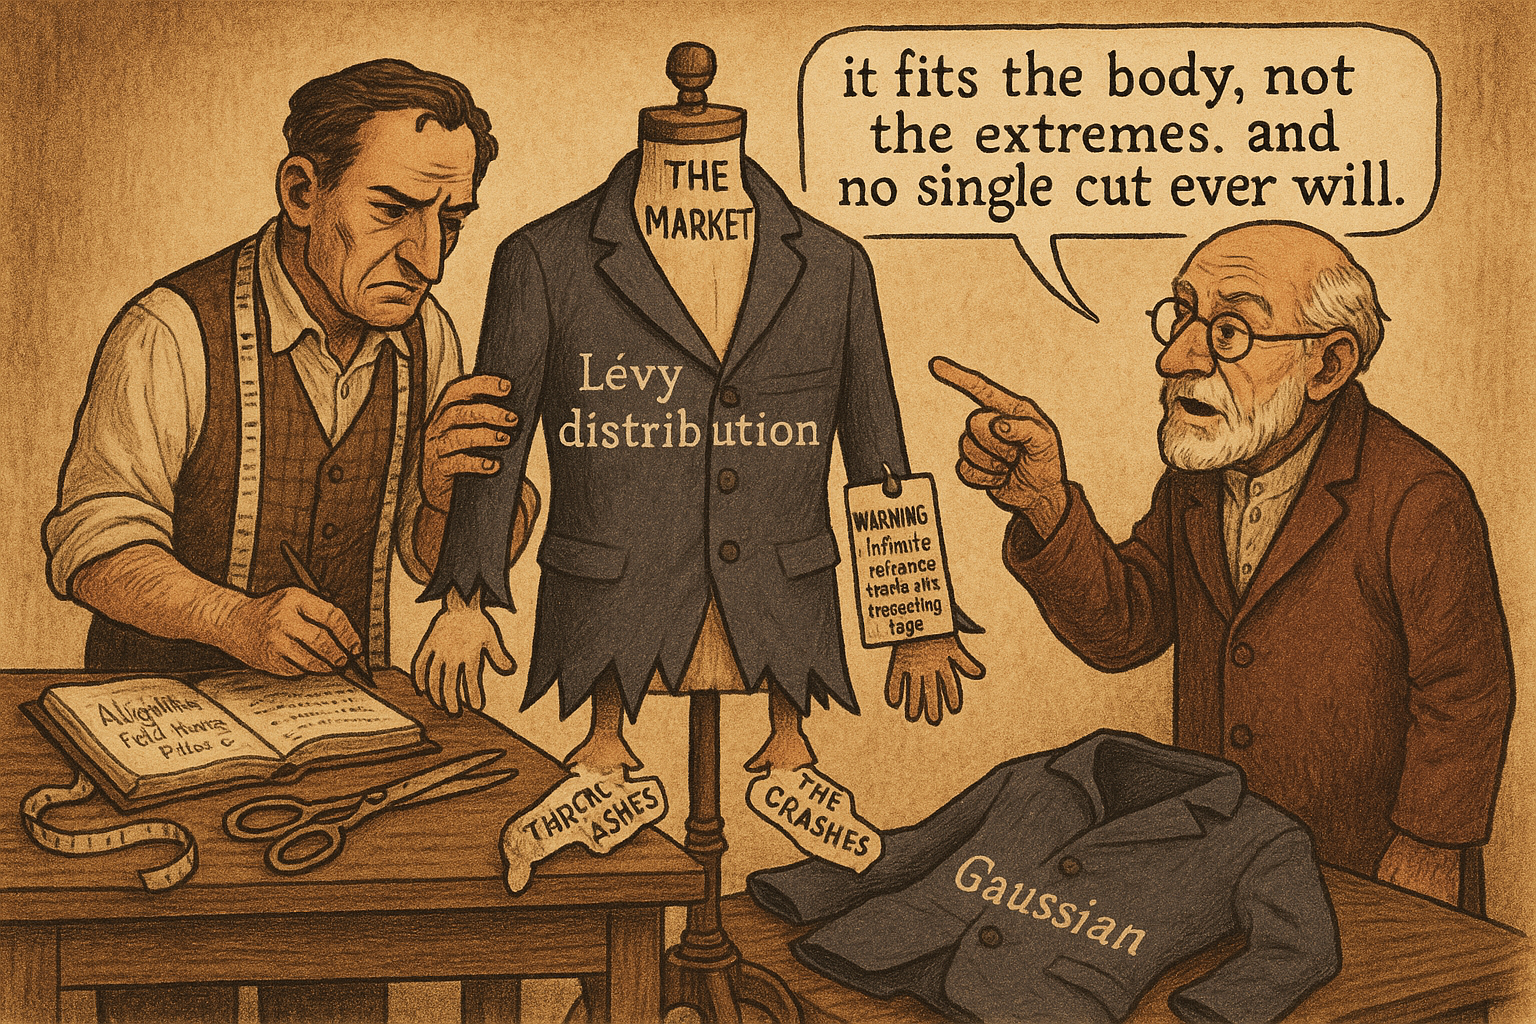
If the Gaussian is too thin-tailed to describe returns, the natural next move is to find a distribution with fatter tails that fits better, and the Lévy stable distribution is the classic candidate. It has genuine power-law tails, it captures the peaked center and heavy shoulders of real return distributions that the bell curve misses, and for a long stretch of econophysics it looked like the answer. It is a better description, and it still fails at the exact place you most need it to work, the crashes, which makes it a useful lesson in why no clean distribution rescues you from the tail. "Fat Tails: Why Gaussian Thinking Breaks Trading Systems" said returns are fat-tailed; this is what happens when you try to pin down the fat tail with a specific model.
A better fit for the body and shoulders
The Lévy stable family generalizes the normal distribution by adding a parameter that controls tail thickness. The Gaussian is a special case with the thinnest tails; dial the stability parameter down and the tails fatten into power laws, so the distribution starts assigning real probability to the large moves the Gaussian forbids. Fit a Lévy distribution to daily returns and it tracks them far better than a normal curve: it reproduces the sharp peak at the center, where calm days cluster more tightly than a bell curve, and the heavy shoulders, where moderate-to-large moves happen more than normality allows.
$$ P(|r| > x) \sim x^{-\alpha}, \quad 0 < \alpha < 2 $$
The Lévy tail decays as a power law with a stability index between 0 and 2. A smaller index means fatter tails and more extreme events; at the value 2 you recover the Gaussian. The power-law form is the right shape for the bulk of the return distribution, which is why Lévy and related stable laws describe the central part of market price variation quite well. For the everyday and even the moderately unusual move, the Lévy distribution is a real improvement, and if all you needed was a better model of normal-to-rough days it would be enough.
Where it breaks: the crashes
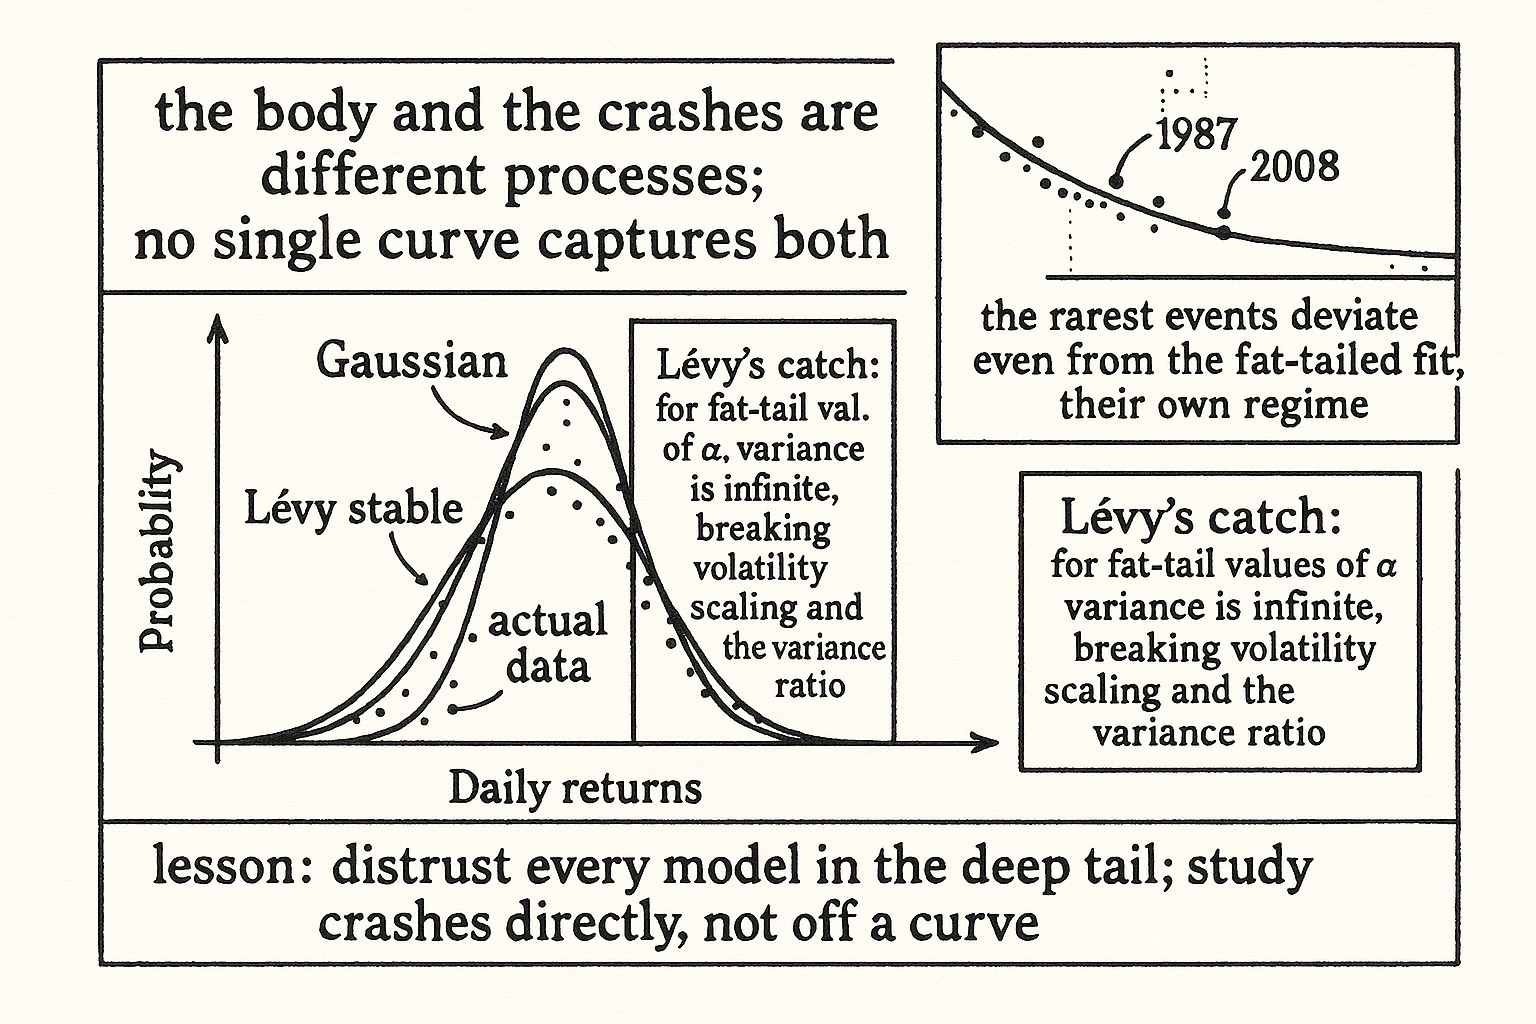
The trouble is that the rarest, most consequential events do not obey the same law as the body of the distribution. The Lévy distribution that fits the center and shoulders does not match the real crashes; the genuine extremes, the 1987s and 2008s, deviate even from the fat-tailed Lévy fit, sitting in their own regime that the single fitted distribution does not capture. The market behaves as if the everyday fluctuations and the catastrophic ones are generated by different processes, so a distribution calibrated to the common moves systematically misprices the rarest ones, and the rarest ones are the ones that determine whether you survive.
This is a deeper problem than picking the wrong curve. The Lévy stable distribution also has theoretical baggage that makes it awkward for trading: for the tail-fattening values of the stability index, the variance is infinite, which breaks every tool that relies on a finite variance, including the volatility scaling from "Why Volatility-Adjusted Position Sizing Matters" and the variance ratio from "Variance Ratio Tests for Traders". A model whose variance does not exist is hard to use for position sizing, even if it describes the data well, so you are caught between a Gaussian that is too thin and a Lévy that is too pathological, with the real distribution sitting uncomfortably between them and refusing to be either.
The lesson: no curve saves you from the tail
The practical takeaway is not to adopt the Lévy distribution and move on, but to absorb why even the better distribution fails. The tail of market returns is not a clean mathematical object that the right closed-form distribution captures; it is a mixture, the product of normal fluctuations most of the time and rare regime-driven catastrophes that follow their own logic, and no single elegant distribution describes both. Every attempt to nail the tail with one curve, Gaussian, Lévy, or anything else, succeeds on the part of the distribution it was fit to and fails on the part it was not, and the part it fails on is the part that kills you. So the response from the fat-tails article still holds: do not trust any model in the deep tail, size for moves beyond what any fitted distribution predicts, and treat the crashes as their own category, studied directly through stress tests and the complex-systems lens of "Why Financial Markets Are Complex Systems", not read off a probability curve. The Lévy distribution is the best illustration of the trap, because it is good enough to tempt you into trusting it and wrong enough, exactly at the extremes, to ruin you if you do.
Visualizing the Lévy fit and its failure
KEY POINTS
- The Lévy stable distribution generalizes the Gaussian with a parameter controlling tail thickness, producing genuine power-law tails. It fits the sharp peak and heavy shoulders of real returns far better than a bell curve.
- Its tail decays as a power law with a stability index between 0 and 2; smaller means fatter tails, and at 2 you recover the Gaussian. The power-law form is right for the bulk of the return distribution.
- It fails at the crashes. The genuine extremes deviate even from the fat-tailed Lévy fit, behaving as if everyday and catastrophic moves come from different processes, so a distribution fit to common moves misprices the rarest ones.
- The Lévy distribution also has infinite variance for its fat-tail values, which breaks every tool relying on finite variance, including volatility scaling and the variance ratio, making it awkward for position sizing.
- The deeper lesson is that the tail is a mixture of normal fluctuations and rare regime-driven catastrophes, and no single elegant distribution describes both. Every curve succeeds where it was fit and fails on the extremes that kill you.
- The response holds: distrust any model in the deep tail, size for moves beyond any fitted distribution, and treat crashes as their own category studied through stress tests and complex-systems thinking, not read off a curve.
References
- Systematic Trading - Robert Carver (Amazon)
- Trading Systems - Urban Jaekle Emilio Tomasini (Amazon)
- Power Laws in Economics and Finance
- US Stock Market Crash Risk, 1926–2006
- A Detailed Take on Fat Tails
- FACTOR INVESTING AND ASSET ALLOCATION
- Measuring Strategy-Decay Risk: Minimum Regime Performance and
- Forecasting Flash Crashes with Subordinated Lévy Processes
- FACTOR INVESTING AND ASSET ALLOCATION
- 1 Introduction - arXiv
- Time-independent models of asset returns revisited
- Econophysics: financial time series from a statistical physics point of view
- Pure Jump Lévy Processes for Asset Price Modelling
- Financial market models with Lévy processes and time-varying volatility
- Modeling Chinese stock returns with stable distribution
- Power law scaling and “Dragon-Kings” in distributions of intraday financial drawdowns
- Heavy-Tail-Aware Normalizing Flows for Financial Risk Management
- Multi-objective portfolio optimization under tempered stable Lévy
A note on AI. The ideas, research, analysis, and conclusions in this article are my own. I use AI tools to help with editing and wordsmithing, because English is not my first language, and I am not shy about that. AI-generated ideas and AI-assisted writing are not the same thing: the first is empty slop from a generic prompt, the second is a tool for communicating years of real research more clearly. Judge the work by its substance, not by whether software helped polish the prose.