5.34 Layering Forecasts Across Horizons: Blending on the Markout Curve
Got forecasts on different clocks? Don't pick the biggest. Normalize each to edge-per-second on its markout curve (30 bps/60s = 0.5 vs 2 bps/1s = 2) and average the curves to blend fast and slow edge into one.
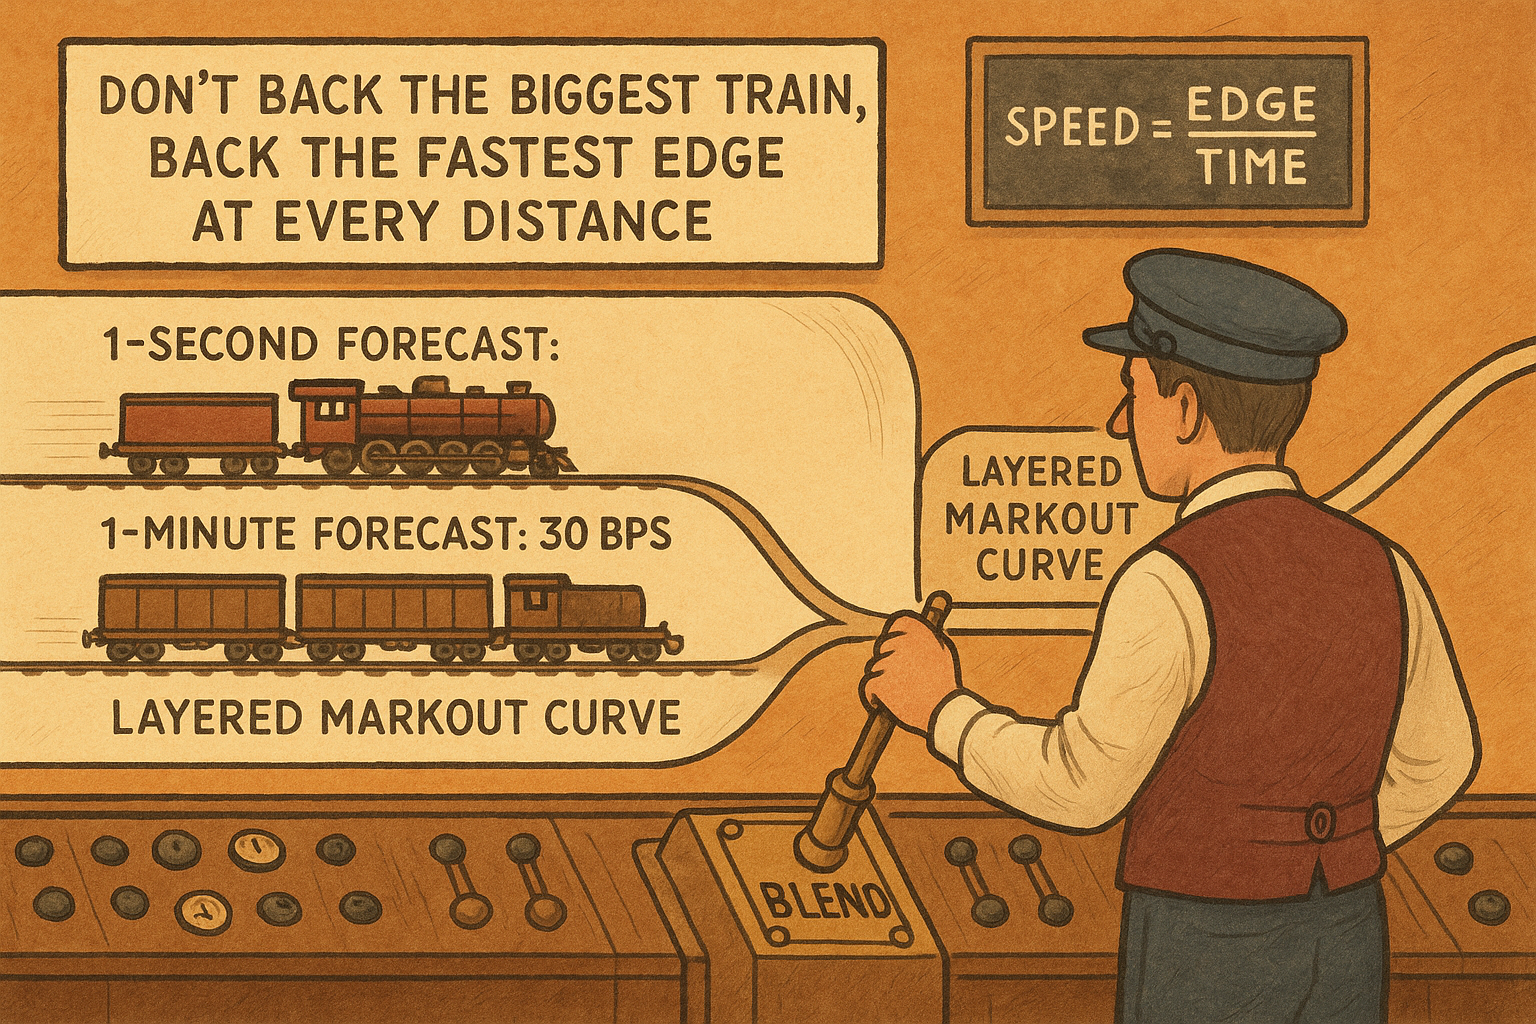
You rarely have one forecast. You have several, and they disagree about time. One model reads top-of-book imbalance and predicts the next second. Another reads slower trade-flow structure and predicts the next minute. Both are real edge, but they live on different clocks, and the naive move, picking the one with the bigger number, throws away the other. A 30 basis point forecast over a minute looks far stronger than a 2 basis point forecast over a second until you notice they are not the same unit.
The fix is to put every forecast on a common time basis and blend them there. The common basis is the markout curve measured per second. The old article "Markouts: The Truth Serum of Market Making" established the markout curve as the only honest measure of a quote's edge, the signed price change after a fill read across horizons. This article uses that same curve as the conversion factor that makes forecasts at different horizons comparable, so you can layer them instead of choosing between them.